


Managing Kubernetes costs effectively requires a robust tool like Kubecost. In this guide, we’ll walk through how to install and use Kubecost to gain insights into your Kubernetes spending.
Step 1: Install Kubecost on Your Kubernetes Cluster
Kubecost can be installed using Helm, which simplifies deployment.helm repo add kubecost https://kubecost.github.io/cost-analyzer/
helm repo update
helm upgrade --install kubecost kubecost/cost-analyzer --namespace kubecost --create-namespace
Once installed, you can access the Kubecost dashboard via port forwarding:kubectl port-forward --namespace kubecost deployment/kubecost-cost-analyzer 9090
Then, open http://localhost:9090 in your browser.
Step 2: Configure Cloud Integration
If you are running Kubernetes on a cloud provider like AWS, GCP, or Azure, you can integrate Kubecost with your cloud billing data. This enhances cost accuracy.
For AWS:helm upgrade --install kubecost kubecost/cost-analyzer --set cloudIntegration.enabled=true
For detailed configuration, refer to the Kubecost documentation.
Step 3: Analyze Costs and Optimize Resources
Kubecost provides detailed insights into Kubernetes spending, helping teams reduce cloud waste and optimize resource usage. Below is a step-by-step breakdown of how to check costs, identify wastage, and right-size workloads effectively.
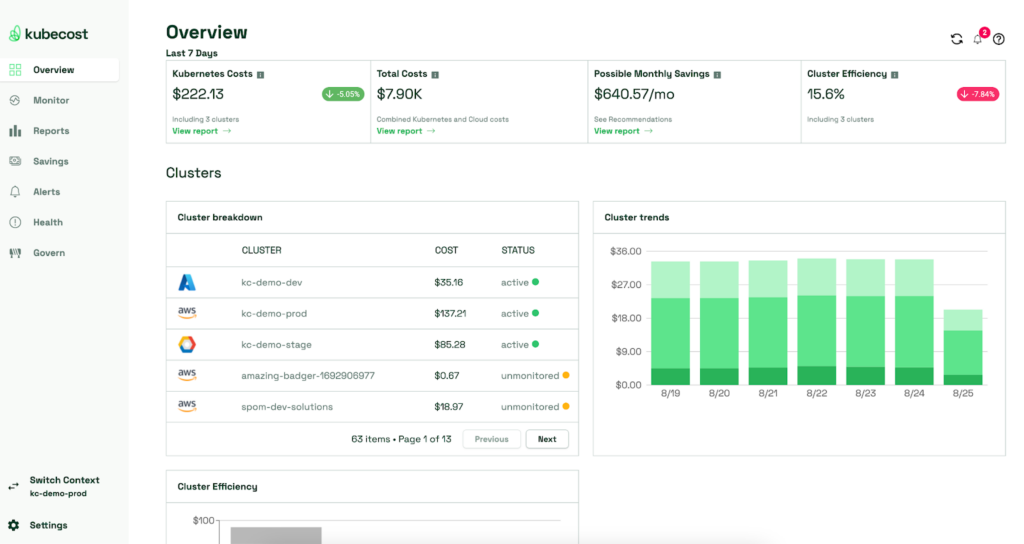
1. Check Cost Breakdown: Navigate to the Dashboard to View Costs per Namespace, Workload, and Labels
Kubecost’s dashboard provides an overview of cluster costs, with granular insights into individual workloads. Here’s how to analyze your Kubernetes costs:
Steps to Check Cost Breakdown:
- Access the Kubecost Dashboard:
- Open the Kubecost UI in your browser.
- Navigate to Cost Allocation under the main dashboard.
- View Cost by Namespace:
- Get a namespace-level breakdown of how much each application or team is spending.
- Identify the most expensive namespaces and analyze their resource consumption.
- Analyze Workload Costs:
- Go to Workload Cost Breakdown to see spending per deployment, pod, or container.
- Identify workloads consuming the most CPU, memory, or storage.
- Check Label-Based Cost Allocation:
- Kubecost allows cost tracking by custom labels (e.g., team, environment, application).
- Example: Filter costs by labels like
"team=devops"or"env=production".
- Compare Cloud Costs:
- If using multi-cloud environments (AWS, GCP, Azure), compare costs per provider.
- Identify which cloud services are costlier and why.
2. Identify Wastage: Use the “Efficiency” Section to See Underutilized Resources
- Go to the Efficiency Dashboard:
- Open Kubecost → Efficiency in the UI.
- Review efficiency scores for CPU, memory, and overall cluster usage.
- Check Underutilized Resources:
- Identify workloads with low CPU and memory utilization (e.g., using only 5% of allocated CPU).
- Find unused persistent volumes and orphaned storage consuming unnecessary costs.
- Analyze Idle Workloads:
- Review the list of workloads running but not actively serving traffic.
- Identify workloads that can be scaled down or terminated.
- Detect Over-Provisioned Resources:
- Check nodes with excess CPU/memory allocations.
- Identify costly instance types that are oversized for current workload demands.
3. Right-Size Your Workloads: Adjust Requests and Limits Based on Kubecost’s Recommendations
Right-sizing ensures workloads request and use only the necessary amount of CPU and memory—reducing cloud waste.
- Go to Kubecost’s Right-Sizing Recommendations:
- Open Kubecost → Recommendations in the UI.
- Review the list of pods, deployments, and containers with excessive resource requests.
- Adjust CPU & Memory Requests:
- If a pod is requesting 4 CPUs but only using 1 CPU, lower the request:
resources: requests: cpu: "1" memory: "2Gi"- This prevents unnecessary node provisioning, lowering costs.
- Update Resource Limits (if needed):
- If a pod occasionally spikes in usage, set a limit to prevent overconsumption:
resources: limits: cpu: "2" memory: "4Gi" - Apply Changes & Monitor Impact:
- Deploy updated configurations using:
kubectl apply -f deployment.yaml- Monitor resource usage in Kubecost’s Cost Allocation Dashboard to confirm savings.
4. Set Up Alerts
Kubecost allows you to set up alerts for budget thresholds. You can configure Slack or email notifications to get notified of cost spikes.
yamlCopyEditalerts:
  enabled: true
  threshold: 80 # Alert when cost exceeds 80% of the budget
  channels:
    - slack
    - email
Conclusion
Kubecost is a powerful tool that helps organizations monitor, analyze, and optimize Kubernetes costs. By implementing it, you can ensure better resource utilization and reduce unnecessary cloud expenses.