


“Chaos engineering is the discipline of experimenting on a system in order to build confidence in the system’s capability to withstand turbulent conditions in production”(Wiki). In the previous blog, I’ve shared about the overview of Chaos engineering, so in this one, we’ll focus on a tool named Litmus which supports us to implement Chaos engineering.
1.Litmus introduction
Litmus is an open-source Chaos Engineering platform that enables teams to identify weaknesses & potential outages in infrastructures by inducing chaos tests in a controlled way. LitmusChaos will focus on the applications which leverages Kubernetes to build their system. With Litmus, we can easily create experiments related to AWS, Azure, GCP, Kubernetes, etc.
1.1 Litmus architecture
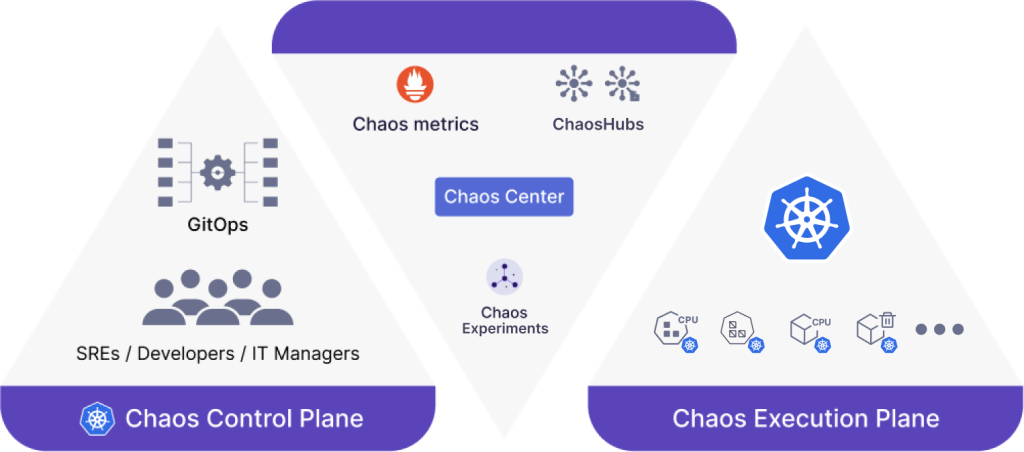
Litmus includes 2 main components: Chaos Control Plane and Chaos Execution Plane
1.1.1 Chaos Control Plane
Chaos Control Plane includes:
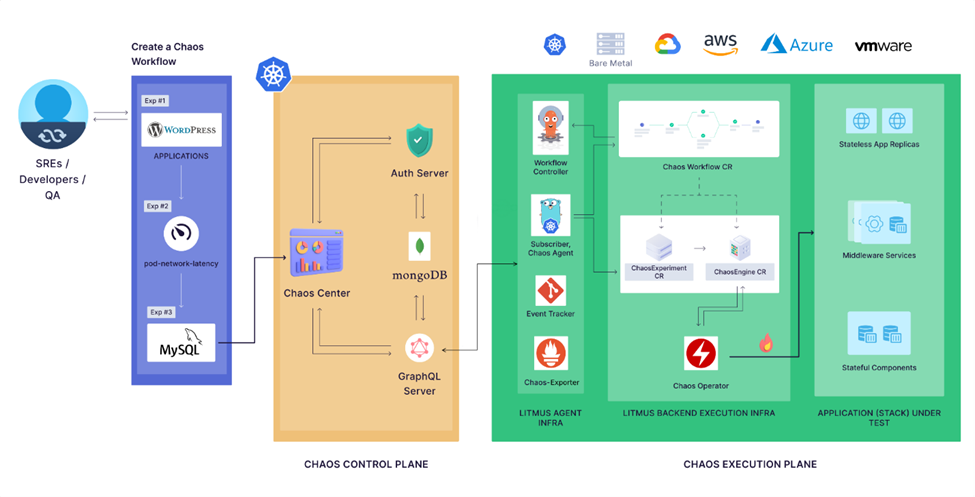
- Chaos Center: the web portal supports us to create the experiments easily as well as shows the result of the experiment execution.
- Auth Server is a Golang micro-service that is responsible for authorizing, authenticating the requests received from ChaosCenter and managing users along with their projects
- MongoDB is the database which stores all the information related to user account, Chaos experiment, ChaosHub, project, etc.
- GraphQL Server is the microservice that handles requests from ChaosCenter by either querying the database for relevant data or retrieving information from the Execution Plane.
1.1.2 Chaos Execution Plane
For executing the Chaos experiments on our AUT, we need to have access to the cluster in which our application is deployed. It means the Chaos Execution Plane components should be deployed in the same cluster with our application. There are 2 main components of Litmus will be deployed in the cluster:
- Litmus Agent Infra: this component is responsible for facilitating the experiments, managing the communication between Chaos Control Plane and Litmus Backend Execution Infra, aggregating results, logs, and metrics from chaos runs for visualization and reporting.
- Litmus Backend Execution Infra: This is the part of the system that directly runs chaos experiments within the target environments. When the experiment is triggered, the pods which interact directly with the AUT will be initialized. After finishing, they will be cleaned.
1.2 Litmus concepts
In this section, we’ll go through some common concepts of LitmusChaos which will be shown on the Chaos center.
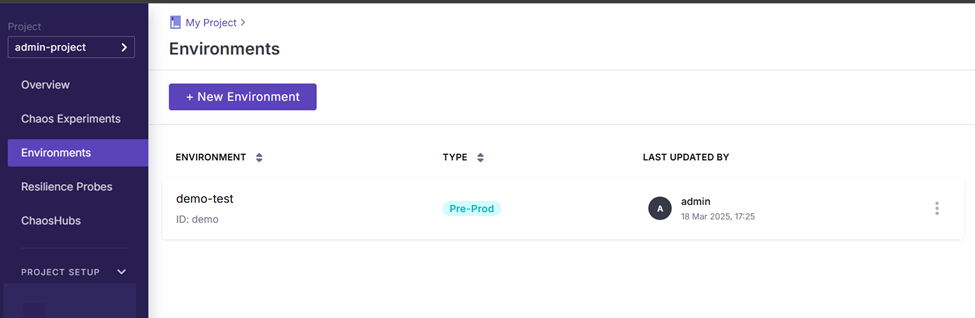
1.2.1 Chaos infrastructure
Chaos infrastructure is a service which is deployed inside the application environment so that it can access and inject fault into the system. Of course, all the services of Chaos infrastructure should be granted necessary permissions. On the web portal, we can go to Chaos environment menu for creating new environments and enabling Chaos.
1.2.2 Chaos Hub
Chaos Hub is the place in which the experiment and fault templates are stored. We can connect to the public hub of Litmus by default or connect to a Git repository for private Chaos Hub.
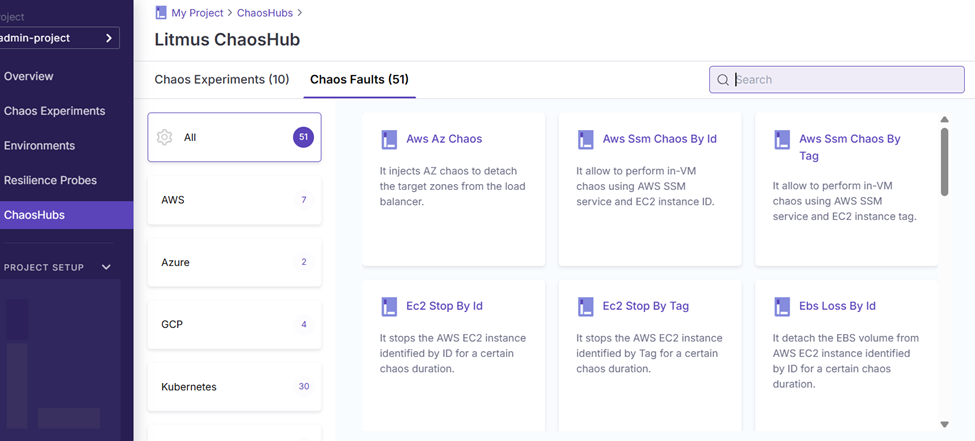
1.2.3 Chaos Experiment
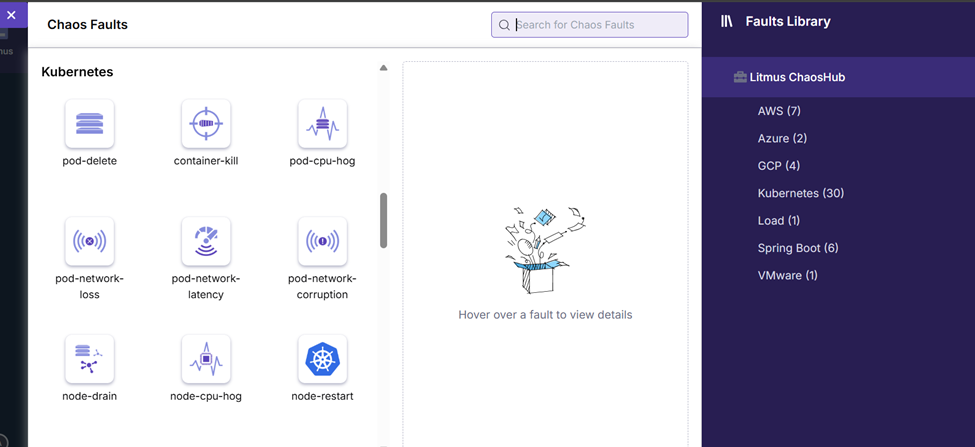
A chaos experiment consists of a sequence of chaos faults designed to simulate a failure scenario. These faults target different components of an application, including its microservices and the supporting infrastructure. For each kind of faults, we can adjust the parameters for them so that it can fit with your system. There’re some main chaos faults groups in default Chaos Hub.
- AWS
- Azure
- GCP
- Kubernetes
- Load
- Springboot
- VMware
Of course, we can create customized faults by ourselves and save it in private ChaosHub.
1.2.4 Resilience Probes
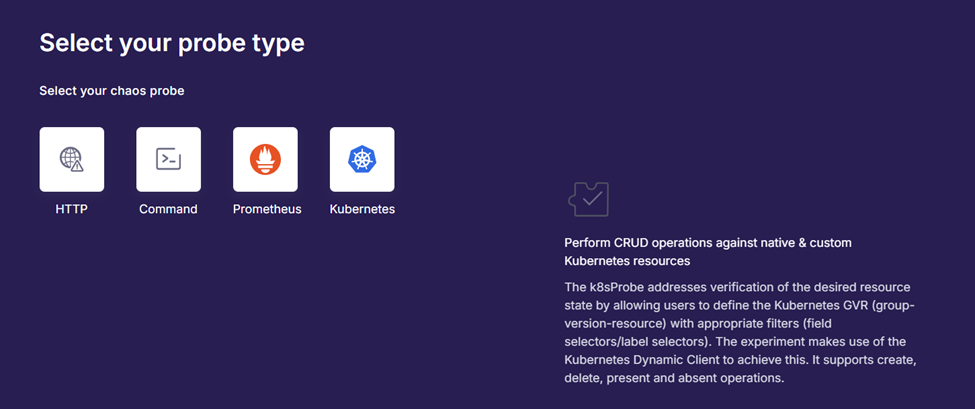
While running the Chaos experiments, we need to validate if our system can still work well. Currently, LitmusChaos supports Resilience Probes to verify it. Resilience Probes can be implemented in 4 ways:
- Http: we can use it to query if the url is working.
- Command: we can implement some bash script to check the health of the system. After that, this probe type can execute the script.
- Prometheus: this probe allows users to run the Prometheus query so that we can check whether its data satisfies the defined metric criteria.
- Kubernetes: this probe can perform CRUD operation against Kubernetes resources.
The probe can be executed before, after or in the meantime of experiment execution.
2.LitmusChaos pros and cons
For choosing Litmus as the tool for implement Chaos Engineering on your system, we need to care about the advantage and disadvantage of this tool.
2.1 Pros
- Kubernetes-Native: good support for Kubernetes system
- Extensible Chaos Hub: we can create customized Chaos experiments.
- Chaos Center (Web Portal): LitmusChaos supports Chaos Center as the web portal so that the user can easily set up and monitor the Chaos experiment execution.
- Observability & Reports: LitmusChaos provides good test report with detailed log so that we can investigate the issue more easily.
- Opensource tool: it’s an open-source tool and totally free.
- Good community
2.2 Cons
- Complex setup for beginners
- Portal can be resource-heavy
- Documentation could be clearer
- Only for Kubernetes
Conclusion
For practicing with Chaos Engineering, Litmus is a good choice. However, we should prepare the knowledge related to Kubernetes for setting up and using it effectively. In the next article, I’ll share the detailed information about how to set up and create a simple experiment with Litmus.
Reference:
- https://docs.litmuschaos.io/docs/introduction/what-is-litmus
- https://blog.nashtechglobal.com/chaos-engineering-in-shift-right-testing/