


Load testing is a crucial step in ensuring your applications can handle anticipated user traffic without breaking a sweat. Azure Load Testing is a fully managed service that enables you to generate high-scale load, identify performance bottlenecks, and ensure your applications remain robust under pressure.
1. What is Azure Load Testing?
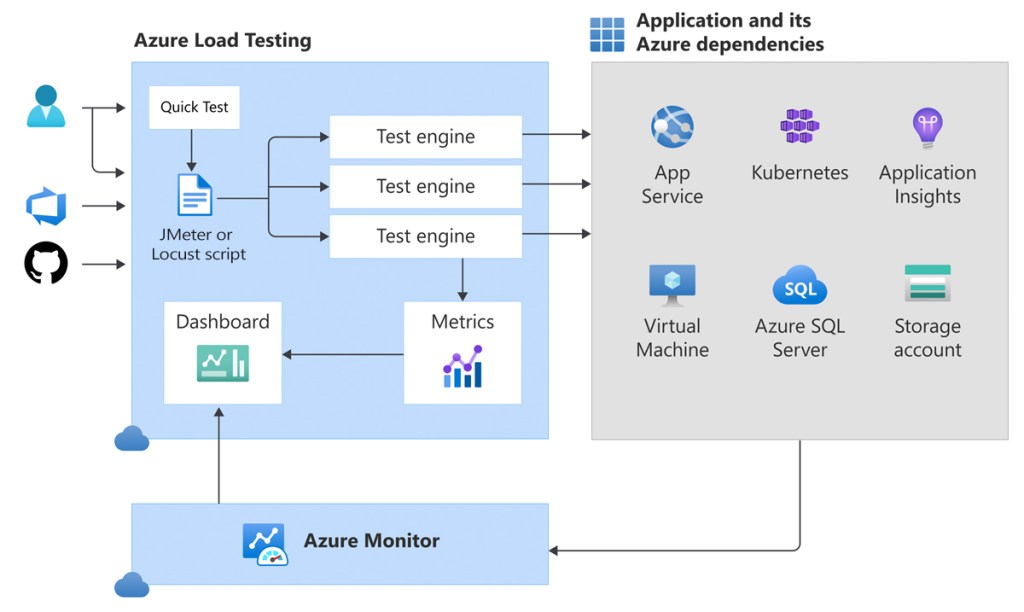
Azure Load Testing is a service provided by Microsoft Azure that allows developers and testers to generate high-scale loads to identify performance bottlenecks in applications and automate regression testing. Azure Load Testing is designed to help optimize the performance, scalability, and capacity of applications by simulating real-world loads.
Azure Load Testing is a cloud-native load testing service that allows you to:
- Generate High-Scale Load: Simulate thousands or millions of virtual users.
- Identify Performance Bottlenecks: Pinpoint issues in your application, database, or infrastructure.
- Integrate with CI/CD: Automate performance testing in your development pipeline.
- Monitor Client-Side & Server-Side Metrics: Get a comprehensive view of performance.
1.1. Usage Scenarios
Azure Load Testing supports a wide range of application types by leveraging Apache JMeter and Locust as test frameworks. You can simulate load on:
- Web applications over HTTP/HTTPS
- RESTful APIs
- Databases via JDBC (JMeter only)
- TCP-based endpoints
For advanced use cases, both frameworks are extensible:
- JMeter allows integration with plugins to test additional protocols and services.
- Locust supports Python libraries, third-party extensions, and custom plugins.
If you’re testing a simple URL, the quick test experience lets you input an HTTP endpoint directly. For more complex scenarios, uploading a custom JMeter script unlocks full protocol support.
Note: Azure Load Testing currently supports only Apache JMeter and Locust—other frameworks are not yet supported.
1.2. Identify Performance Bottlenecks
Azure Load Testing helps detect performance issues early by simulating high-scale traffic. During a test, the dashboard shows real-time client and server metrics. After the test, you can:
- Analyze results to find bottlenecks
- View resource metrics for Azure apps
- Compare test runs to spot regressions
- Download results for further analysis
2. Why Use Azure Load Testing?
Azure Load Testing helps you evaluate how your application performs under high load, so you can identify and fix performance issues before releasing to users.
- Detect performance issues early: You can simulate high traffic to find out how your app behaves under stress. This helps you catch performance problems before users experience them.
- No infrastructure setup needed: Azure takes care of all the test engine infrastructure. You don’t need to manage servers or install any tools.
- Real-time performance monitoring: While the test is running, you can see live data like response time, error rate, and system usage. This makes it easy to spot what’s slowing things down.
- Deep insights for Azure apps: If your app runs on Azure, the tool can connect to services like App Service or AKS to show more detailed metrics—like CPU spikes or slow database calls.
- Works with CI/CD pipelines: You can add performance tests to your deployment process. If the app is too slow, the pipeline can fail before reaching production.
- Track changes over time: Test results are saved so you can compare current and past runs. This helps you catch any drop in performance as your app evolves.
- Supports JMeter and Locust: These tools support many types of systems and protocols. You can test websites, APIs, databases, and even custom systems.
- Test private endpoints: You can test apps that aren’t public—like staging environments or internal microservices—using Azure Virtual Network.
- Flexible load simulation: You can choose how many virtual users or test engines to use. This allows you to simulate thousands or even hundreds of thousands of users.
- Run multiple tests at once: You can run several tests at the same time to check different features or versions quickly.
3. When Should You Use Azure Load Testing?
- For preparing for a production release, to validate application behavior under expected traffic levels
- For implementing major code or infrastructure changes, ensuring performance remains stable.
- For integrating performance testing into CI/CD pipelines (Azure DevOps, GitHub Actions) to automatically enforce SLAs.
- For migrating apps to Azure (e.g., App Service, AKS, Function Apps) and needing to validate new environment stability.
- For troubleshooting performance regressions or slowdowns, by comparing historical test runs.
- For testing internal or private endpoints within a Virtual Network (VNet), such as staging or microservice backends.
- For benchmarking scalability, simulating high numbers of virtual users and engines to test limits.
- For validating SLAs and performance KPIs, using failure criteria settings within tests.
- For comparing performance across different app versions or environments to spot regressions or improvements.
4. Key Foundations for Load Testing
4.1. Prerequisites before You Start
Before you begin, ensure you have:
| Prerequisite | Description |
|---|---|
| Azure Subscription | An active Azure subscription |
| Azure Load Testing Resource | Resource to manage and run load tests |
| Public or Private Endpoint | URL endpoint to be tested |
| Role-Based Access Control (RBAC) | Contributor/Owner role; Network Contributor if testing private endpoints |
| JMeter/Locust Script (Optional) | For customized load testing scenarios |
| Azure CLI ≥ 2.2.0 (Optional) | For CI/CD integration or automation via CLI |
4.2. Core Concepts Explained
4.2.1. Virtual Users
Virtual Users (VUs) simulate real users interacting with your application. Each virtual user operates independently, helping evaluate how your system performs under concurrent load.
How it works:
- Jmeter
-Virtual users are referred to as threads, defined within a Thread Group in the JMX script.
The total number of virtual users is calculated using the formula:
– Total Virtual Users = (Users in Script) × (Number of Test Engine Instances)
– You can increase the load by adjusting either the number of threads in the script, the number of test engine instances, or both.
- Locust
– Virtual users are called users and can be configured via the web UI, command line arguments, environment variables, or a configuration file.
– The number of users specified directly determines the load, and Azure Load Testing will allocate test engine instances accordingly to meet that target.
4.2.2. Scaling Options:
To simulate a higher load, you can:
- Increase the number of users or threads in your test script
- Increase the number of test engine instances
- Combine both for greater flexibility and scale
4.2.3. Ramp‑Up Time
Ramp-up time defines how gradually virtual users are introduced during a load test, helping simulate realistic traffic growth instead of sending all users at once.
JMeter
– Ramp-up time is specified in seconds.
– Example: If you set 20 virtual users and 120 seconds ramp-up, one user starts every 6 seconds (120 ÷ 20).Locust
– Ramp-up is controlled using spawn rate (users per second).
– Example: With 20 users and a spawn rate of 2, Locust adds 2 users per second, reaching full load in 10 seconds.
4.2.4. Response Time & Latency
Response Time measures end‑to‑end time for a request (not including client-side rendering).
Latency is the time from request start until the first byte of the response is received.
4.2.5. Requests Per Second (RPS)
RPS, also called throughput, measures how many requests your load test sends to the server per second.
Basic formula: RPS = Total requests / Total test time (in seconds)
Planning for a target RPS: Virtual Users = RPS × Latency (in seconds)
For example, given an application latency of 20 milliseconds (0.02 seconds), to simulate 100,000 RPS, you should configure the load test with 2,000 virtual users (100,000 * 0.02).
4.2.6. Azure Load Testing Resource
The Azure load testing resource is the top-level resource for your load-testing activities. This resource provides a centralized place to view and manage load tests, test results, and related artifacts. When you create a load test resource, you specify its location, which determines the location of the test engines. To run a load test for your application, you add a test to your load testing resource.
4.2.7. Tests & Test Runs
Test: A test defines how Azure Load Testing simulates load on your application. It includes: A test plan (JMeter script, Locust script, or URL list). Test settings: environment variables, secrets, scaling, pass/fail rules, monitoring, and optional input files. Azure supports all protocols from JMeter and Locust—not just HTTP. Other testing frameworks are not supported.
Test Run: A test run uses the exact settings (scripts, parameters, scaling, fail criteria) from when it was launched. Test updates do not affect previous test runs. Example: If you change the thread count or script in a test, existing runs remain unchanged. If you re-run a past test run, Azure reuses its original configuration—not the current test settings. You can analyze results directly in the Azure portal or export logs and result files.
4.2.8. Test Engine Instances
A test engine is the Azure-managed infrastructure that executes your load test scripts. Multiple engine instances run in parallel to simulate high traffic.
You can scale out by increasing the number of test engine instances.
Engines run in the same region as your Azure Load Testing resource.
Each engine uses a Standard_D4d_v4 VM (4 vCPUs, 16 GB RAM, Azure Linux).
JMeter tests use JDK 21 and JMeter 5.6.3.
Locust tests use Python 3.9.19 and Locust 2.33.2.During testing, logs from all engines are collected and aggregated.
You can download them for analysis.The load pattern determines how the load is distributed over the duration of the load test. Examples of load patterns: linear, stepped, spike.
4.2.9. App Components & Metrics
Client‑side metrics: From test engines—virtual user count, response times, error rates, RPS
Server‑side metrics: Captured via Azure Monitor for Azure-hosted apps (e.g. CPU, memory, HTTP status codes, DB reads).
You define fail criteria based on these metrics to automatically stop tests when thresholds are exceeded.
5. Quick start: Run Your First Test
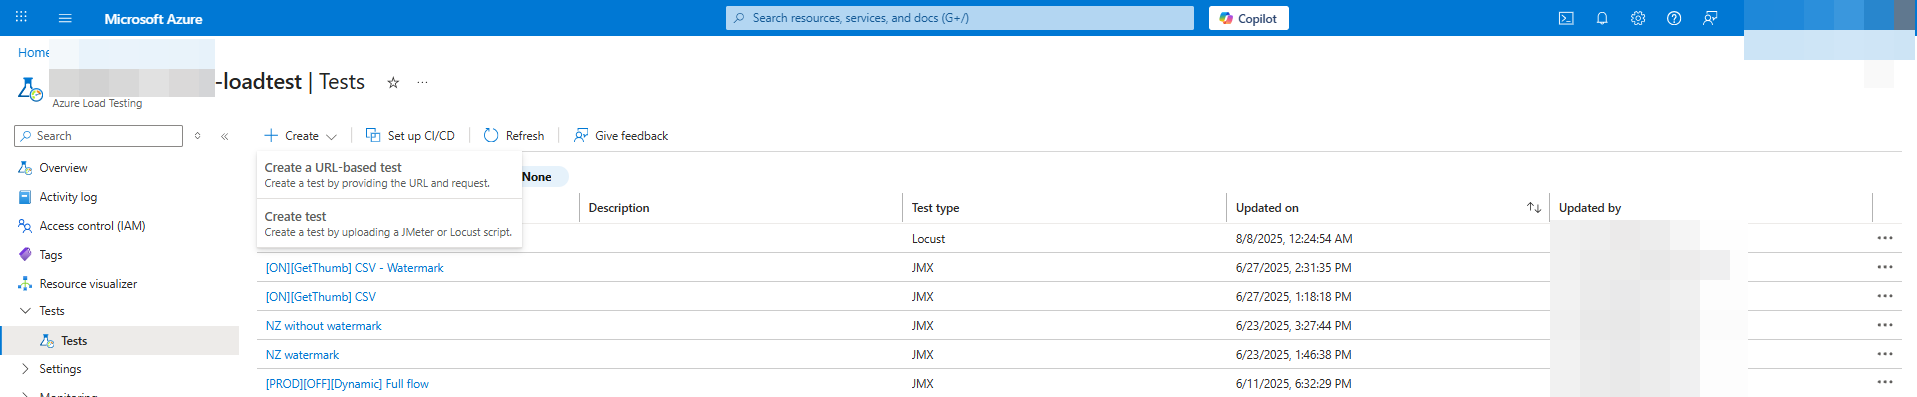
First, let’s take a quick look at Azure Load Testing and how to navigate to it in the Azure portal. From the main screen, click on the Azure Load Testing icon.
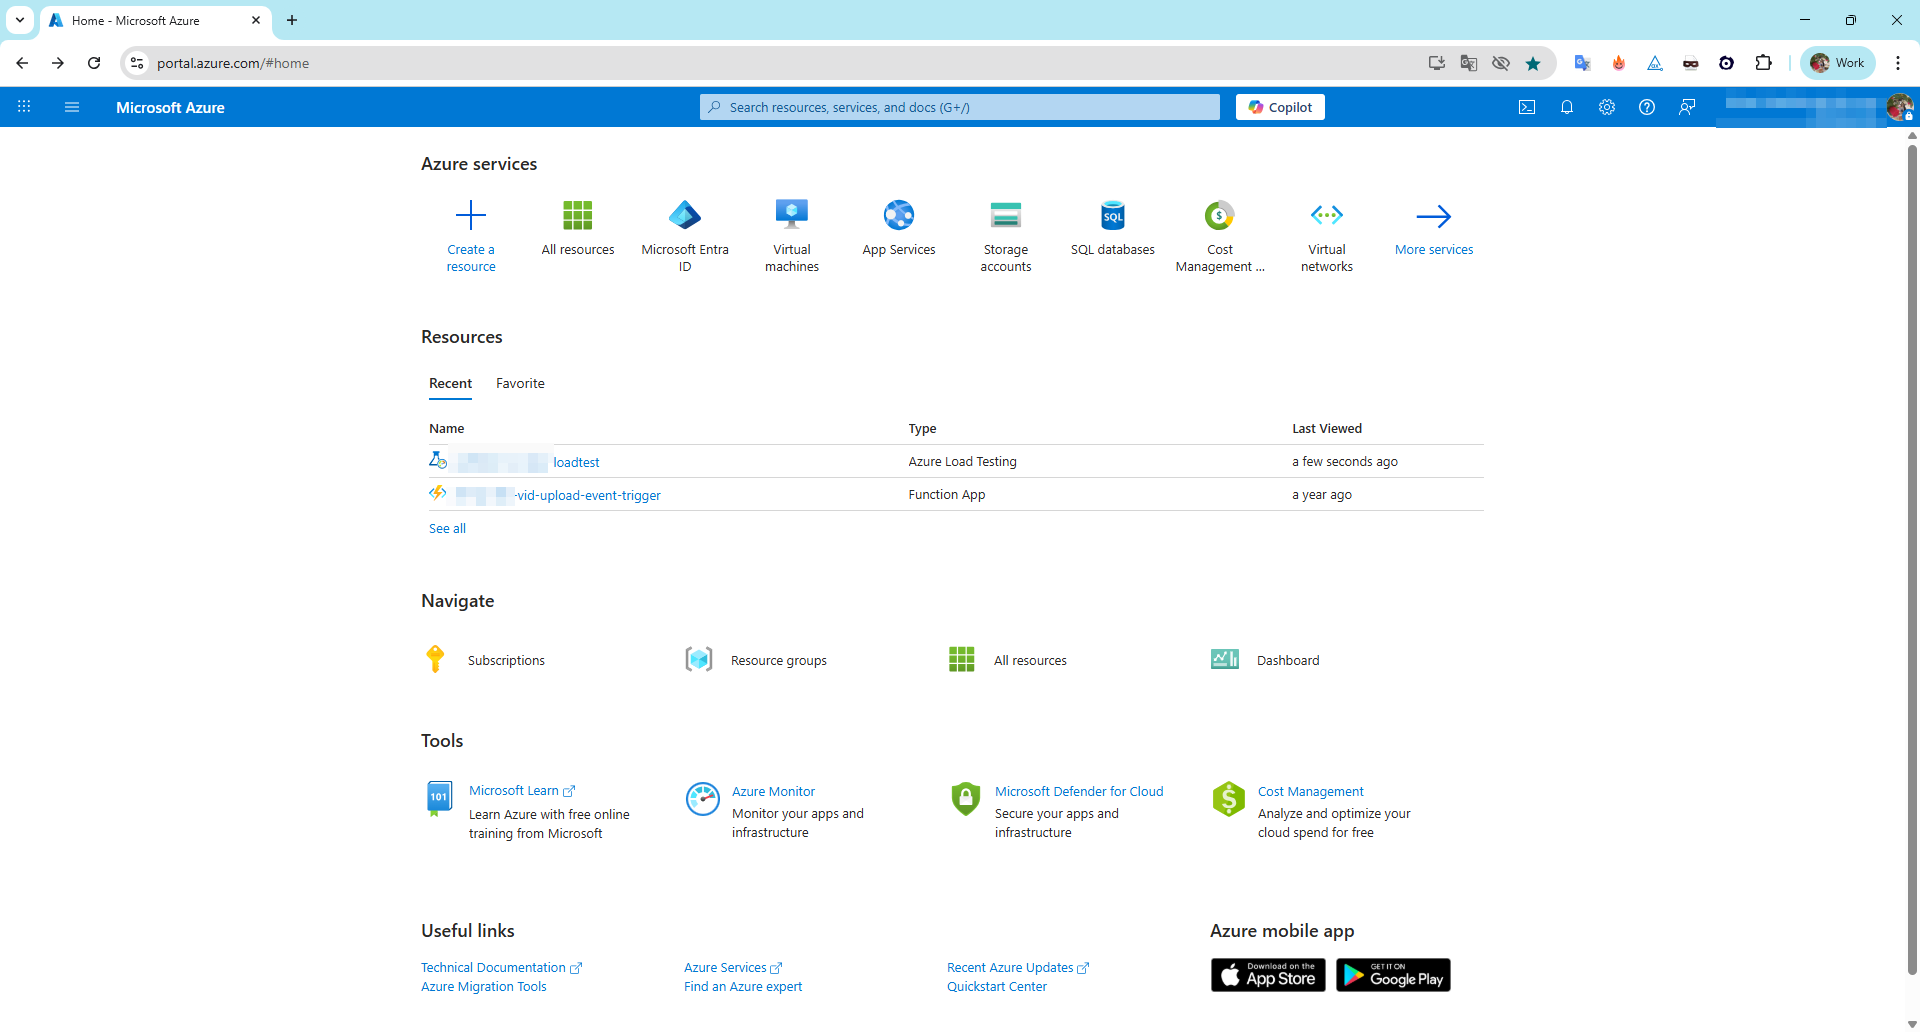
We are now on the Azure Load Testing dashboard, as shown in the image below.
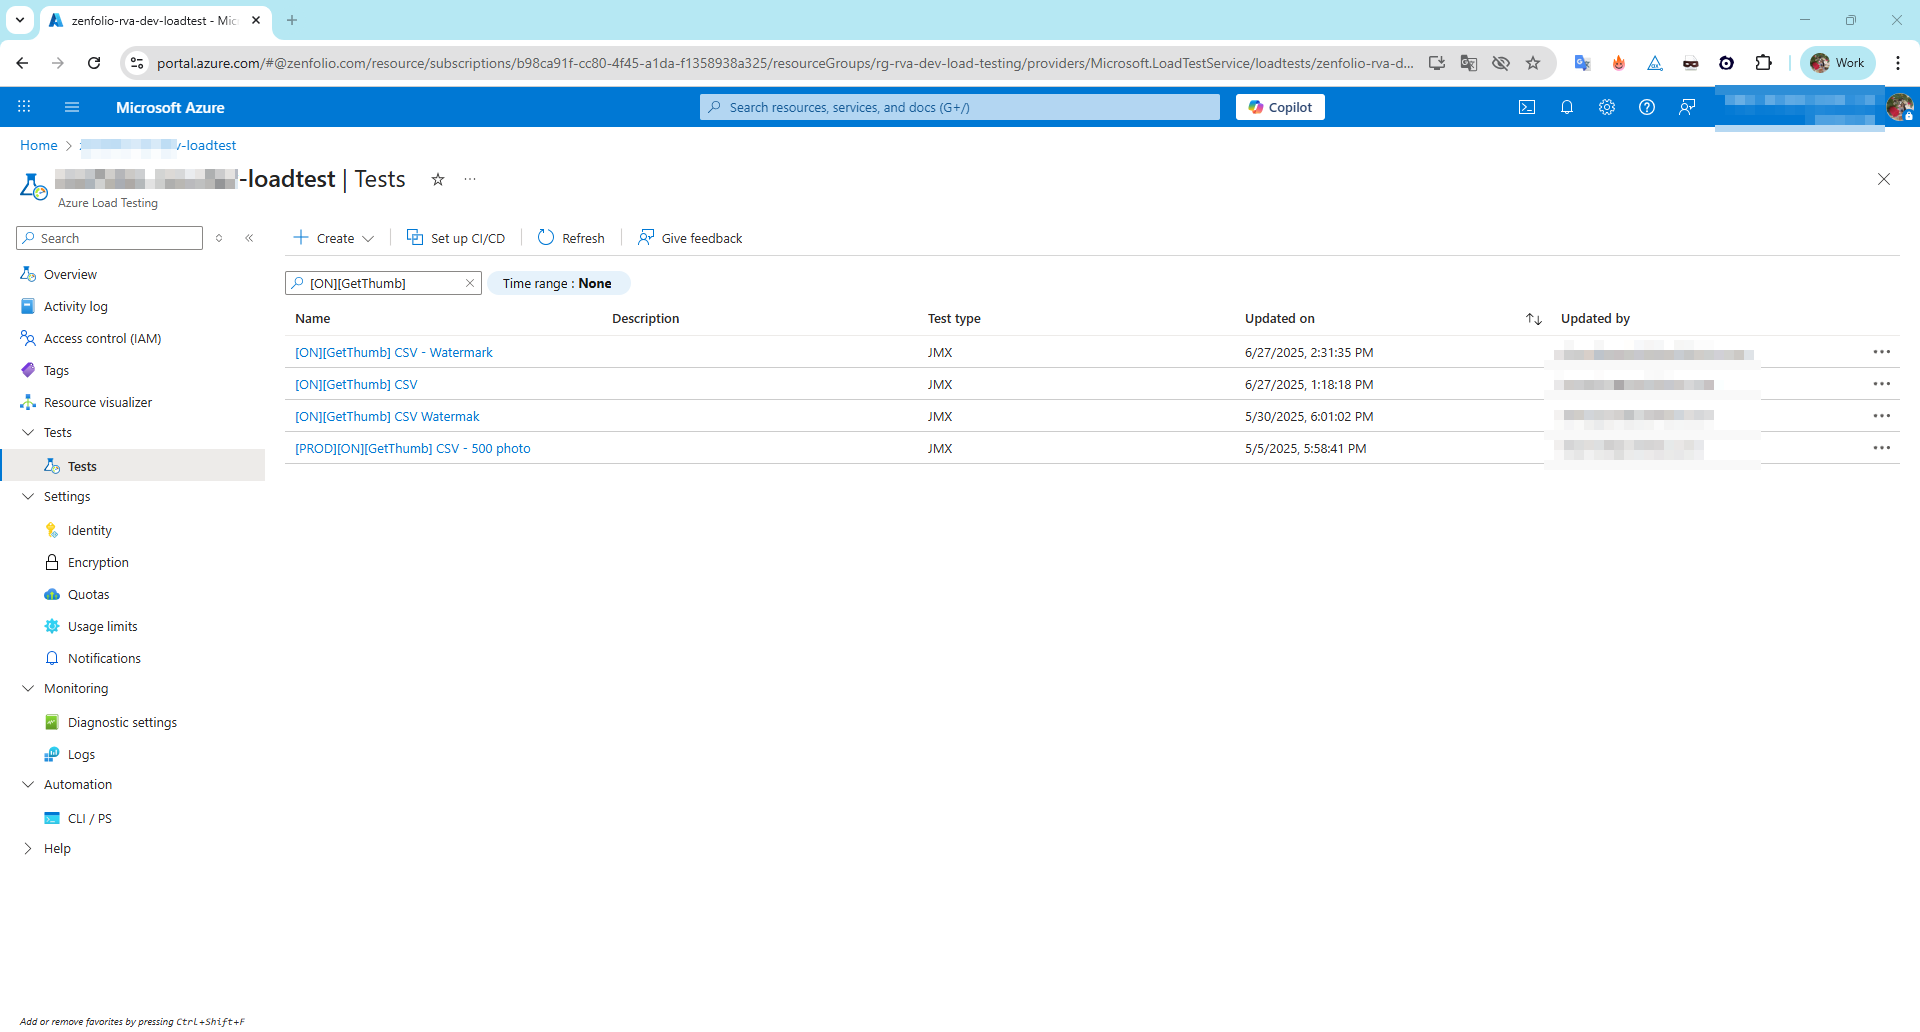
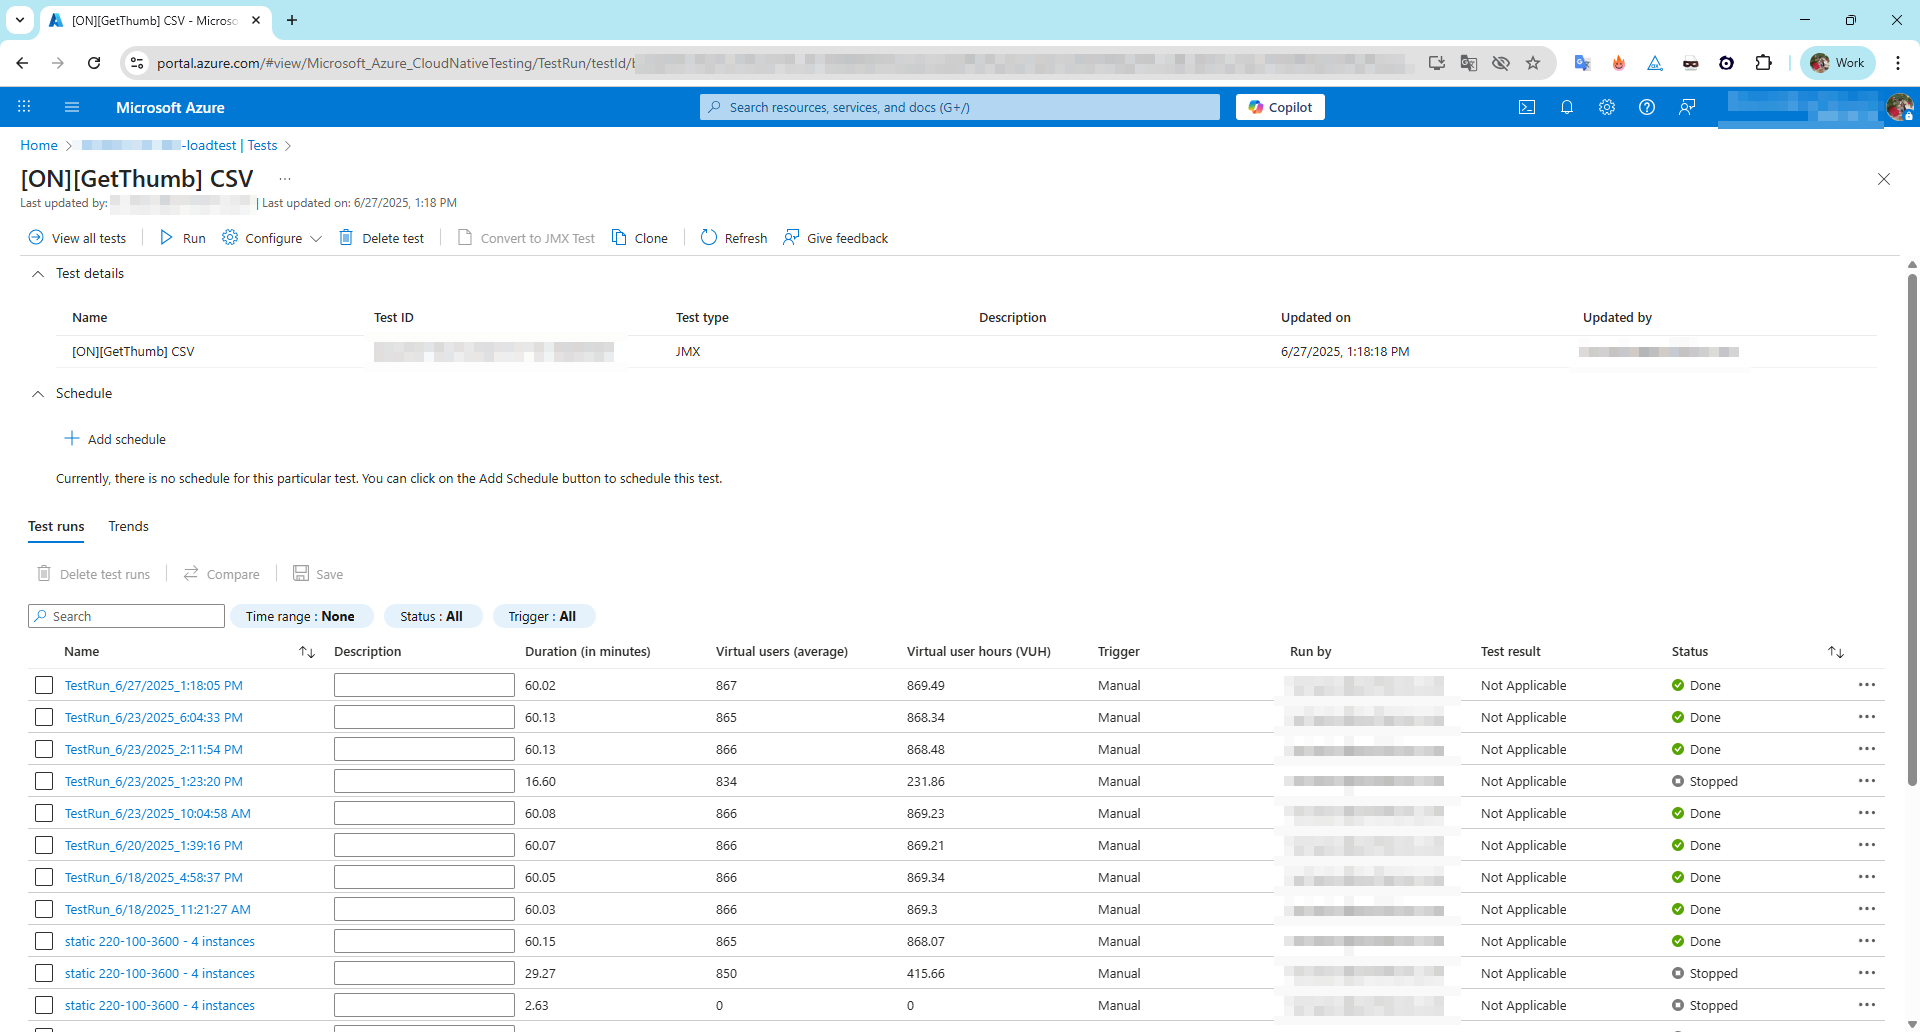
Click on any test record to view the number of runs and detailed information about each test execution.
5.1. Load test a website by using a JMeter script in Azure Load Testing
Go to your Load Testing resource in Azure. Click Create on the Overview page
or go to Tests → Create test.
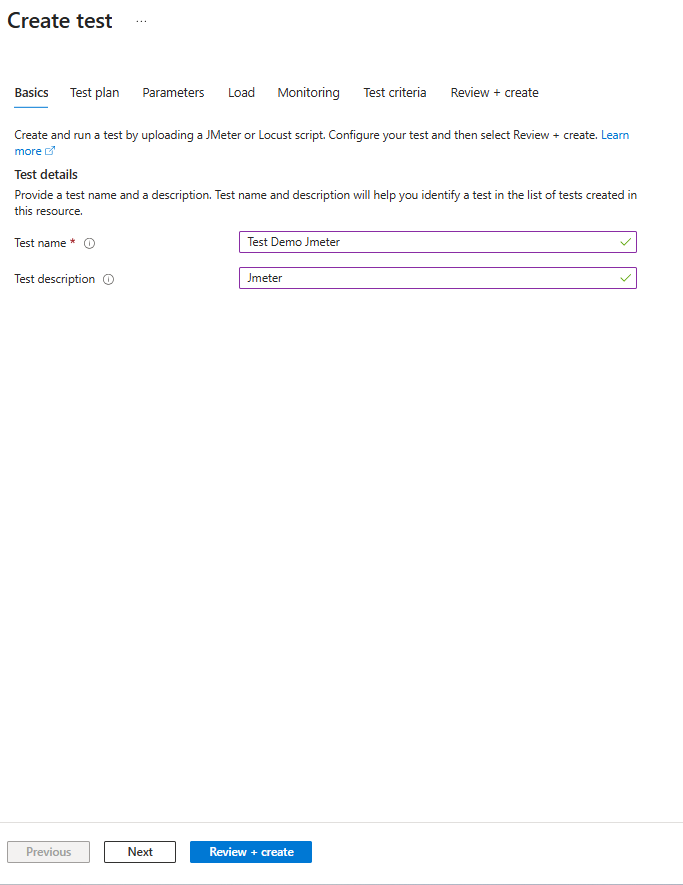
The page will go to the Basic tab where you can enter the test information.
After clicking Next, the page will proceed to the next tab, Test plan.
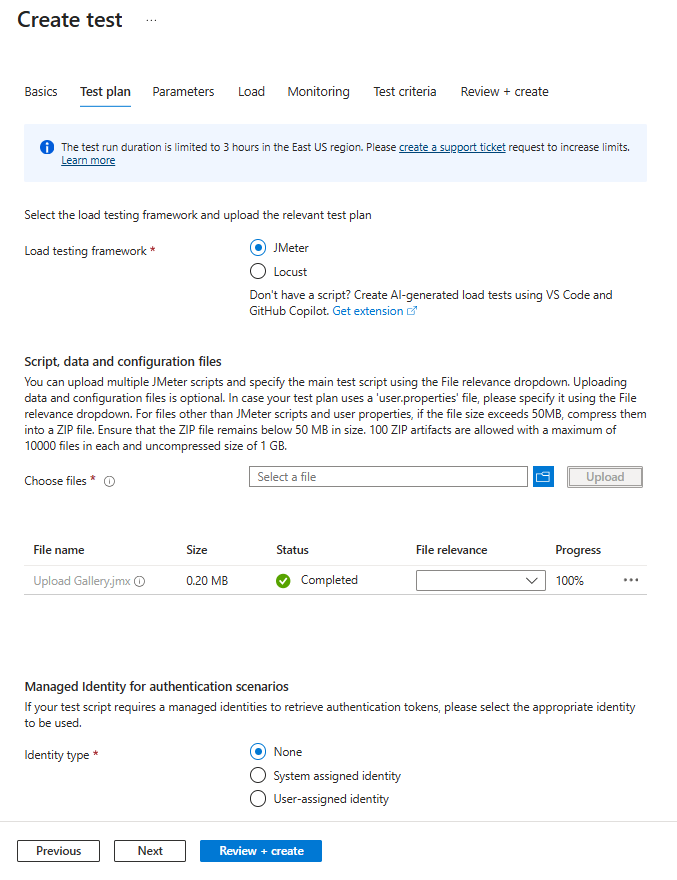
When the page navigates to the Test Plan tab, you can choose the type of script you want. Please select JMeter and upload the .jmx file that you have prepared, then click Next to continue.
You can use parameters to make your test plan configurable instead of hard-coding values in the test script. Specify key-value pairs in the load test configuration, and reference the value in the test script by using the parameter name. For more information, see Parameterize a load test with environment variables and secrets.
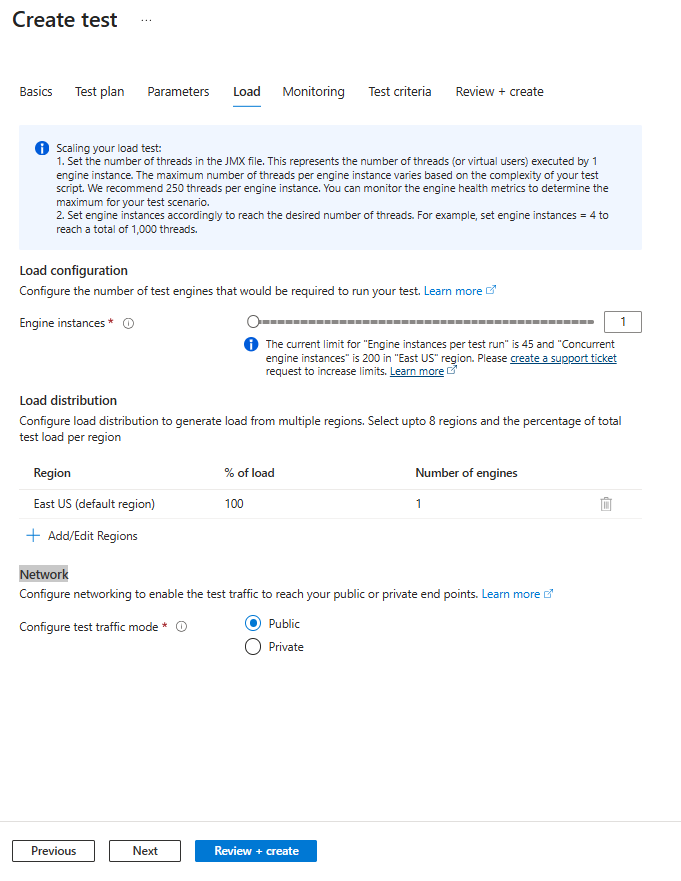
 When you click Next, the page will move to the Load tab. Here, you can configure:
Test engine instances – Azure Load Testing runs your script in parallel across all selected instances.
- JMeter: Total simulated users = (threads in script) × (engine instances).
- Locust: Specify total users in the load configuration, script, or Locust config file, then select the engine instances.
Load distribution – Define how the load is distributed across the selected instances.
Network – Configure connectivity options, such as connecting to a virtual network for private or on-premises endpoint testing.
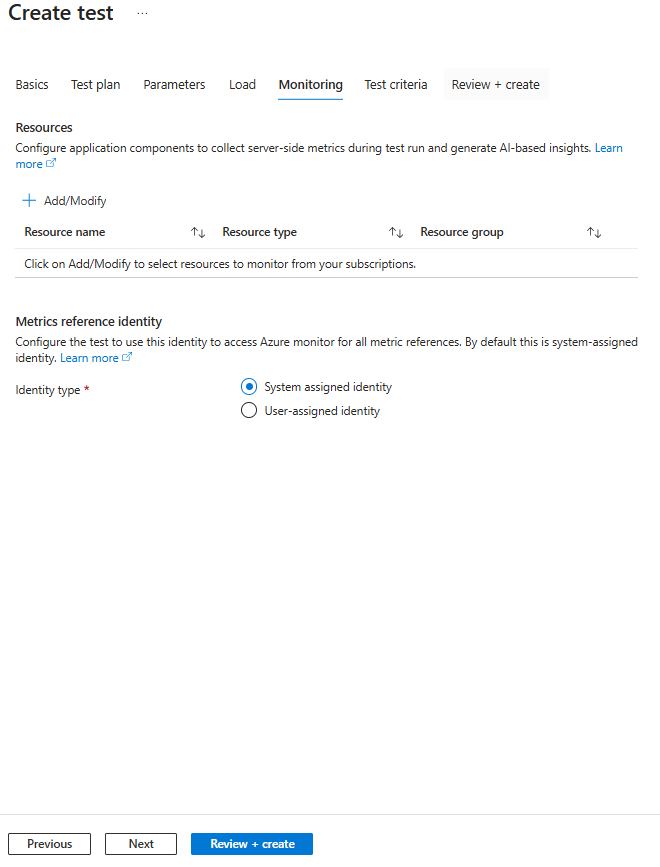
This page lets you configure application components for monitoring during the test run, enabling collection of server-side metrics and AI-based insights.
You can:
- Select resources to monitor (name, type, resource group) from your subscriptions.
- Set a metrics reference identity to access Azure Monitor, using either the default system-assigned identity or a user-assigned identity.
Test Criteria allows you to define conditions for test failure based on client metrics such as response time, requests per second, total requests, latency, or error percentage.
You can set these criteria for the entire test or specific requests, and also configure auto-stop to end the test automatically if the error rate exceeds a set threshold within a given time window.

Here are some quick tips for setting Test Criteria in Azure Load Testing:
- Base thresholds on real data – Run a few baseline tests first, then set realistic limits (e.g., if avg. response is 1.2s, set threshold at 2s).
- Focus on key metrics – Prioritize Response Time and Error Percentage for critical endpoints.
- Use Auto Stop for long runs – Stop tests early if error rate stays above a set threshold for a given time.
- Set request-specific limits – Stricter for login APIs, more relaxed for heavy reports.
- Review after changes – Adjust thresholds whenever the app or infrastructure changes.
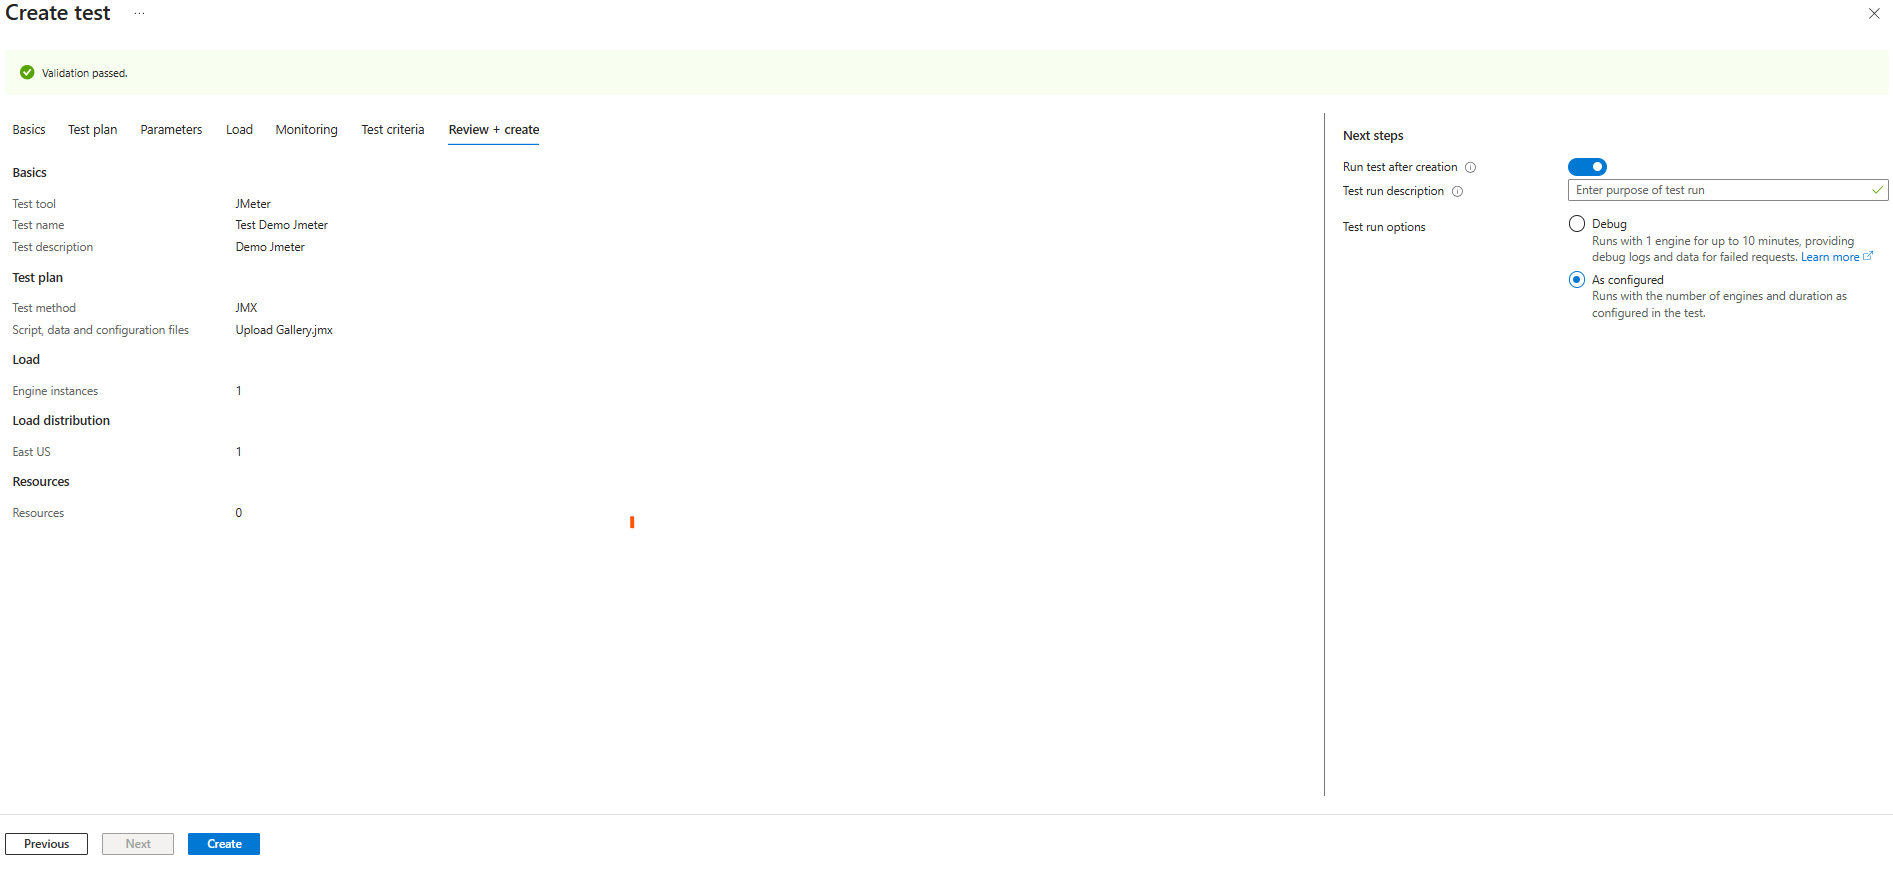
Please review your settings and click Create to finalize. Once you click Create, the system will automatically validate your configuration to ensure all information is correct before starting the test.
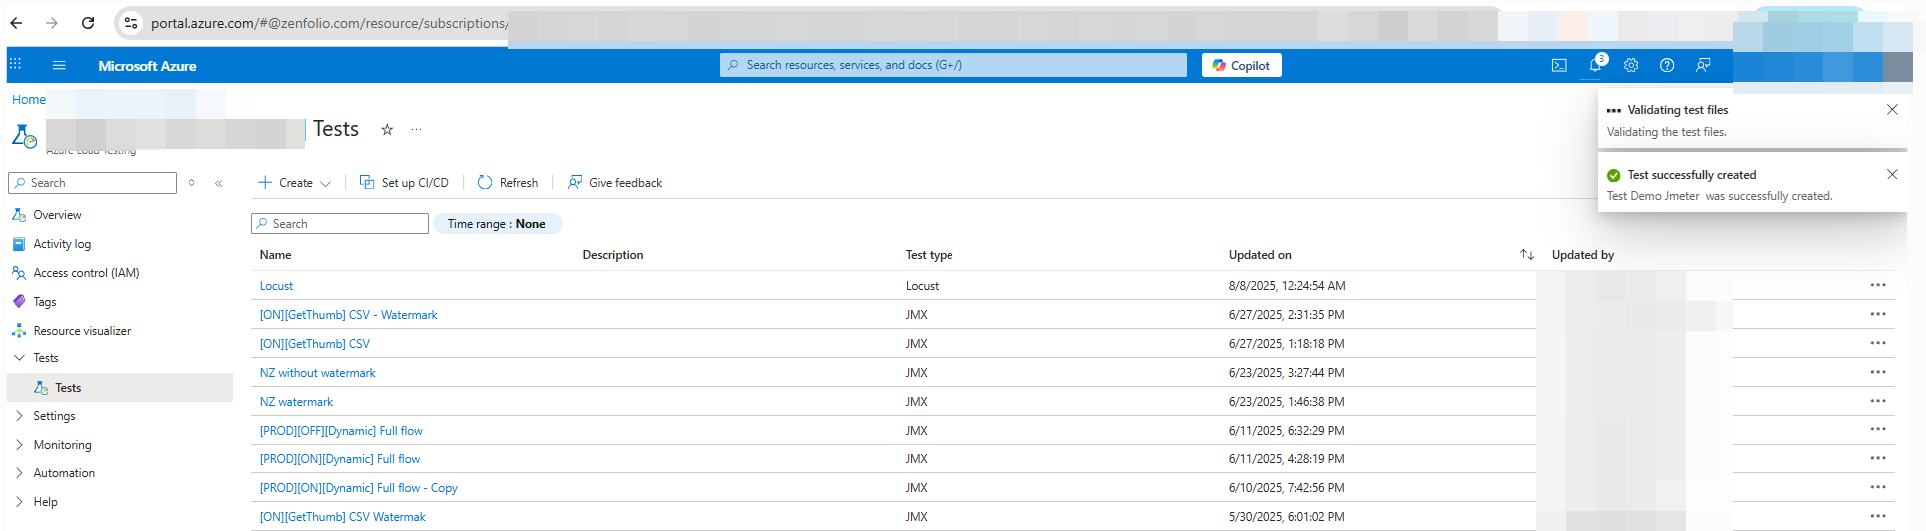
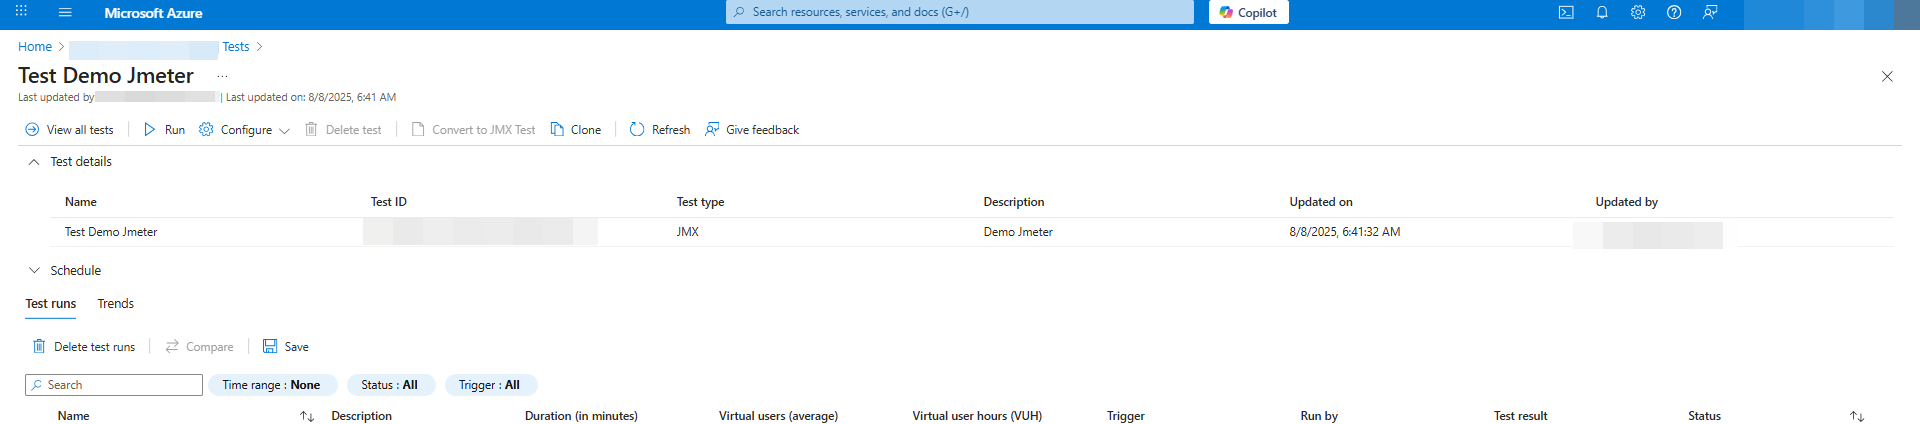
Check whether the newly created record has been successfully added. Each run will generate a record and store its details directly below the test.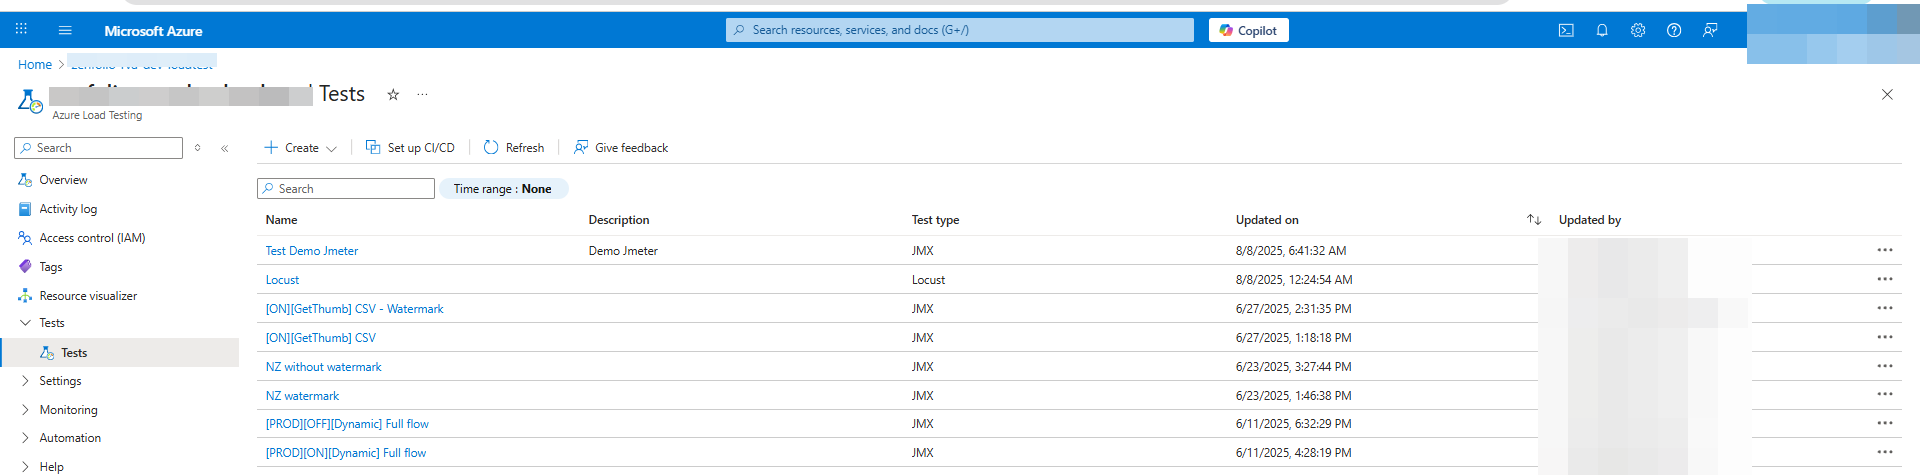
The Create Test process in Azure Load Testing allows you to define all configurations before running your load test. You’ll go through the following tabs:
- Basics – Choose the test tool (e.g., JMeter or Locust), give your test a name and description.
- Test Plan – Select the test method, upload your script (
.jmxfor JMeter or.pyfor Locust), and add any data/config files. - Parameters – Configure environment variables, secrets, or certificates to make your script flexible.
- Load – Set the number of engine instances, load distribution, and network options.
- Monitoring – Add Azure resources to track server-side metrics.
- Test Criteria – Define pass/fail thresholds and optional auto-stop rules.
- Review + Create – Verify all configurations before creating the test.
Next Steps:
- Choose Run test after creation to start immediately.
- Optionally provide a Test Run Description.
- Select Debug mode (1 engine, up to 10 min) for troubleshooting or As Configured for the full test run.
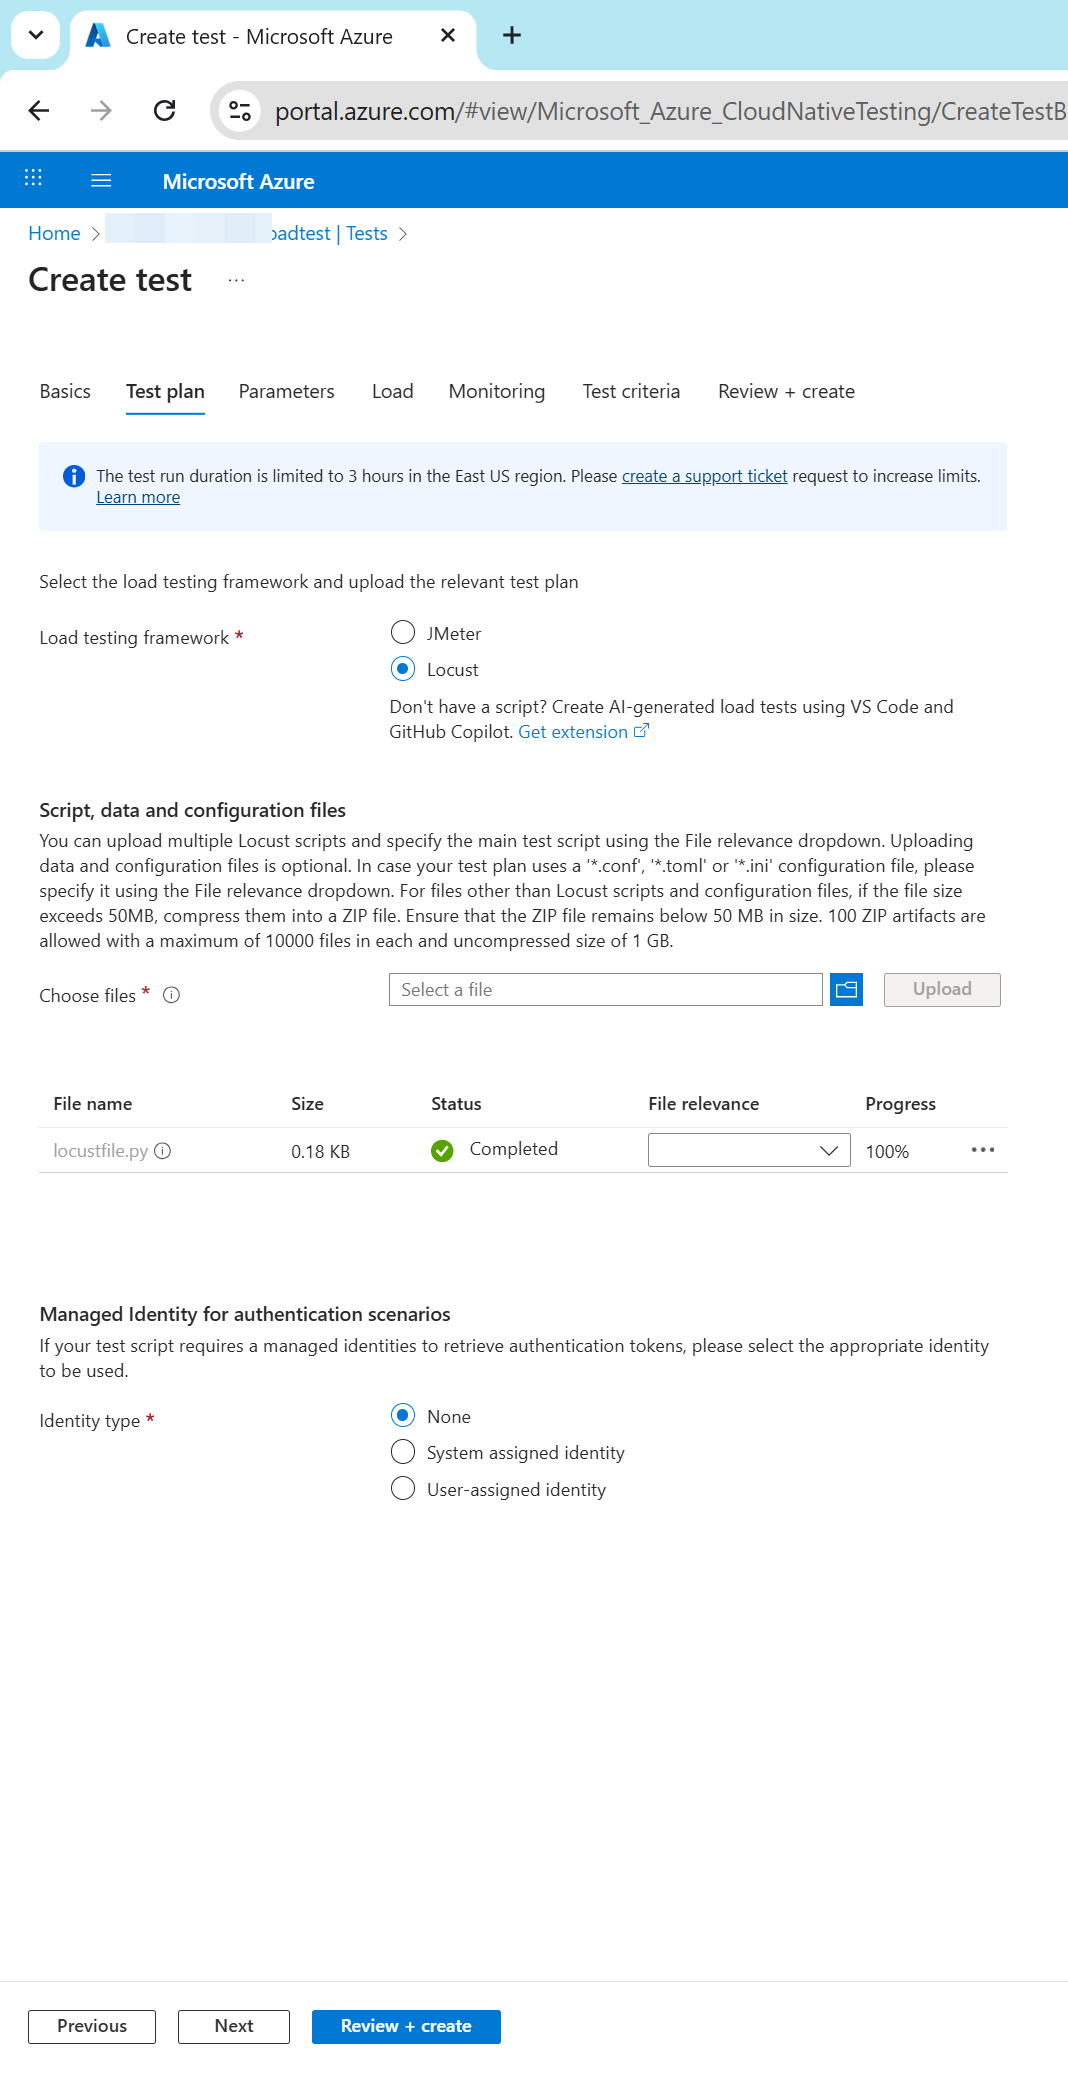
5.2. Create and run a load test by using a Locust script and Azure Load Testing
Here’s how you can trigger a load test with Locust in Azure Load Testing — following a process similar to that used with JMeter.
You need to prepare a ready-to-use performance test file using Locust. After that, select the Locust test type and upload your test file as shown below.
Load Settings
Before running your Locust-based load test on Azure Load Testing, it’s important to configure your test setup by uploading all required files and defining the appropriate load parameters.
| Field | Description |
|---|---|
| Total number of users | (Optional) Total users simulated across all test engines |
| Overall spawn rate | (Optional) Rate of user injection (users/sec) |
| Duration (minutes) | (Optional) Total duration of the test |
| Host endpoint | (Optional) Target HTTP URL (e.g., https://example.com/api) |
| Test engine instances | Number of parallel engine instances to run |

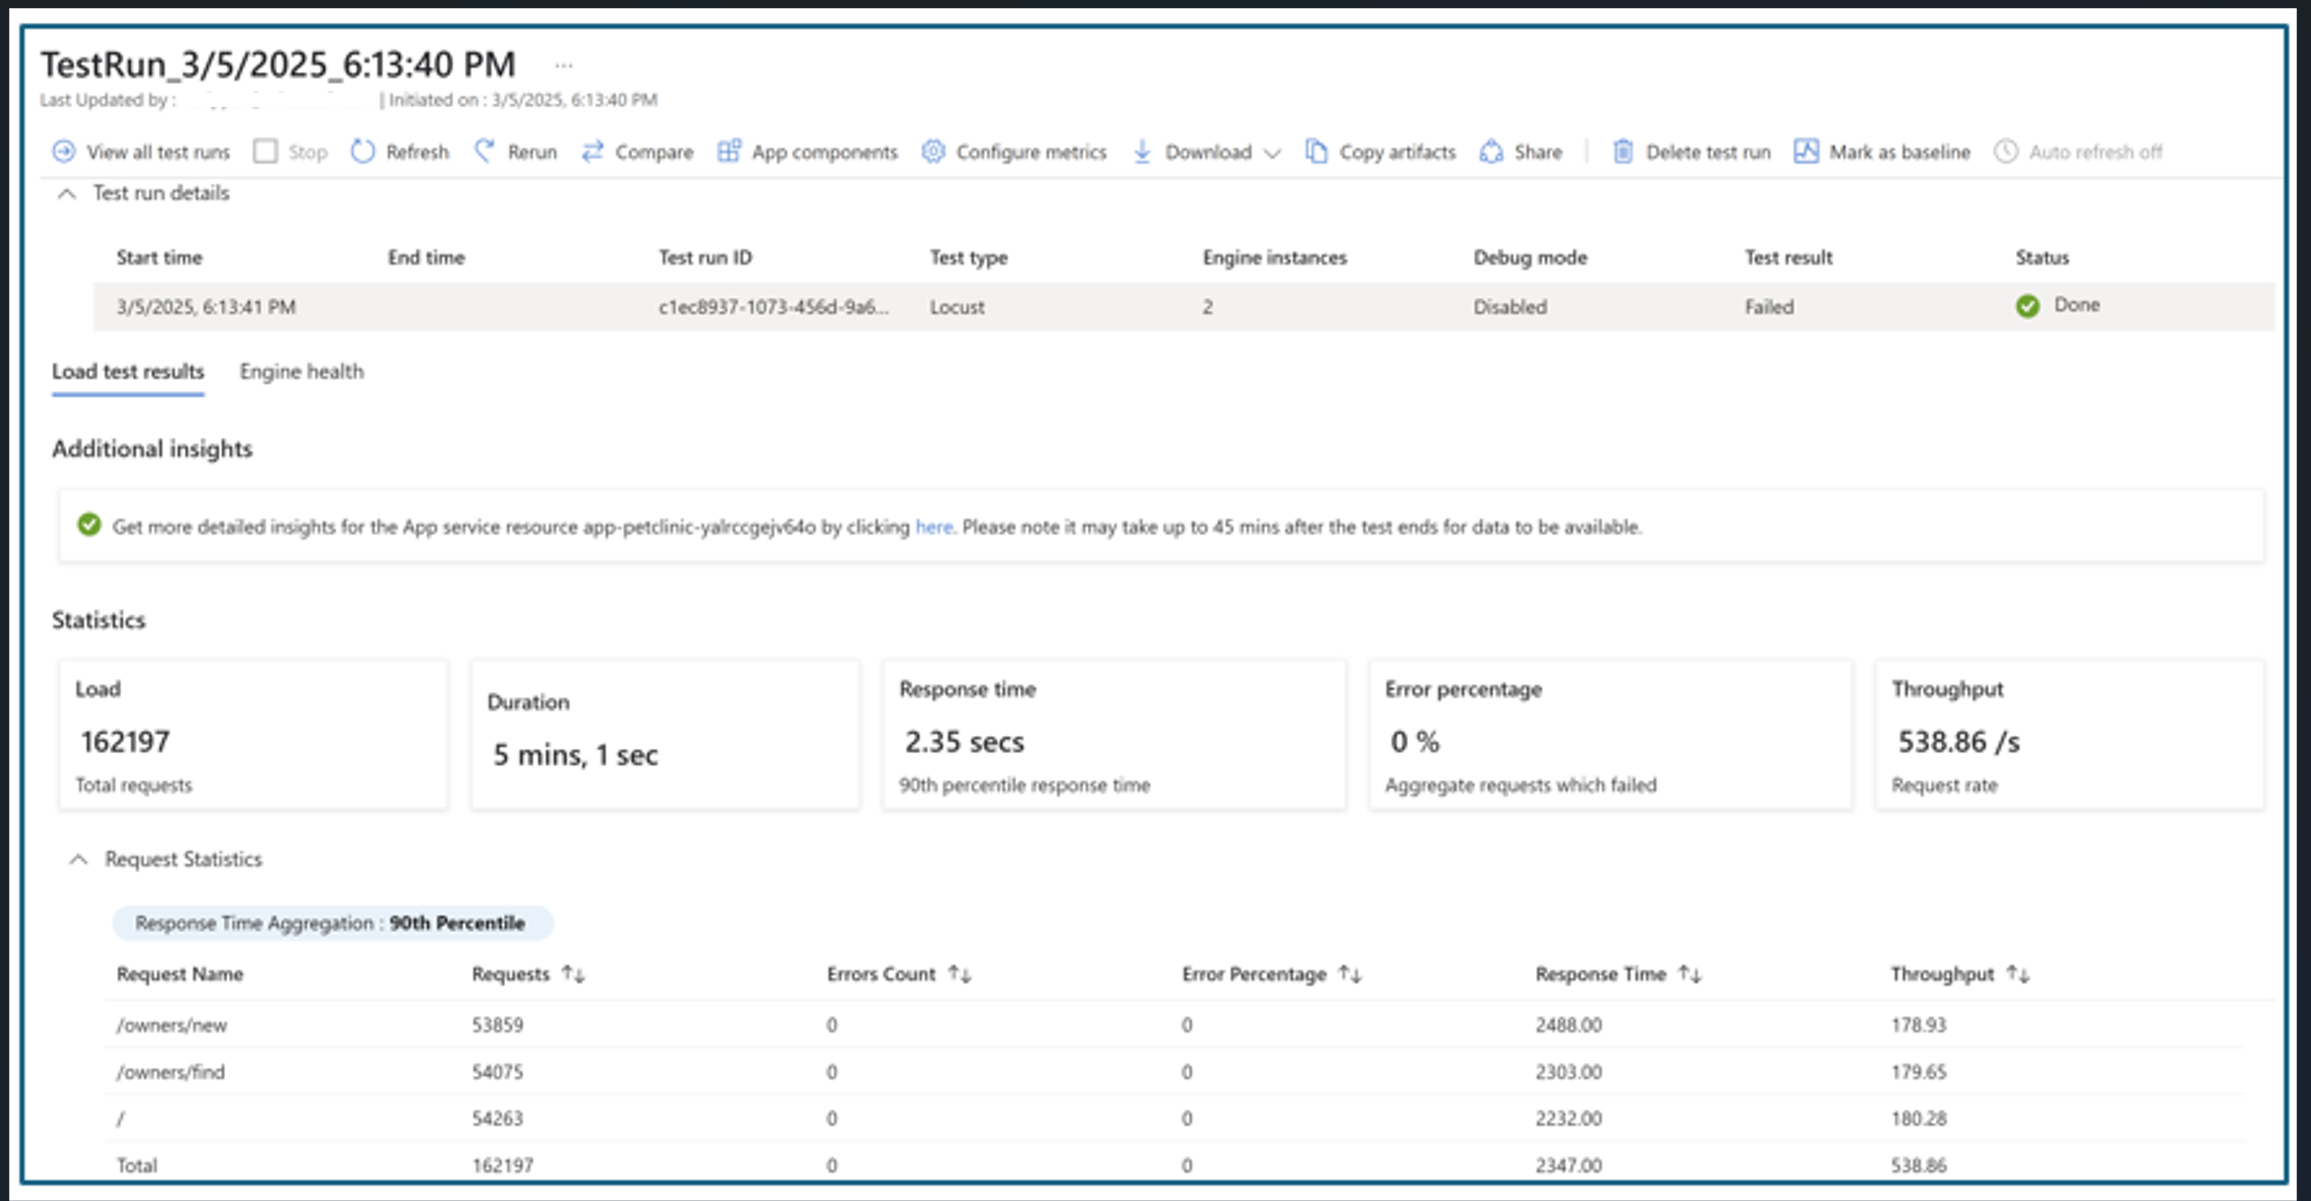
The result will be as shown below.
Additional Ways to Run Load Tests in Azure Load Testing
In addition to uploading JMeter or Locust scripts, Azure Load Testing provides several flexible ways to execute load tests depending on your use case:
- URL-based Quick Tests
You can create a quick test directly in the Azure portal by specifying the target endpoint. This is useful for simple scenarios that don’t require custom scripts. Azure automatically generates a basic test plan.
Create and run a quick test - YAML-based Configuration for CI/CD Integration
Define your test configuration using a YAML file, including references to scripts, test parameters, engine sizes, and more. This is suitable for automation scenarios using Azure CLI, REST API, or Azure DevOps.
Test configuration YAML reference - Debug Mode for Troubleshooting
Run your test in debug mode with a single engine for a maximum of 10 minutes. This helps you verify that your test script behaves as expected and allows you to review logs or failed request traces before running full-scale tests.
Run tests in debug mode - Parameterization with Environment Variables and Secrets
You can parameterize your test plan by using environment variables or securely storing sensitive values like access tokens in Azure Key Vault. This makes your tests more dynamic and reusable across different environments.
How to parameterize load tests
Advanced Scenarios
Additionally, for advanced scenarios such as database load testing or automating load tests with CI/CD pipelines, you can explore the following resources:
- Load testing databases with Azure Load Testing
- Quickstart: Automate an existing load test with CI/CD
- Quickstart: Create and run a load test with Visual Studio Code and GitHub Copilot
- Manually configure your CI/CD workflow for running load tests
6. Analyzing Test Results
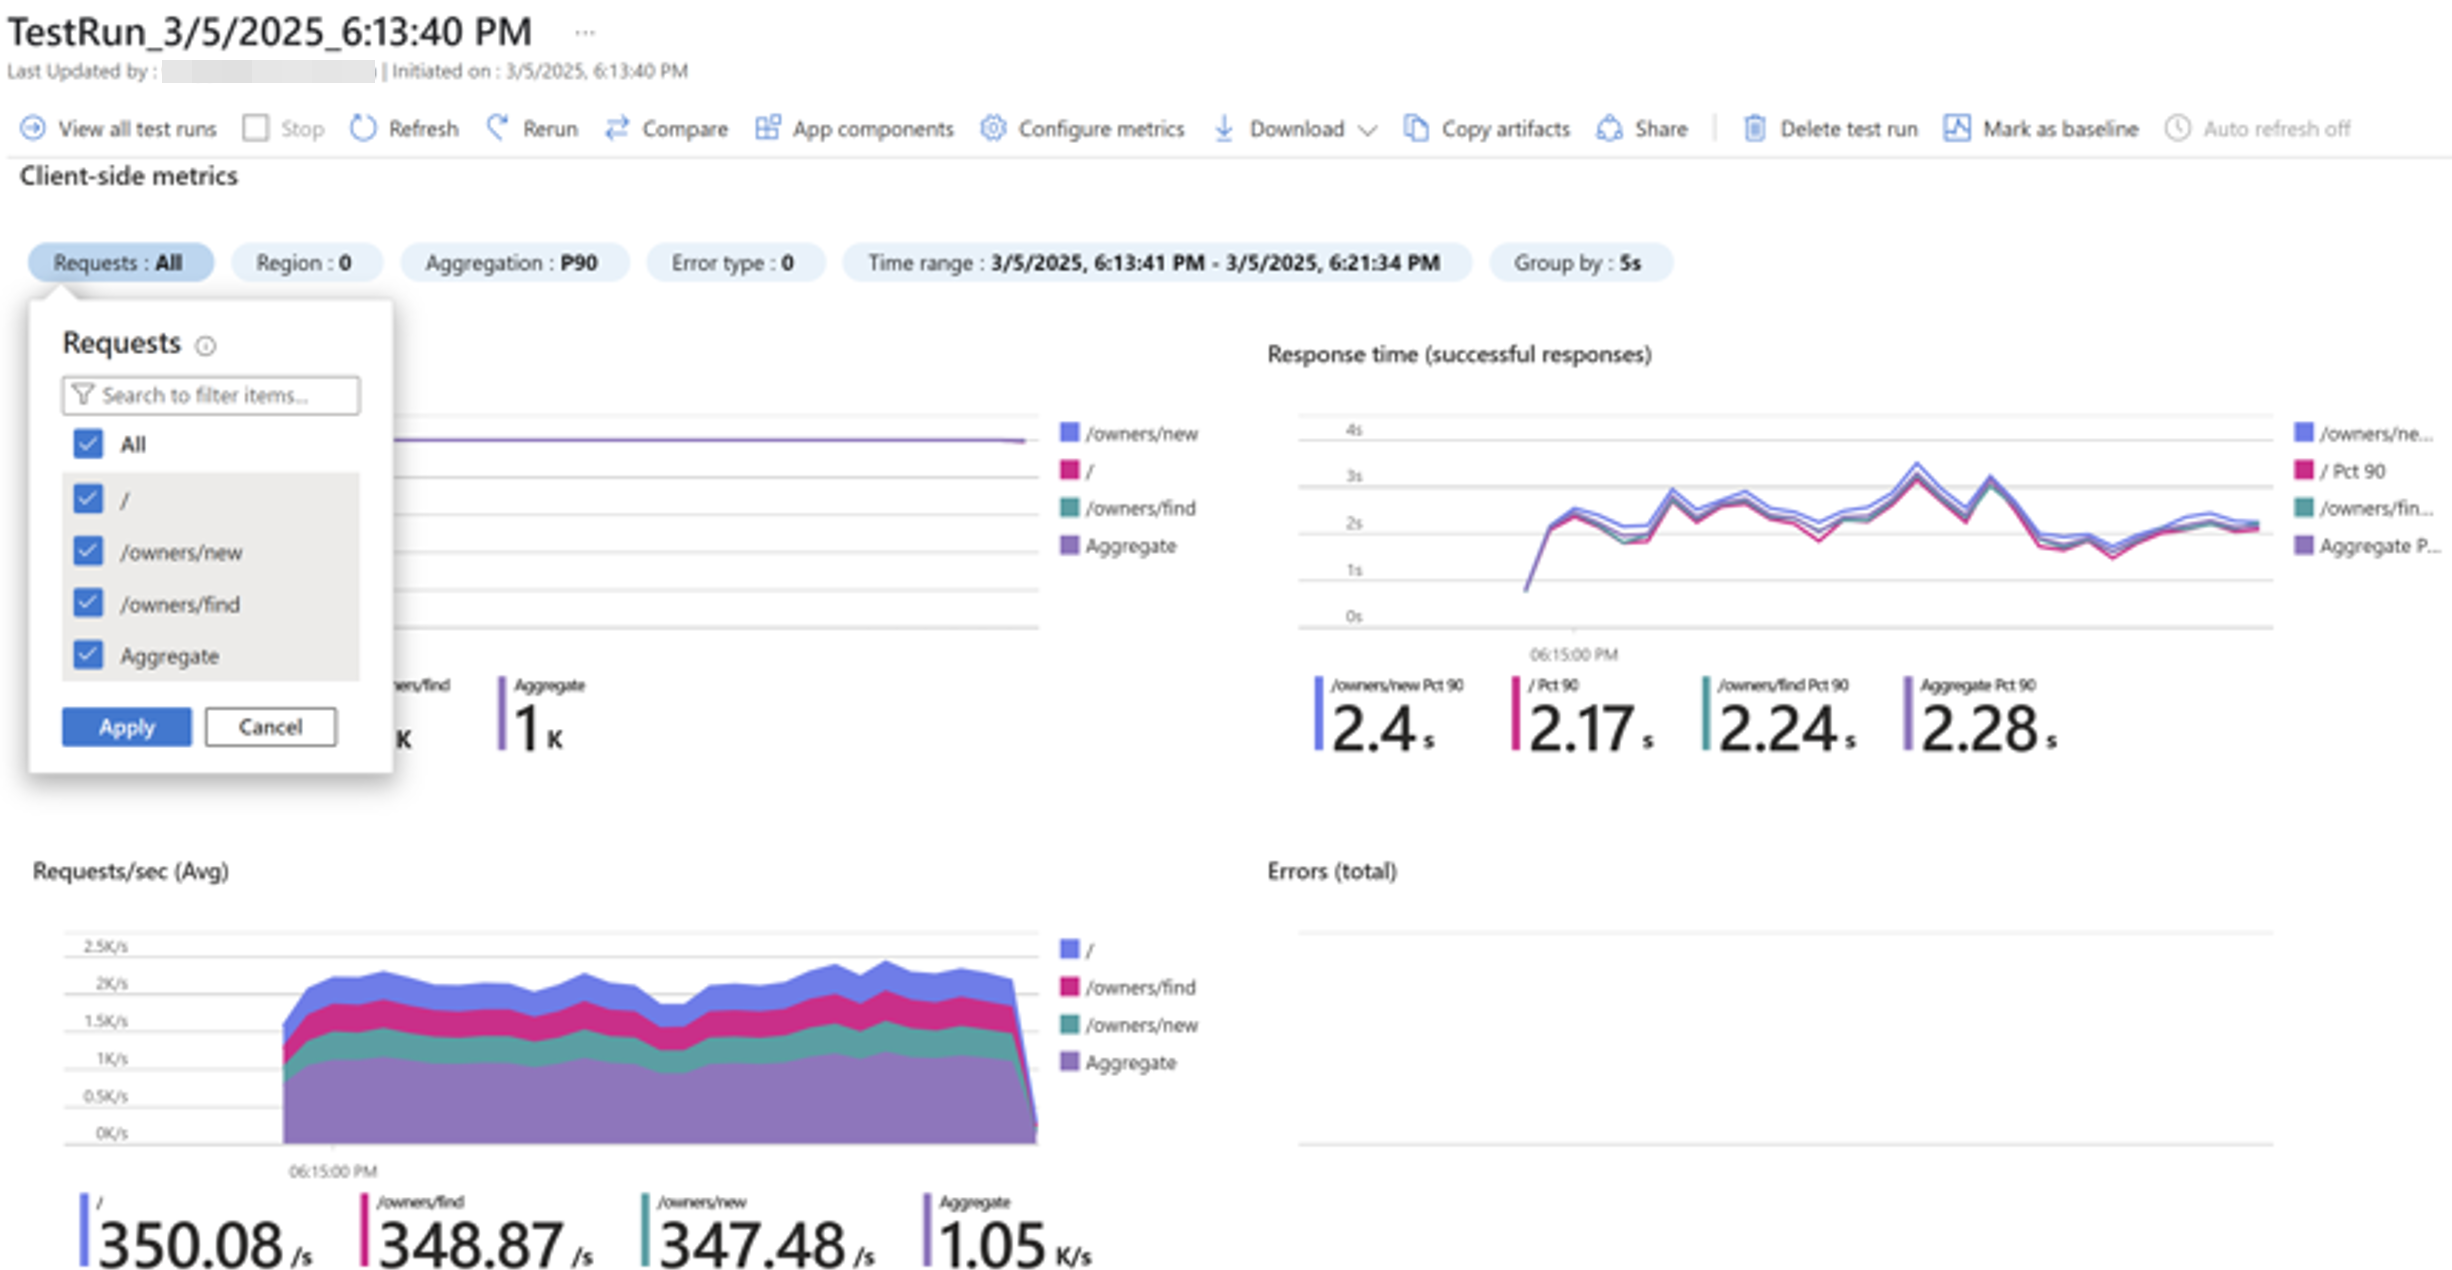
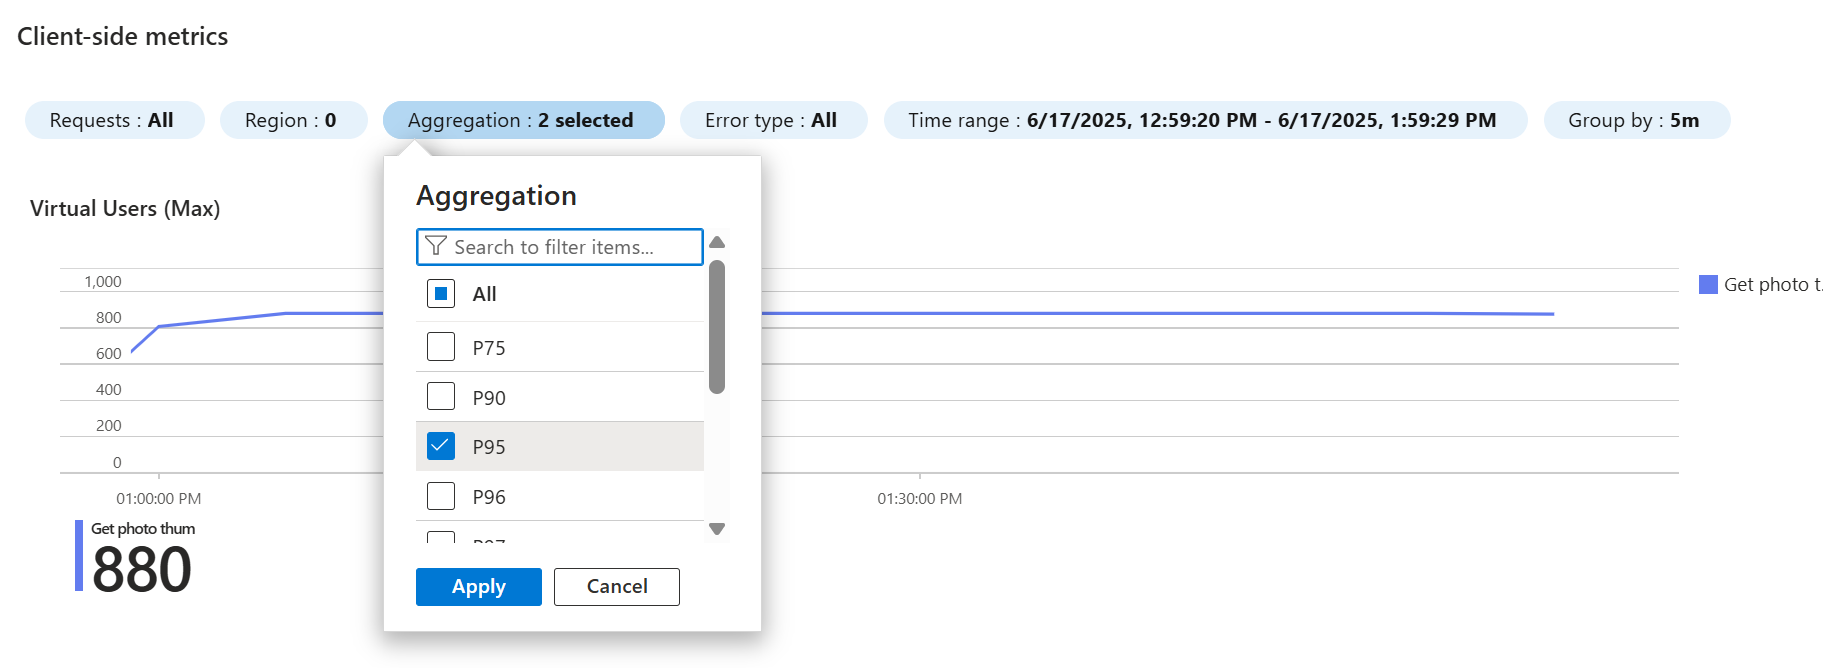
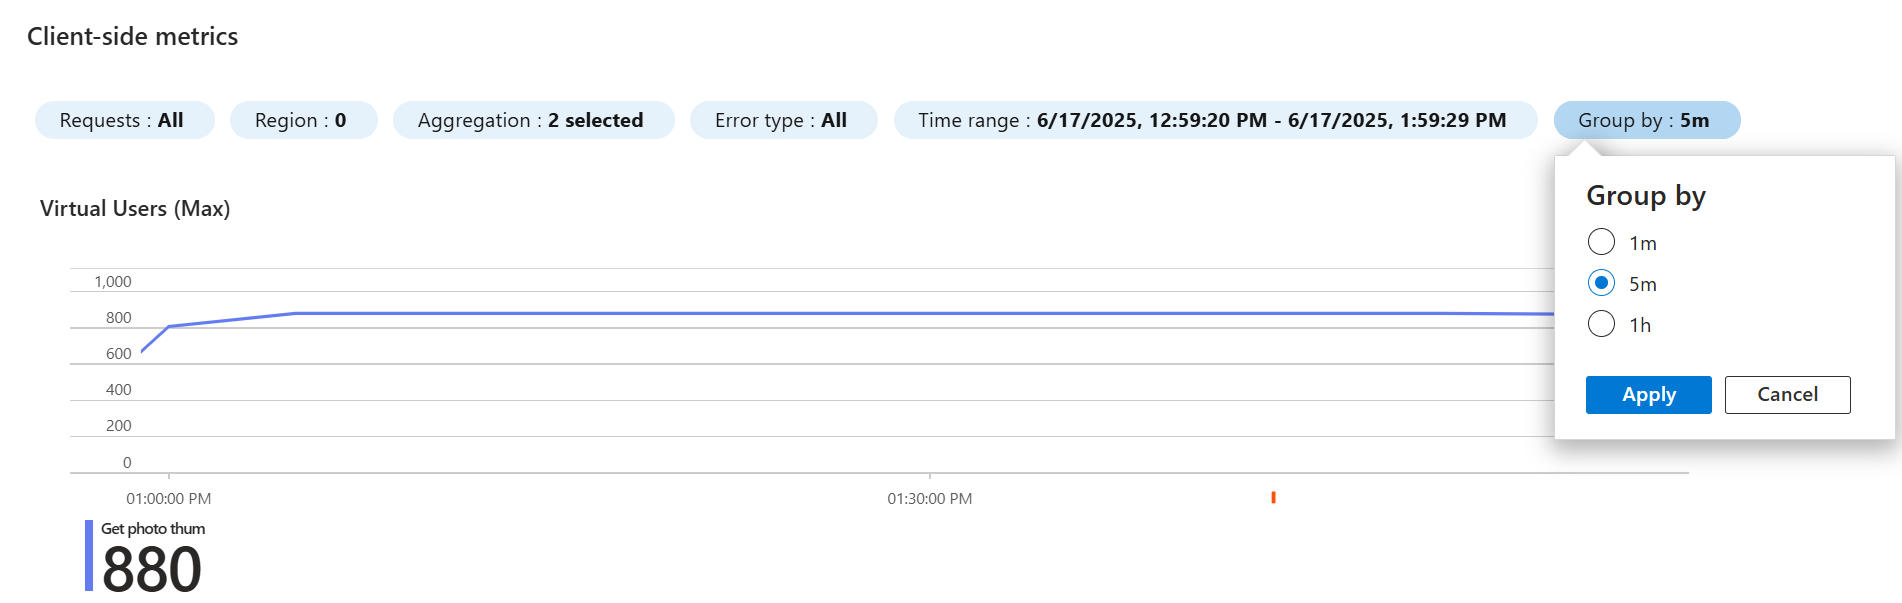
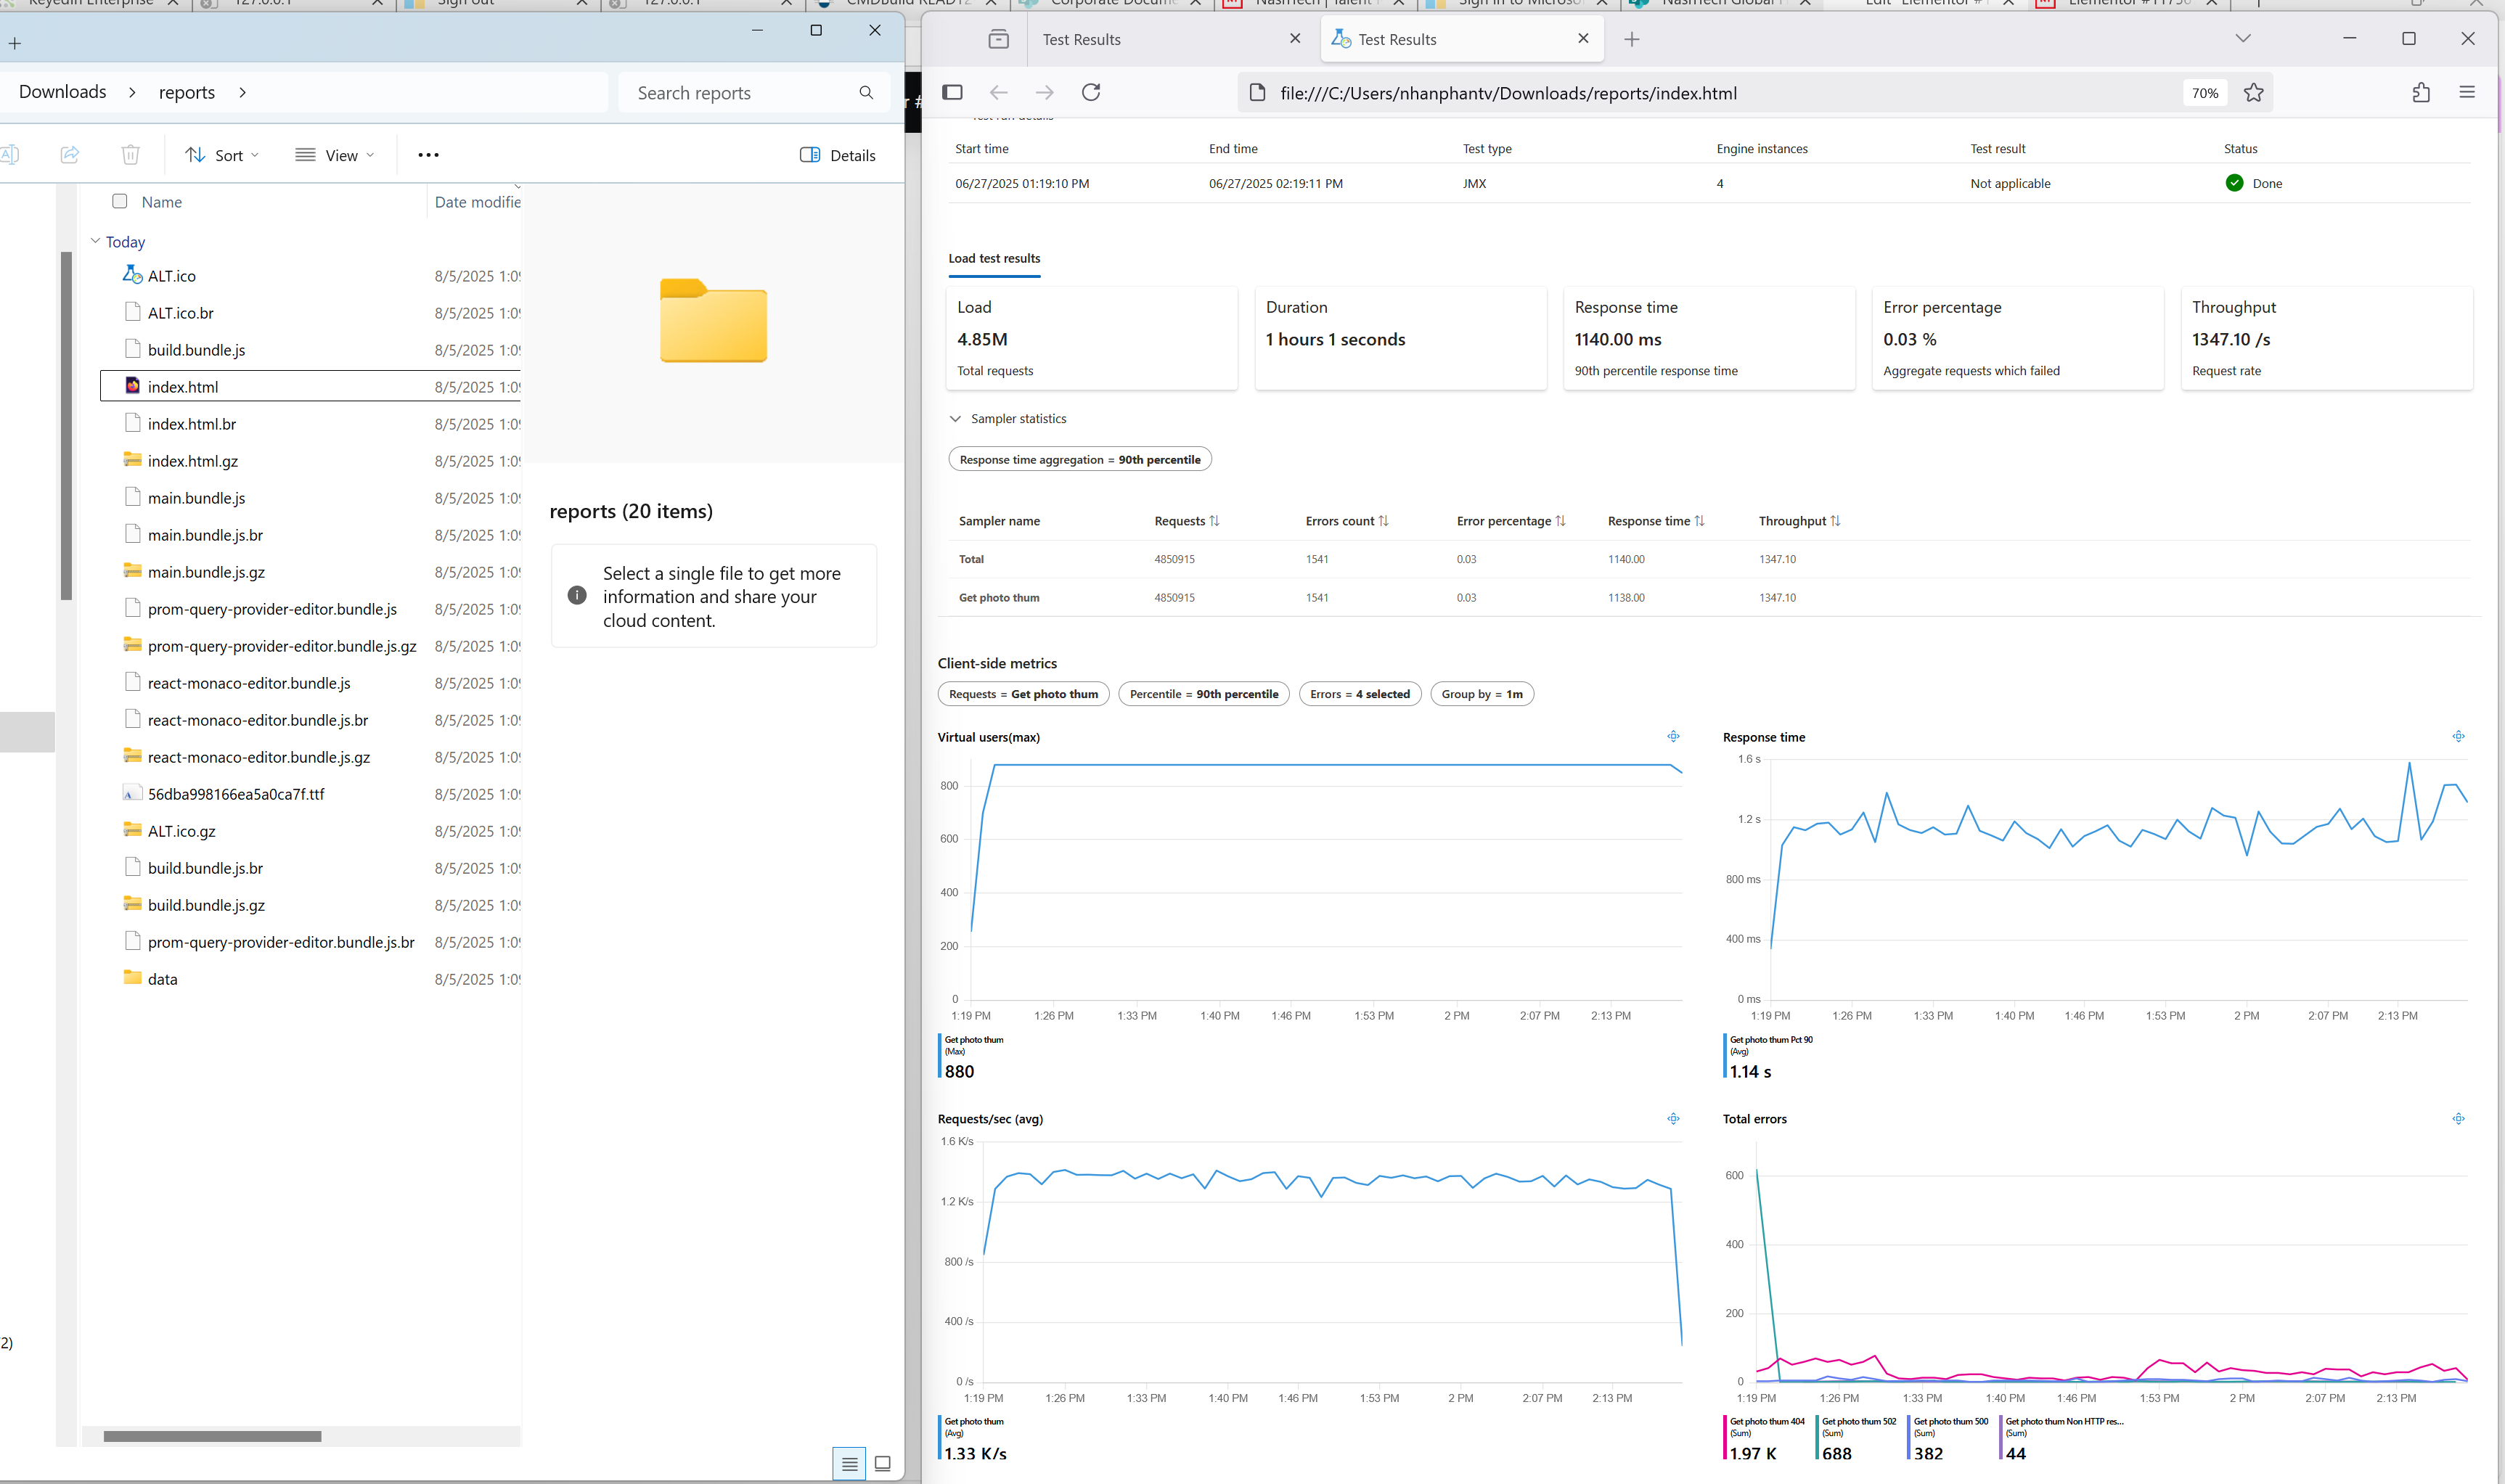
6.1 Viewing Result DashboardsClient-side Metrics:
These are collected from the load generator (JMeter or Locust):
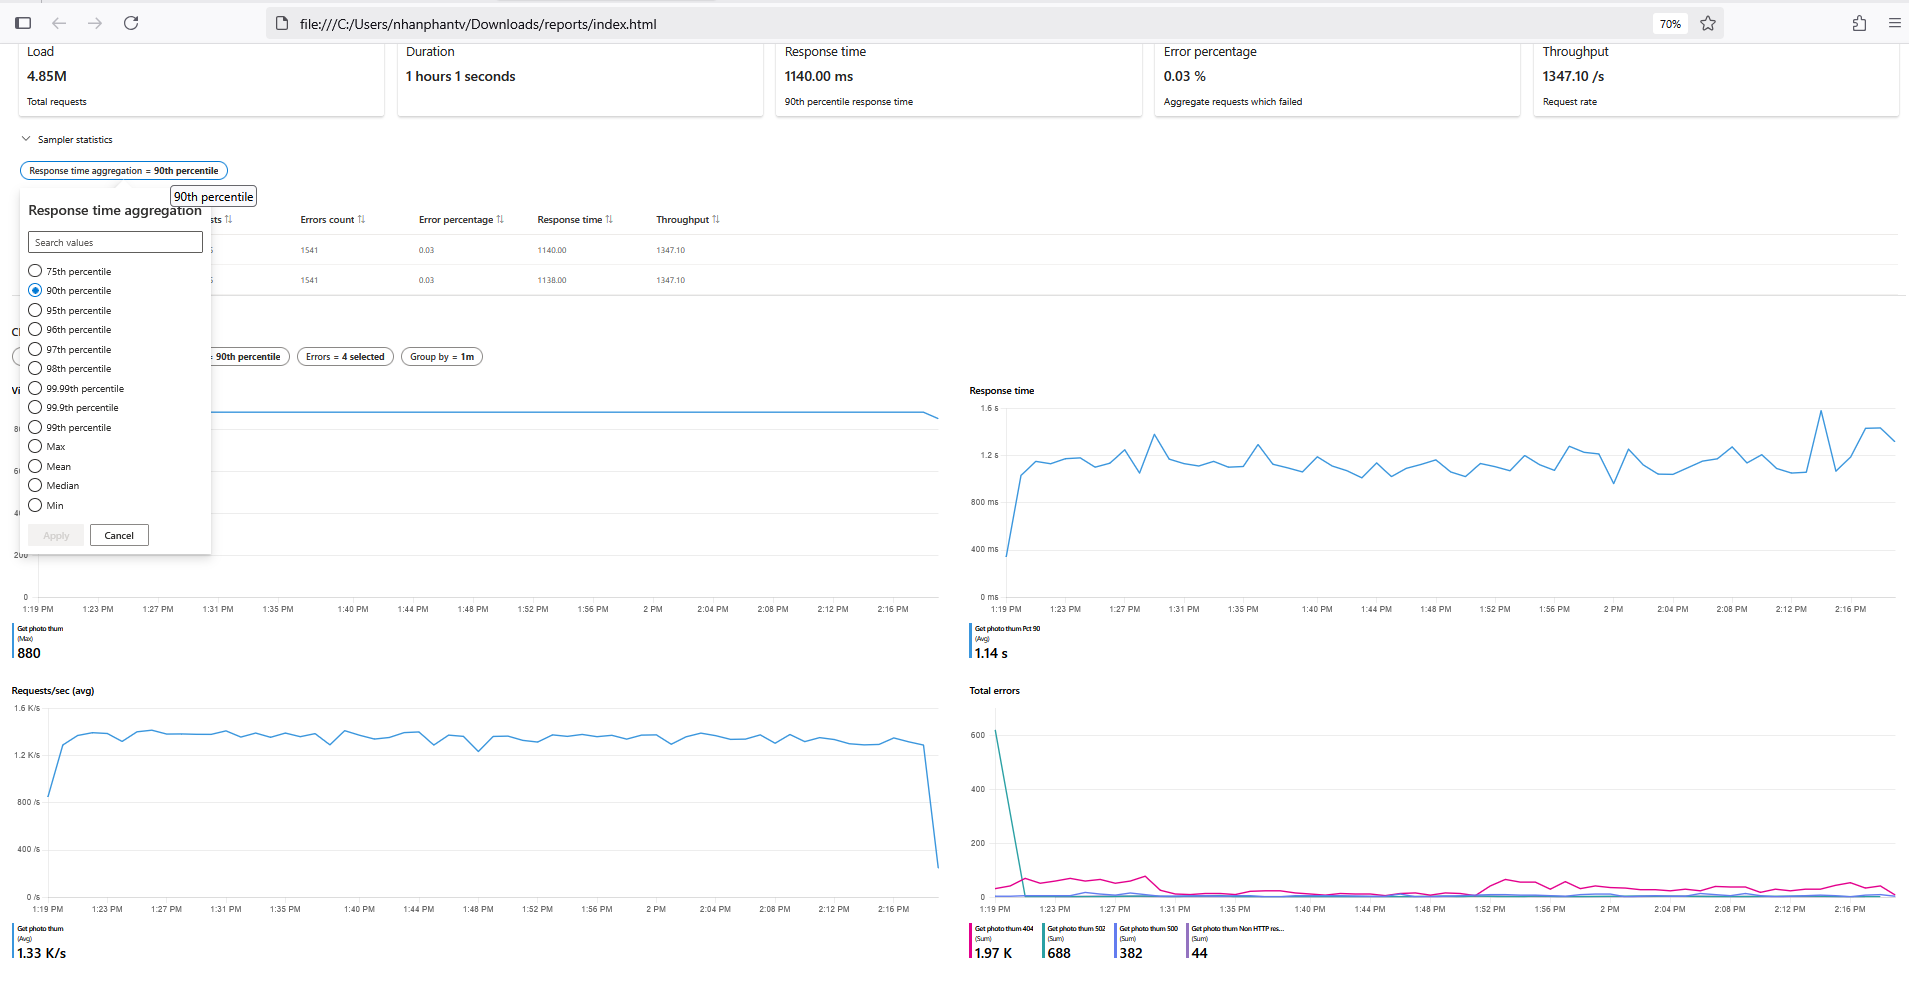
- Response Time: Average, P50, P90, P95 (percentile breakdown).
- Request Rate: Requests per second (RPS).
- Error Rate: Number and percentage of failed requests.
- Throughput: Data transfer rate (bytes/sec).

6.2 Comparing Multiple Test Runs
- To compare load test runs in Azure Load Testing, you can select up to ten test runs from the same test in the Azure portal. The dashboard will then overlay the client-side and server-side metrics, allowing for a visual comparison of performance trends.
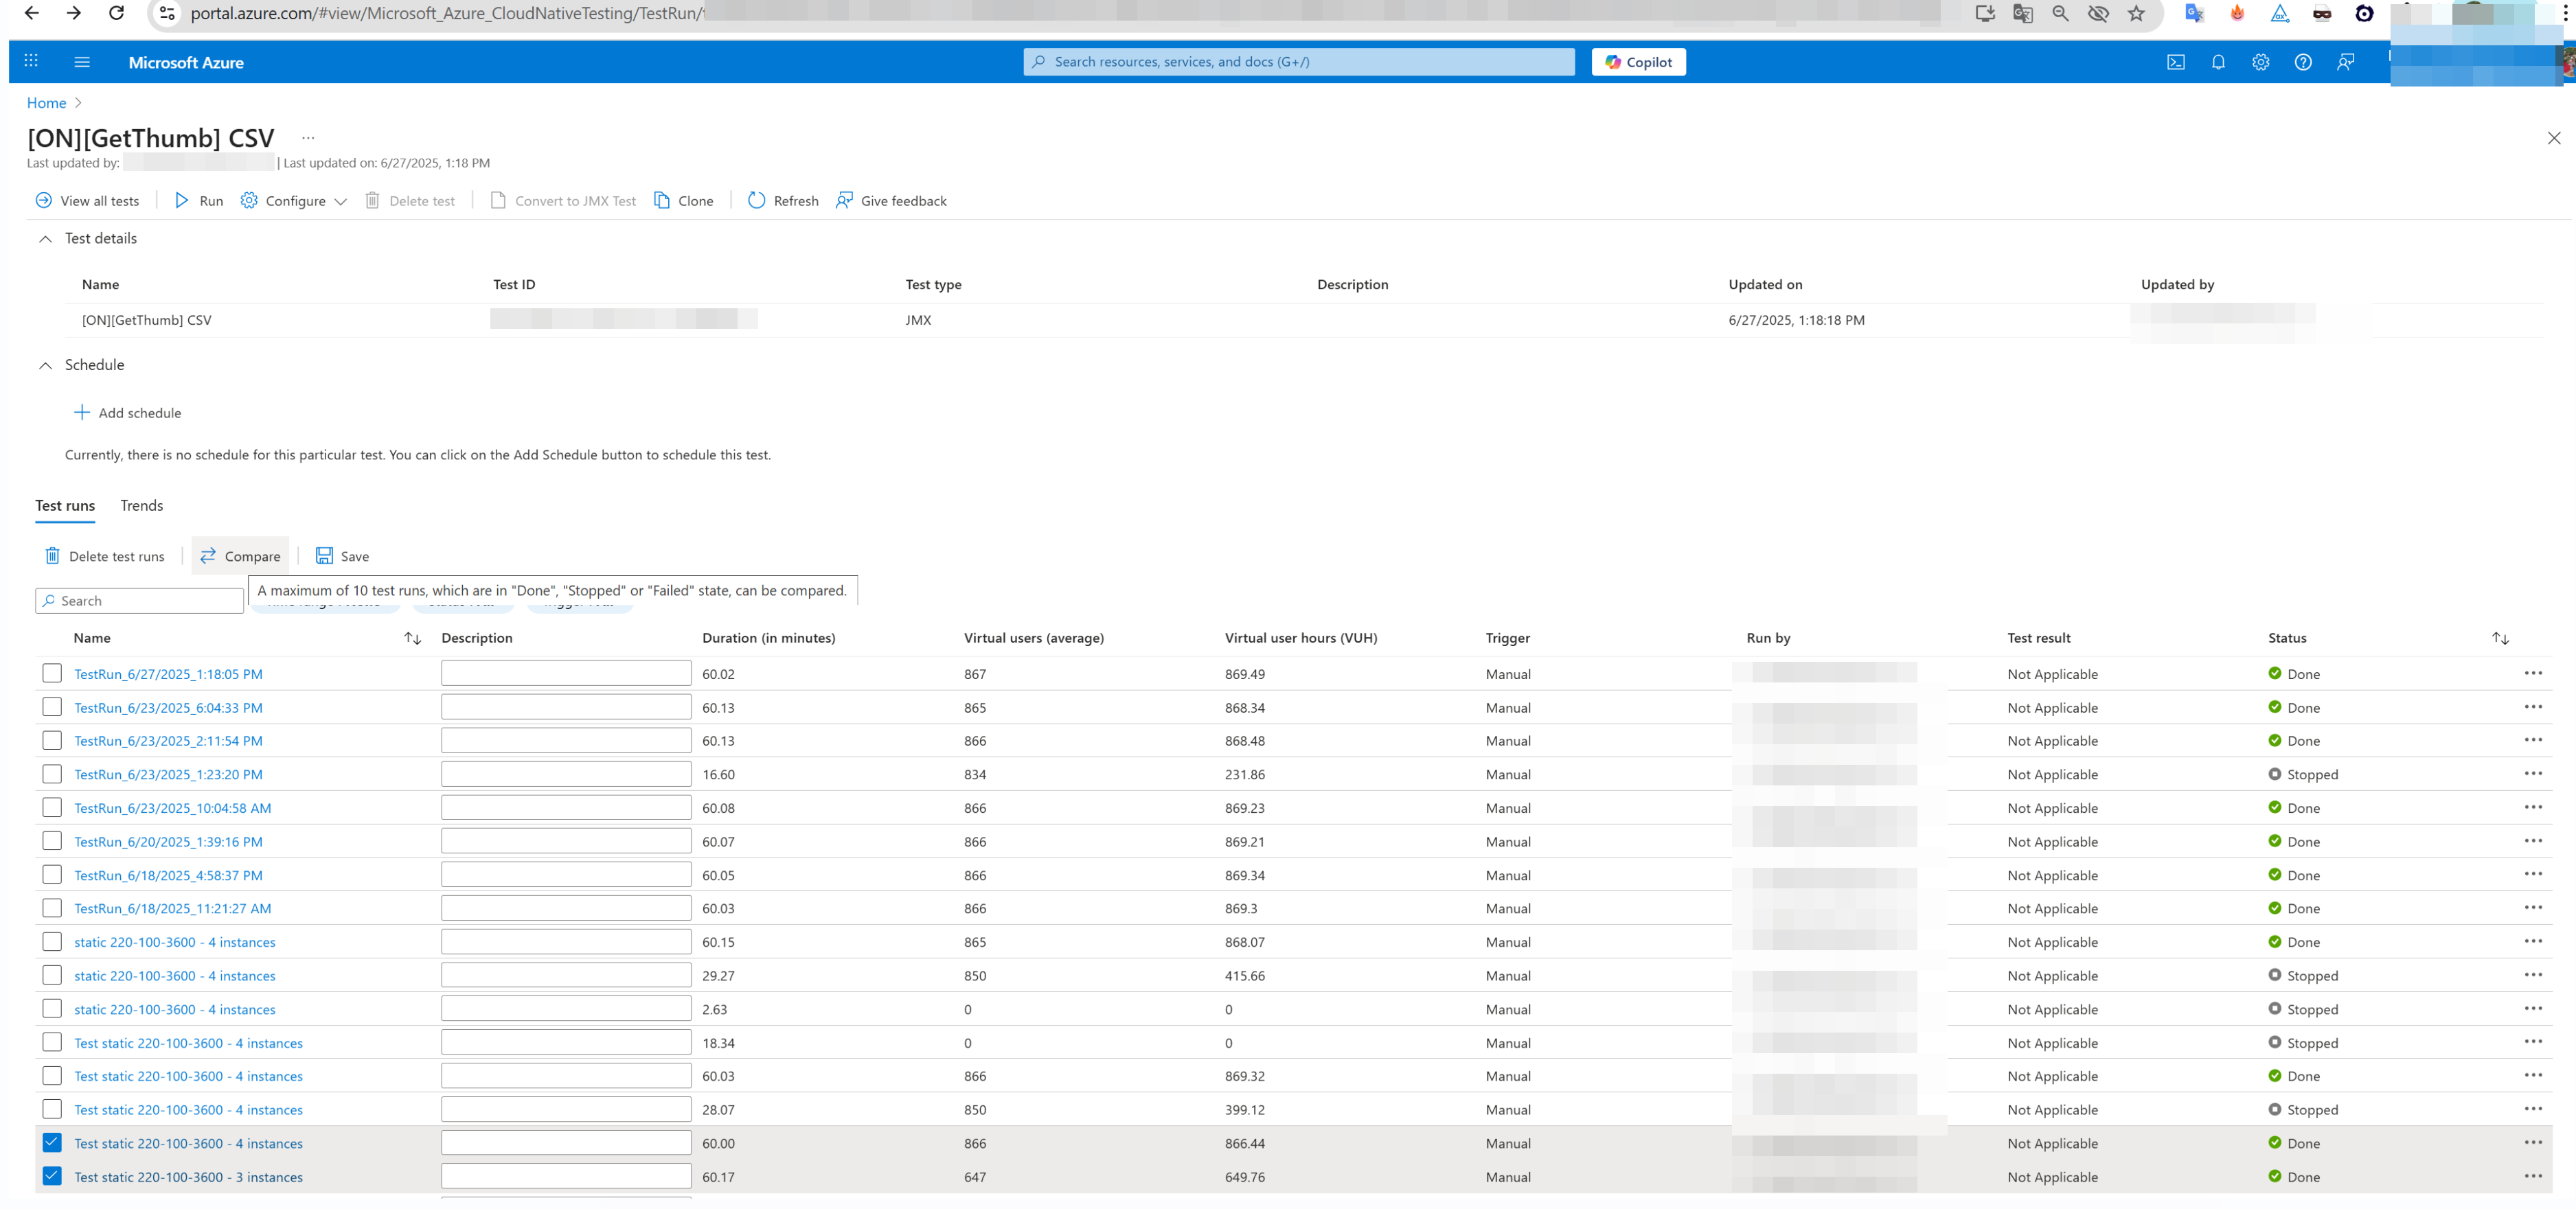 The comparison dashboard provides a visual overview of your selected test runs.
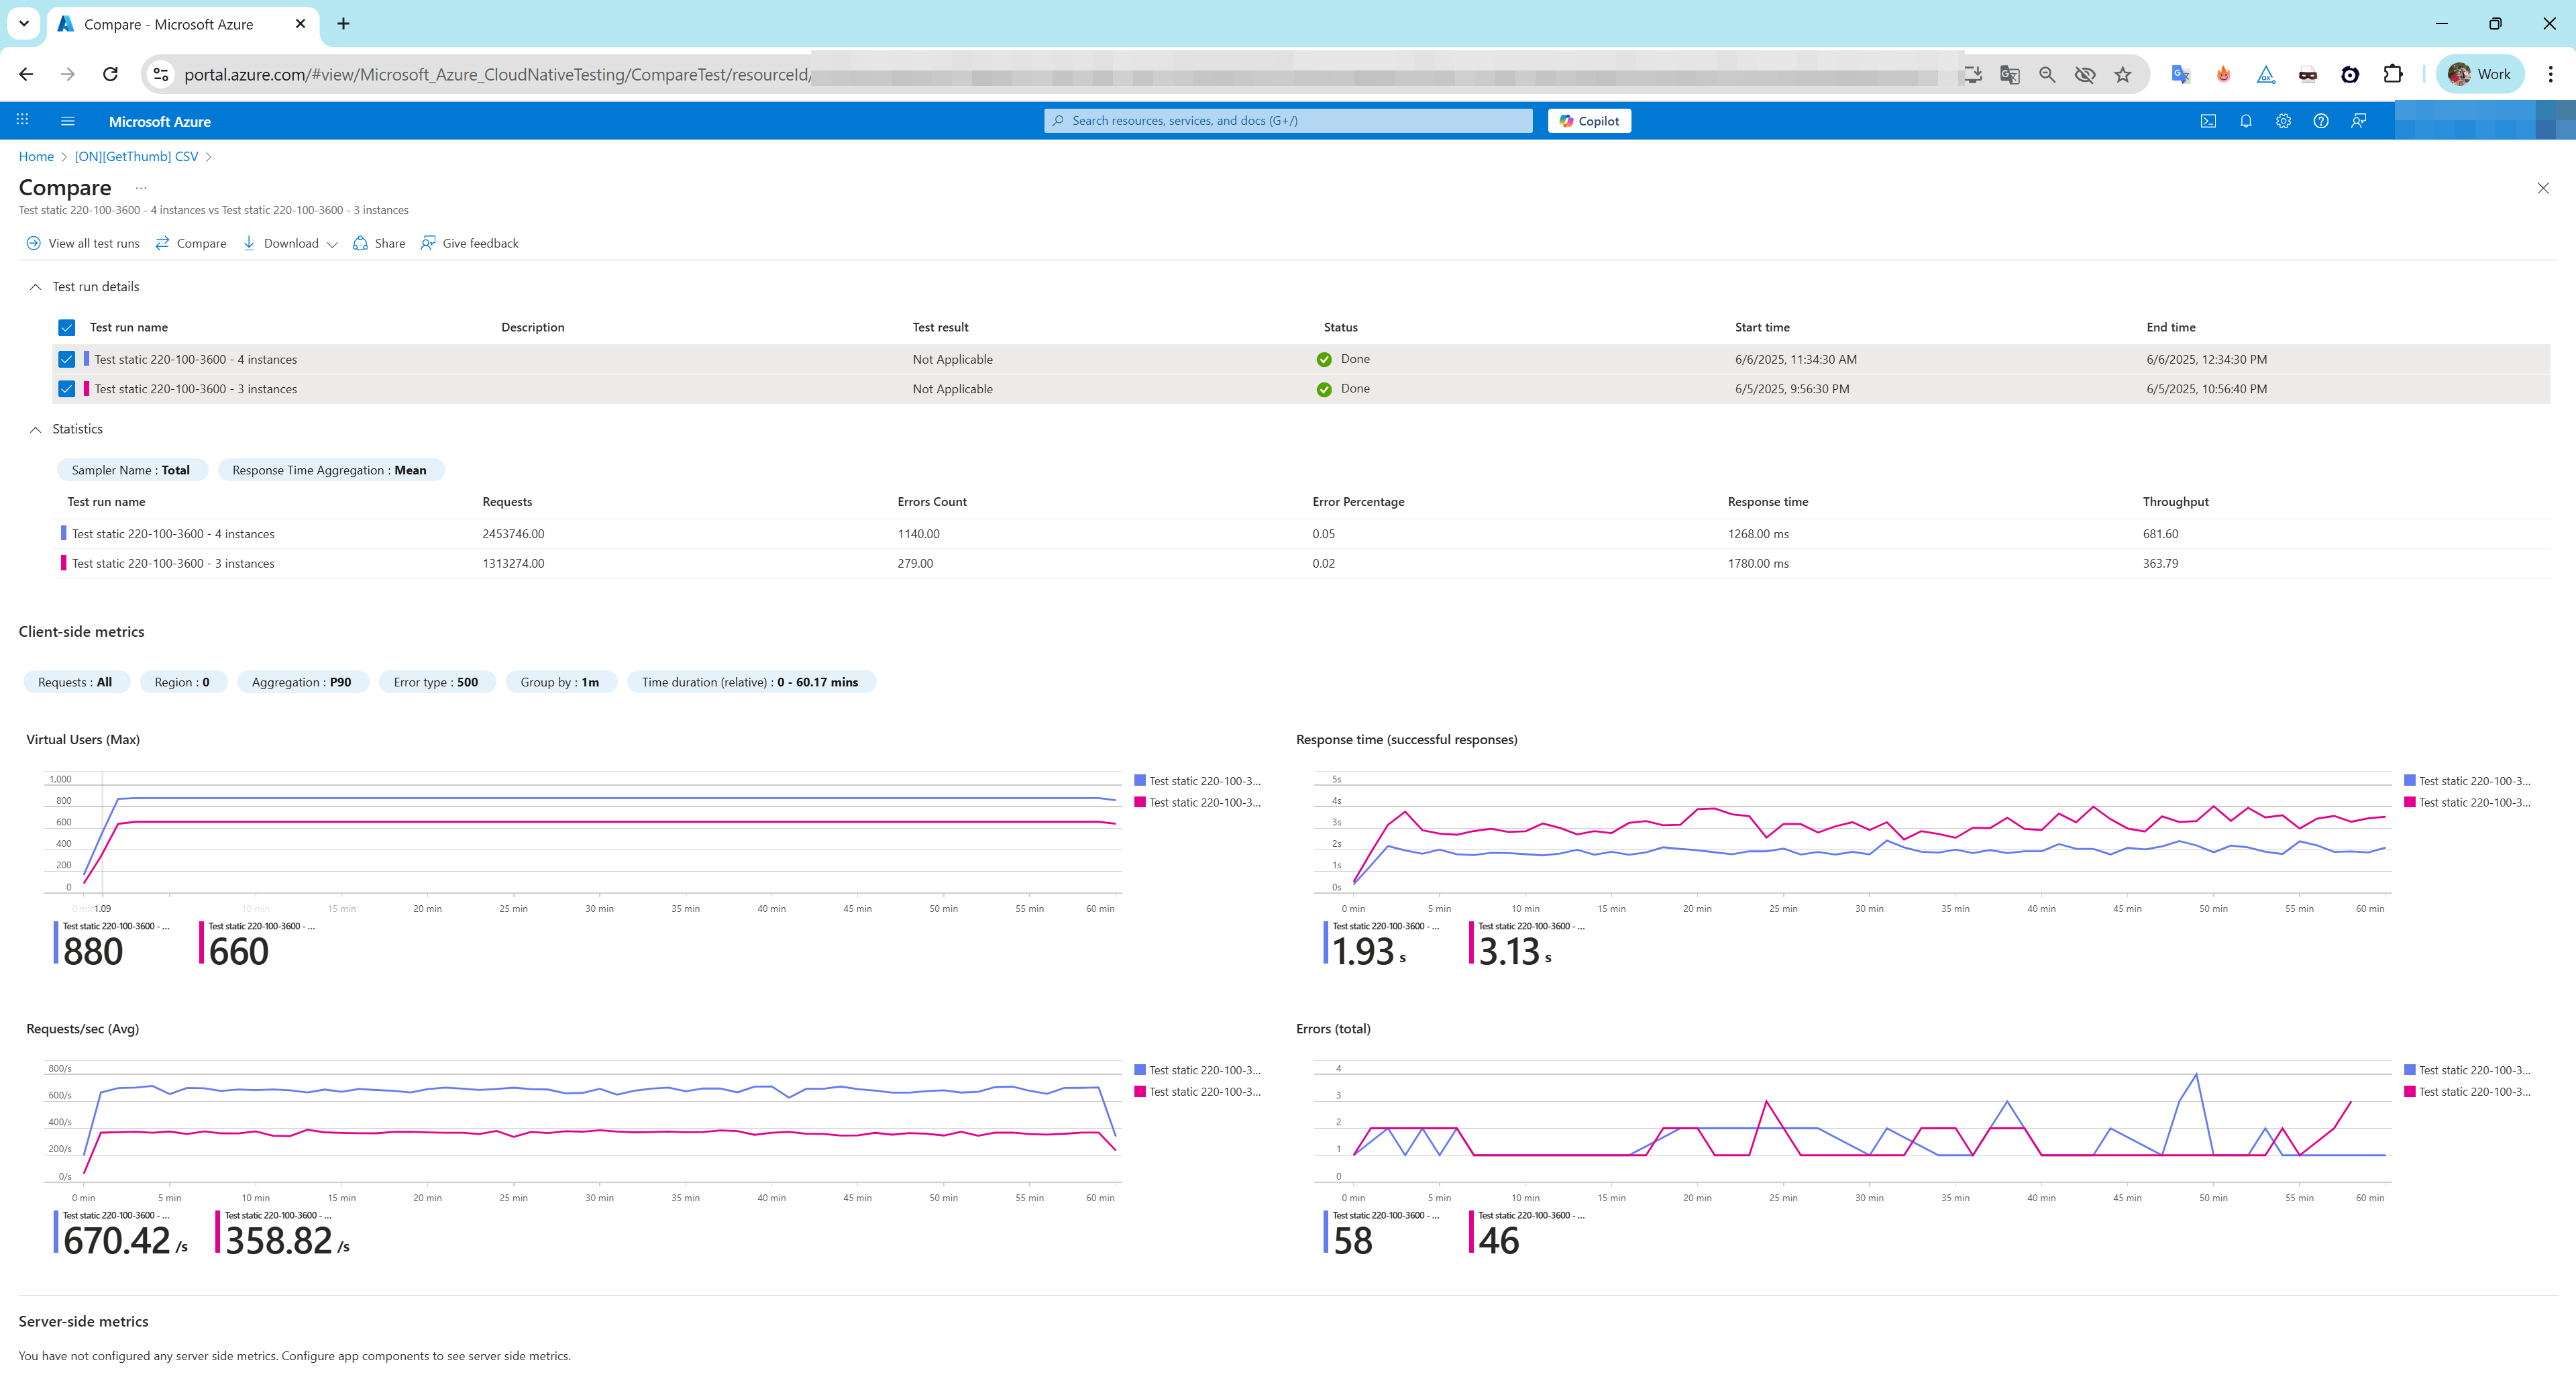
6.3 Downloading Reports and Logs
- To download the HTML report for your load test, you must first ensure the test has finished running. Then, go to the Test Results dashboard in the portal. From there, click on the Download button and select the Report option. This action will download a file named
report.zipwhich contains the report.
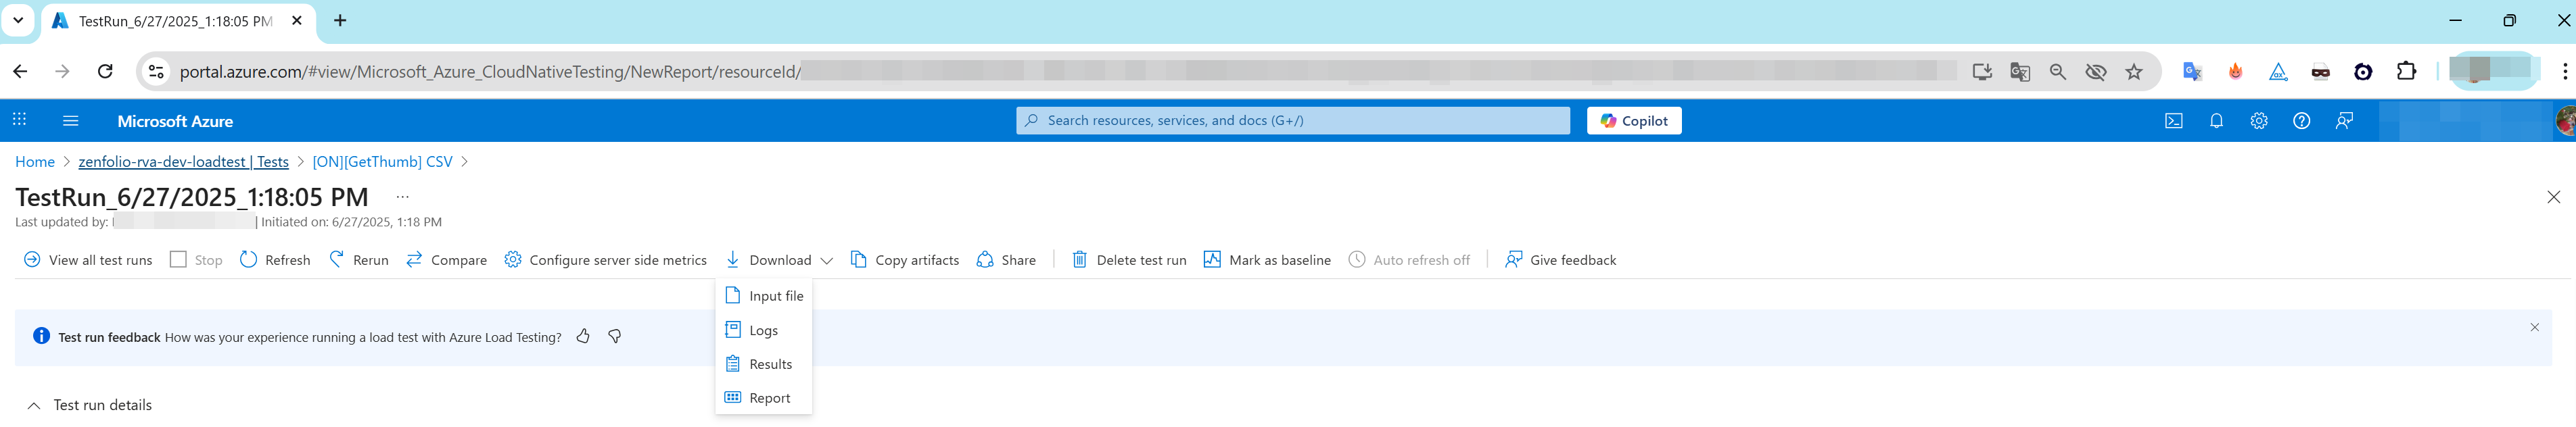
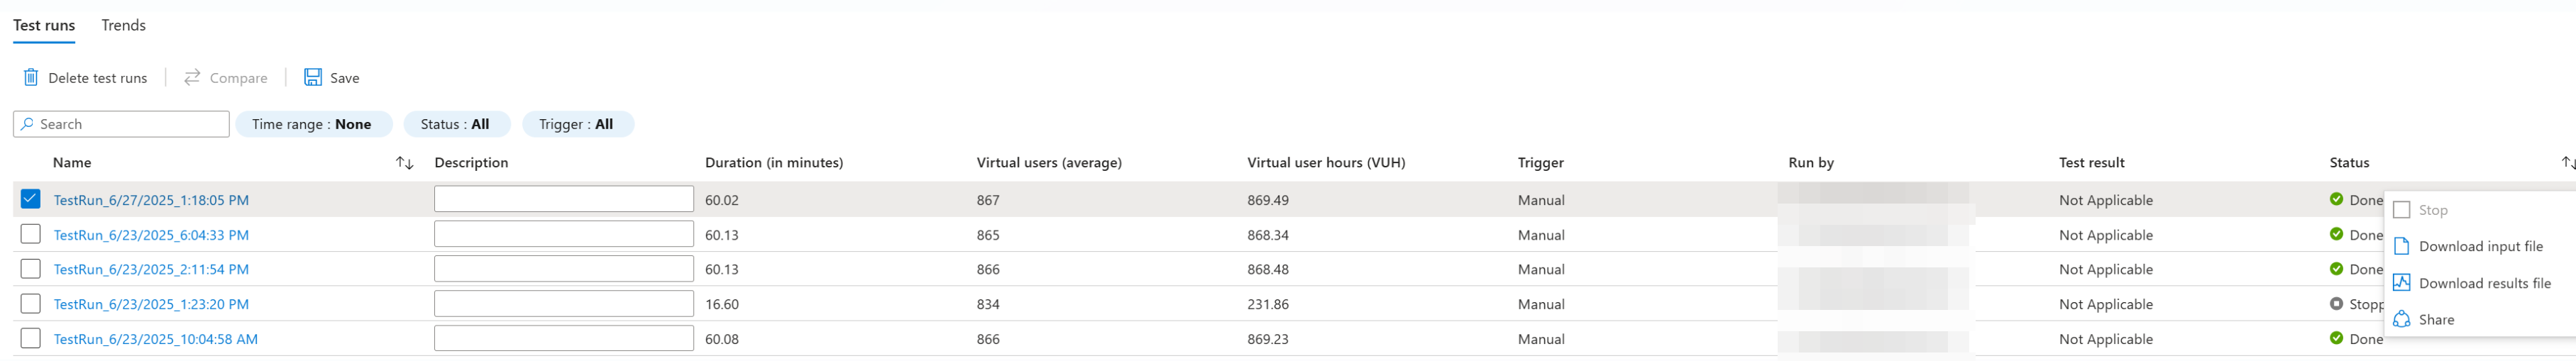
- Select the ellipsis (…) next to the load test run you’re working with, and then select Download results file.
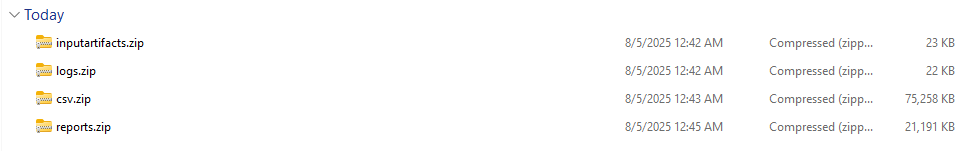
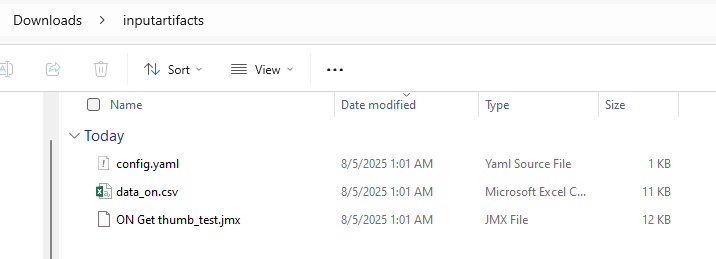
- Firstly, input artifacts refer to the files you upload for your load test. These are your input files, such as a
.jmxscript for JMeter, a Python script for Locust, or any.csvdata files your test needs.
- Secondly, download the
report.zipfile. Then, extract its contents and open theindex.htmlfile to view your load test results and performance metrics offline.
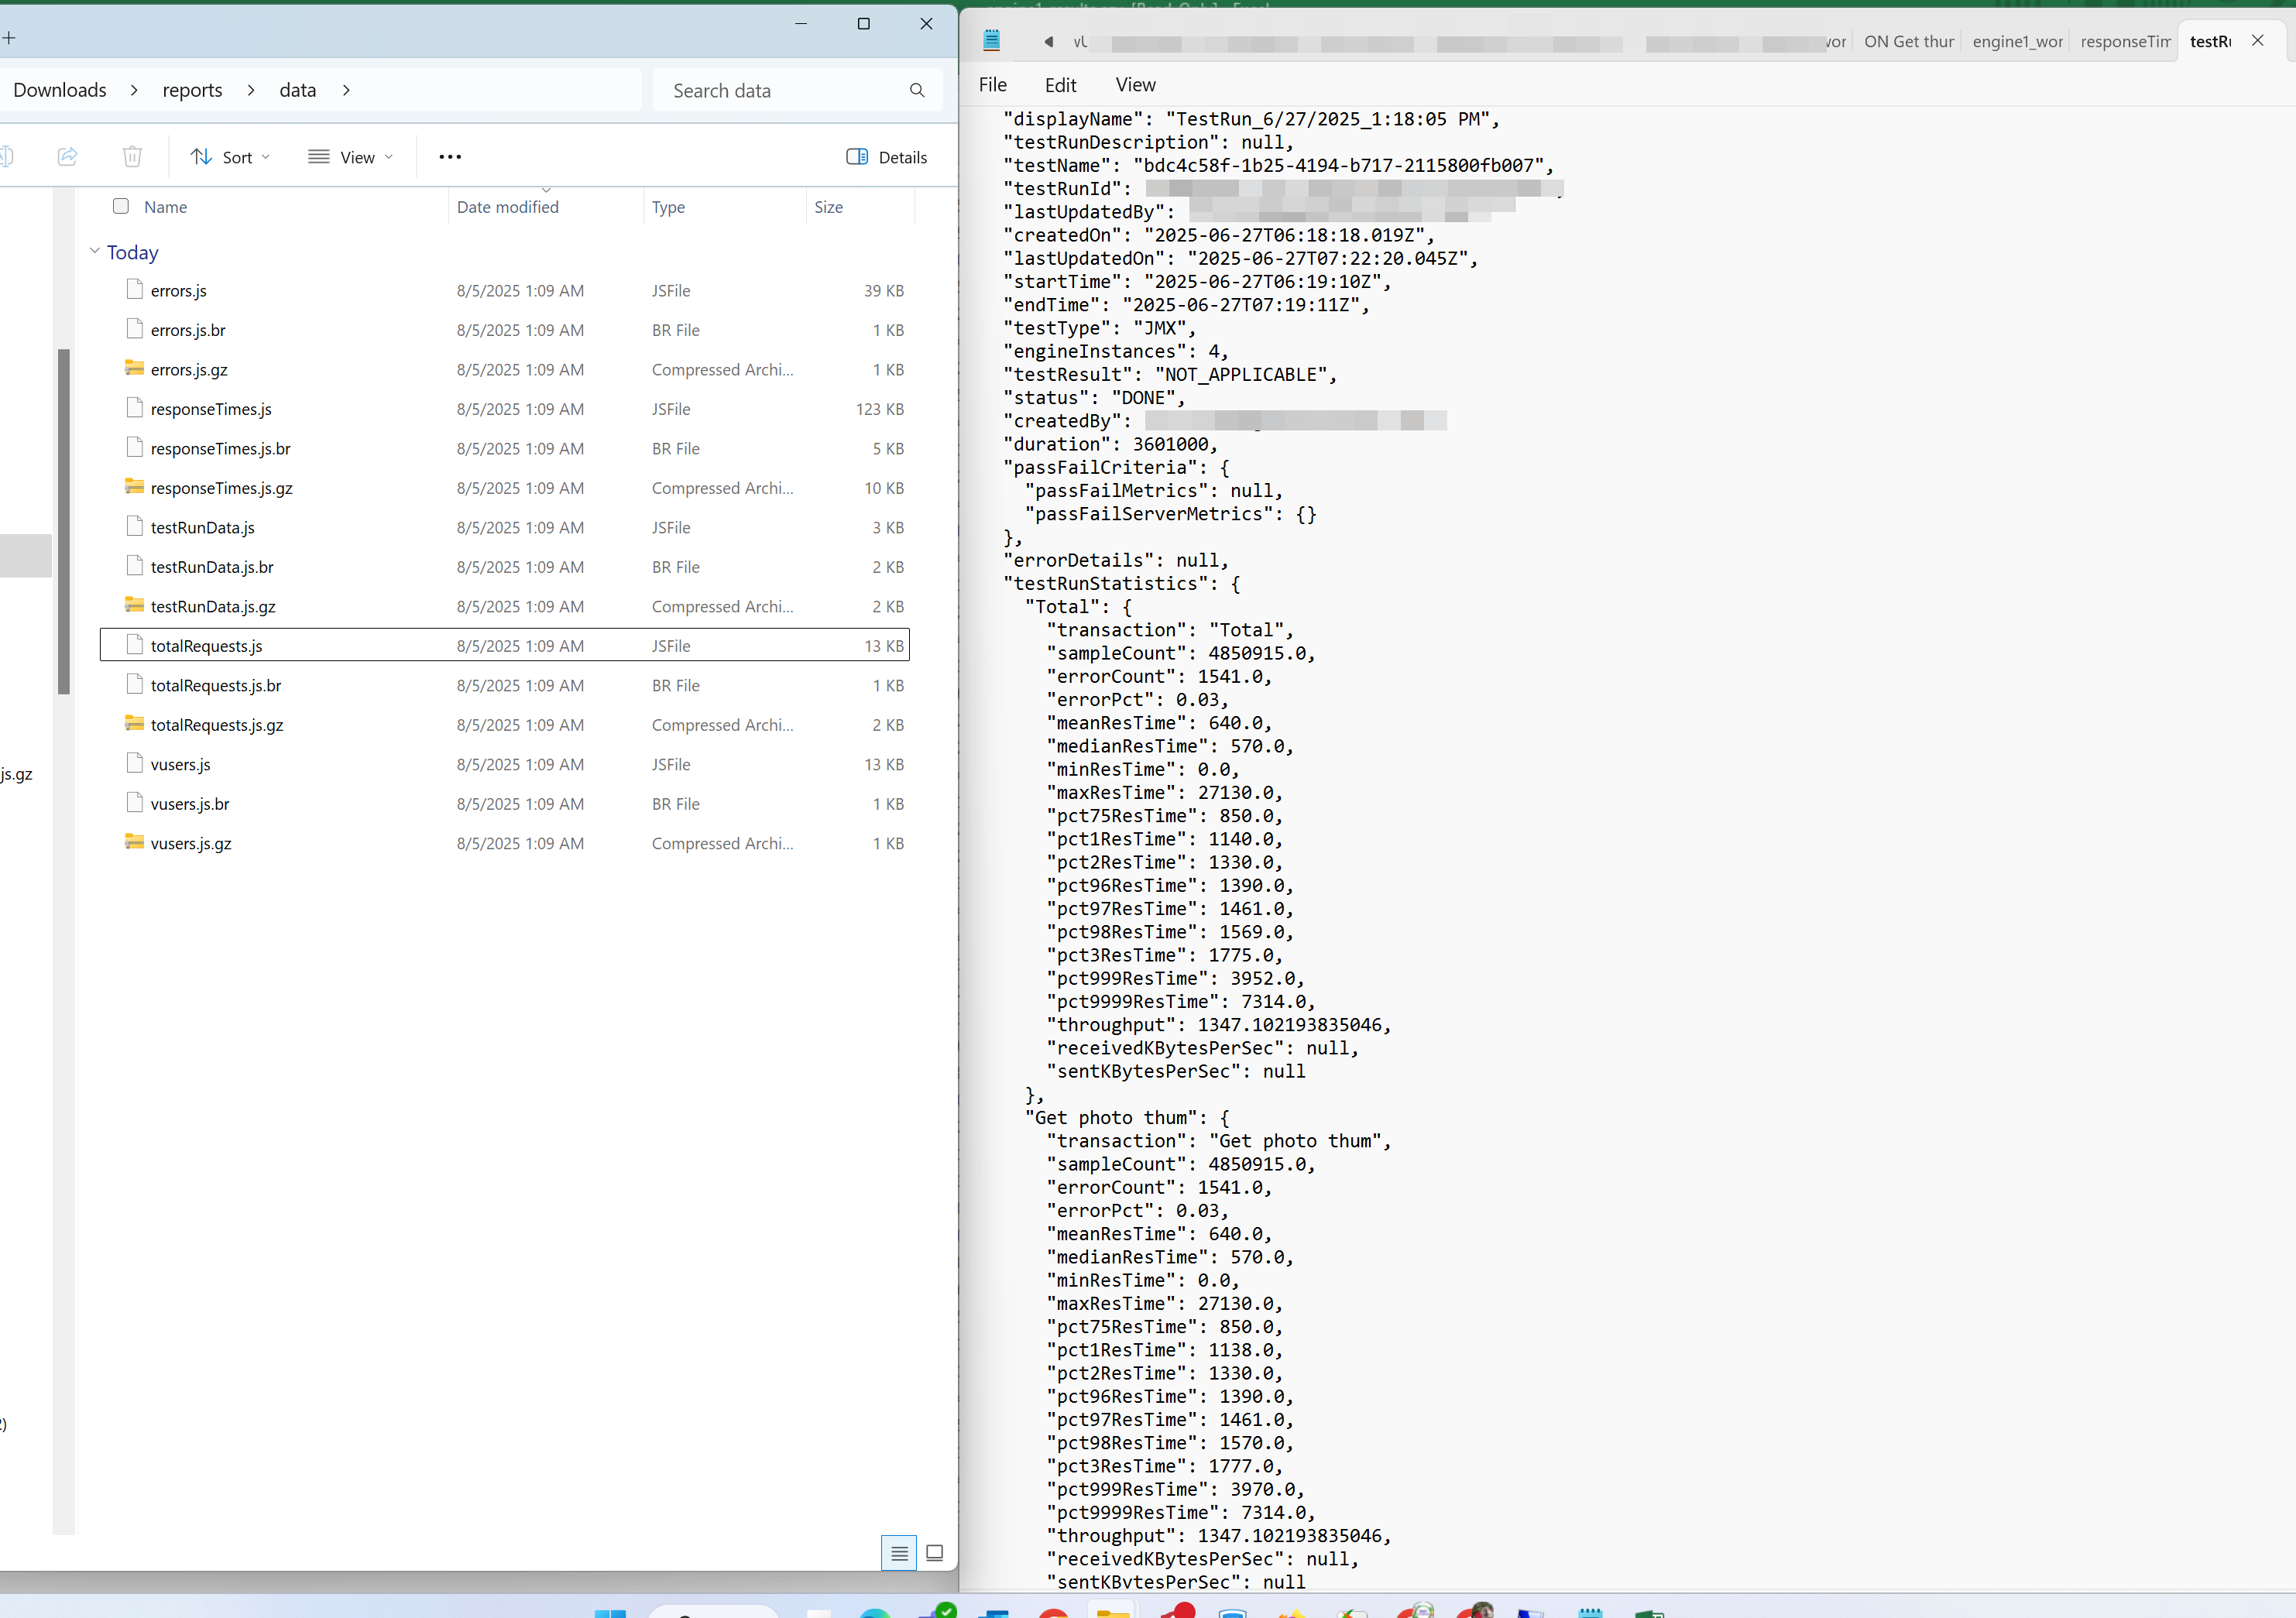
- Open the report > data
- In addition, you can sort and filter the rows in the ‘Sampler Statistics’ section for more convenience.
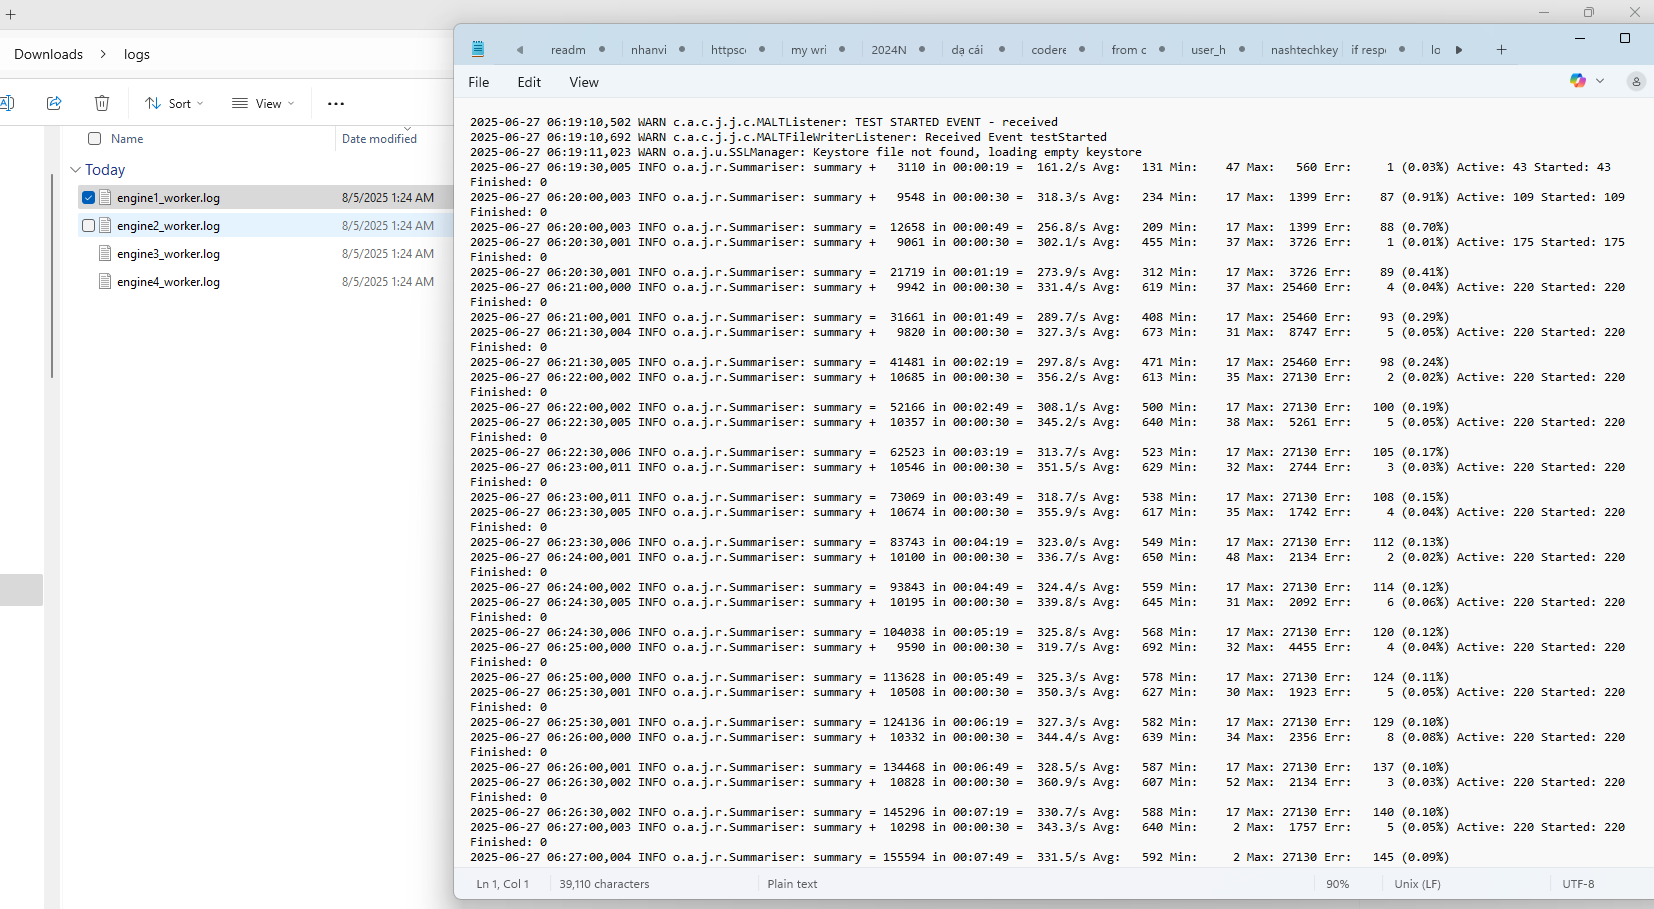
- Thirdly, you can check the
engine_worker.logfile for more details.
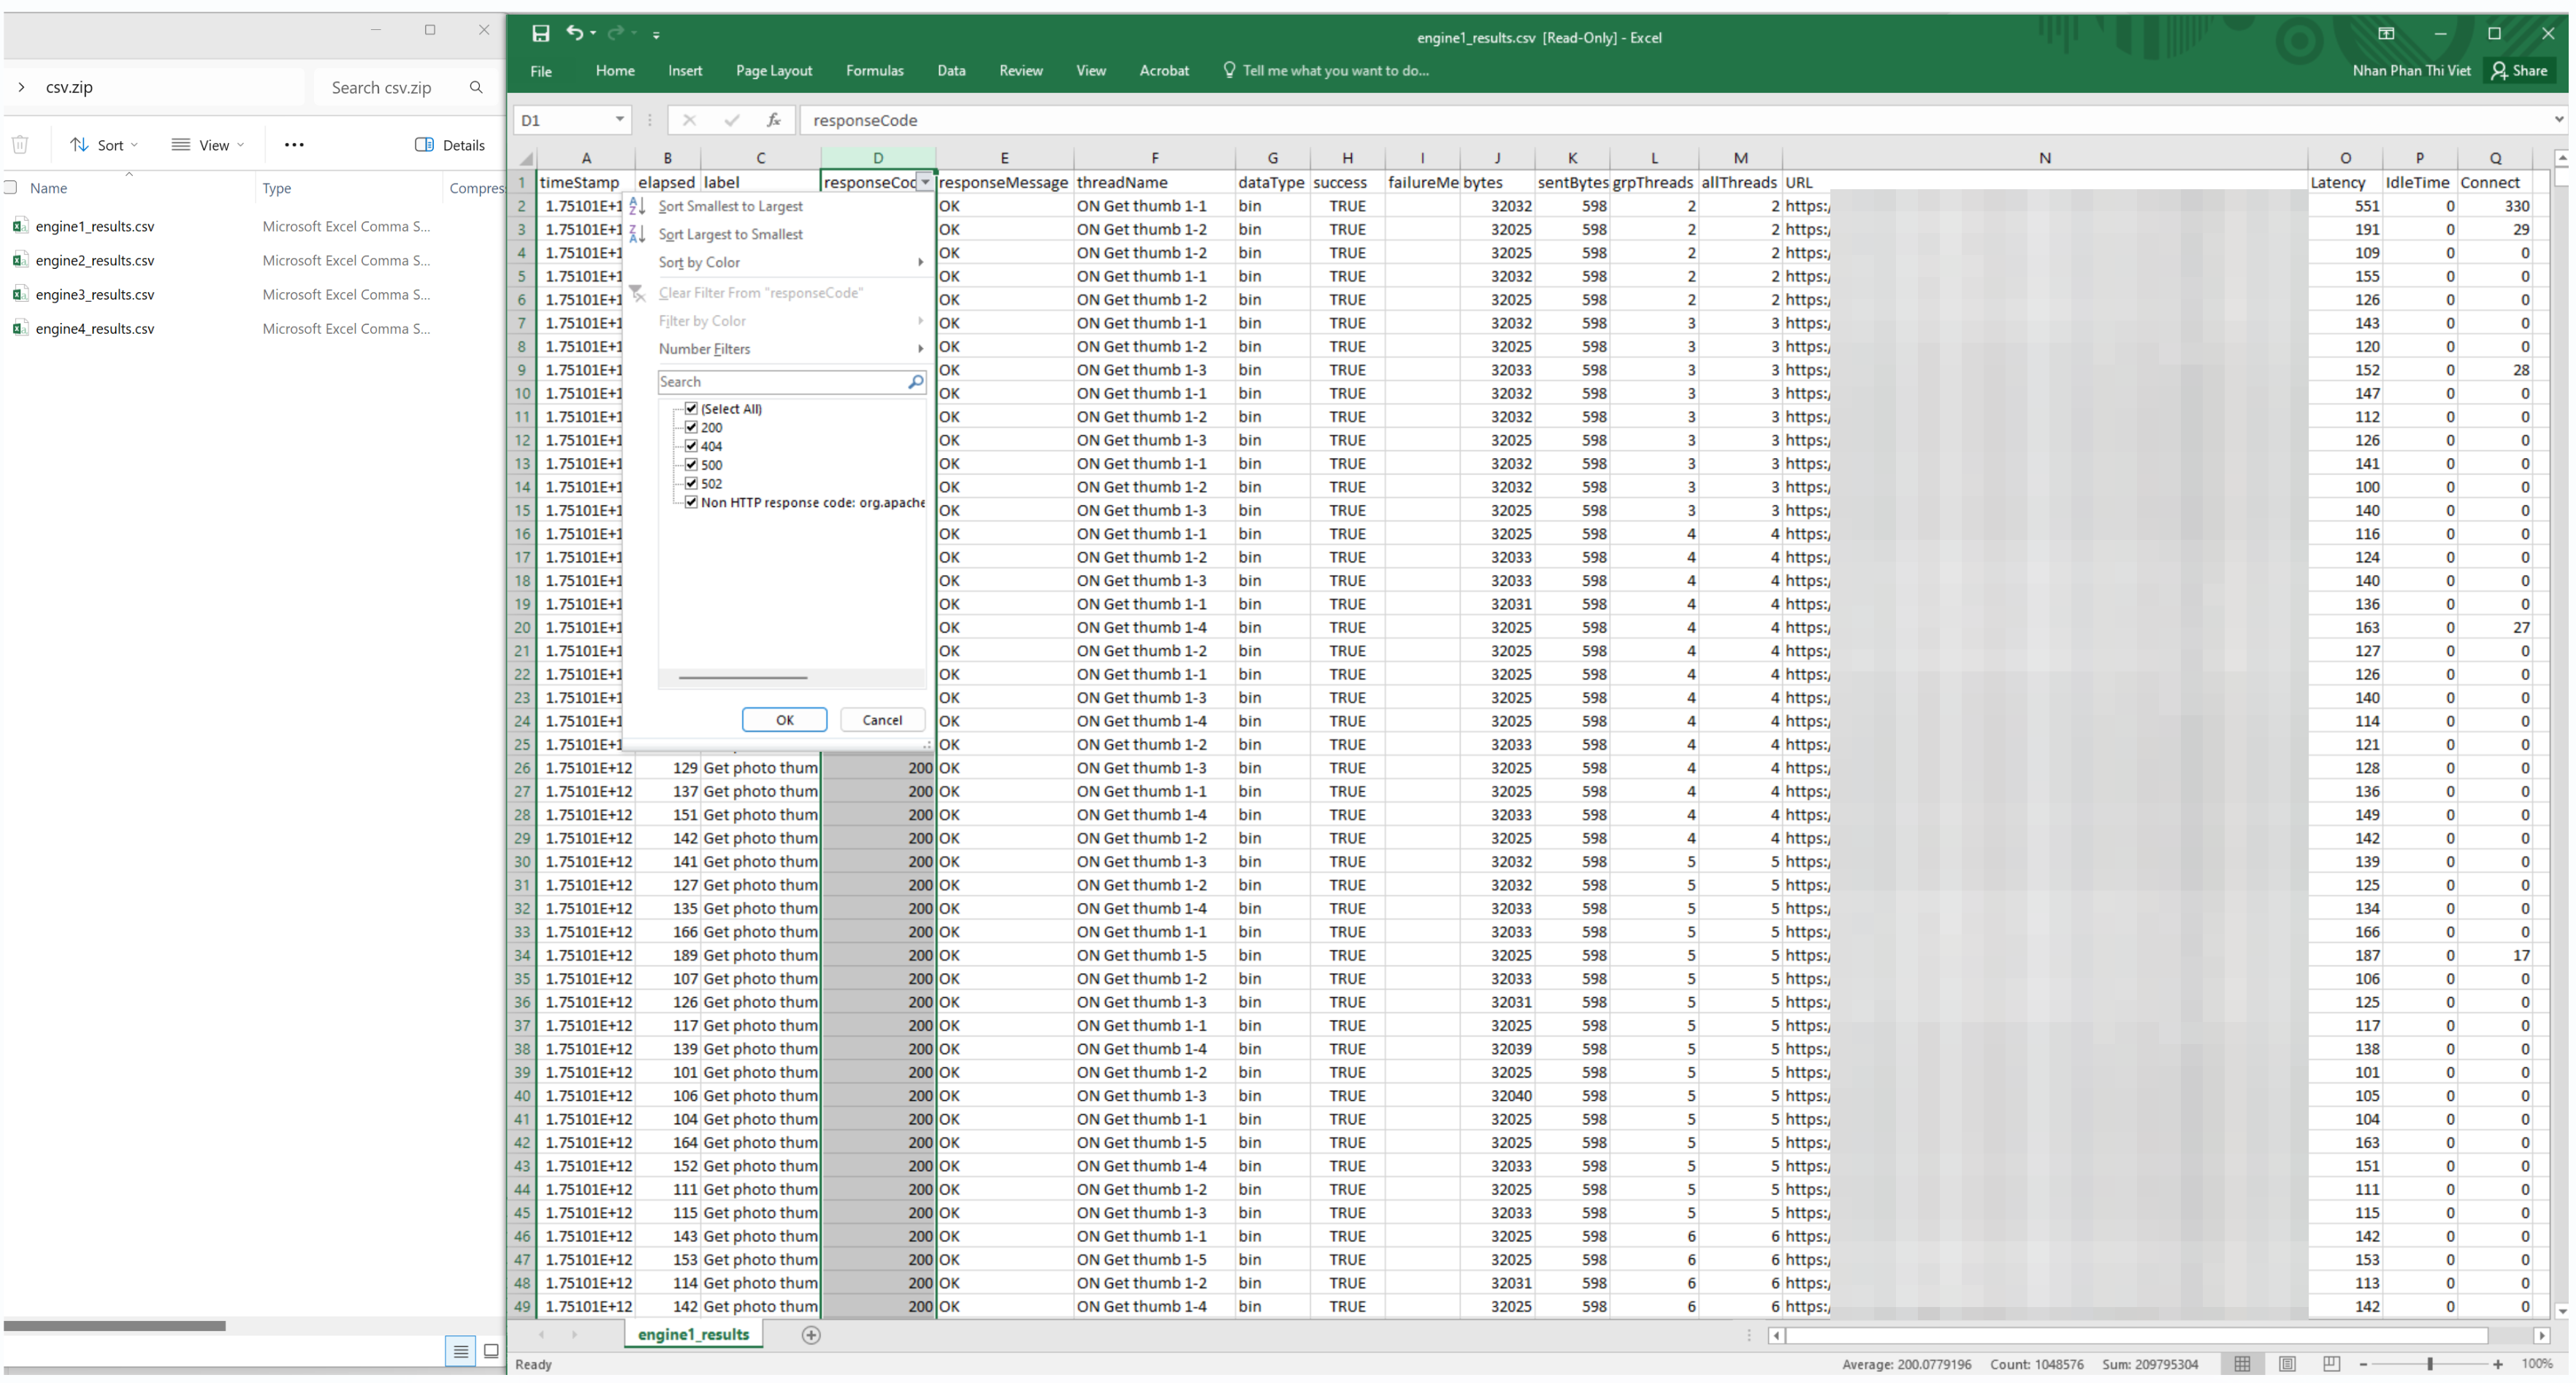
- Finally, the report.zip file contains raw performance data in a CSV format, which gives you a detailed look at each request. This data is crucial for root cause analysis. You can sort by the responseCode and responseMessage columns to quickly find failed requests (e.g., HTTP 404 or 500 errors). The label field then helps you pinpoint the specific URL or API endpoint that is breaking under load.
7. Best Practices for Azure Load Testing
Azure Load Testing provides a scalable and managed platform for simulating real-world traffic and diagnosing application performance under stress. To maximize reliability and insight, adopt the following advanced practices:
- Design with Realistic Load Patterns: Craft traffic profiles that reflect real usage—such as constant steady-state, spikes, step-wise increases, or gradual ramp-up—to surface issues that only occur in transitional or stress-load scenarios. Use these patterns for accurate capacity planning and detection of edge-case failures.
- Define Pass/Fail Criteria Based on Percentiles and Errors: Establish thresholds such as “95th percentile response time > 2 s” or “error rate > 1%” to automatically abort failing tests. This ensures performance gates are enforced in CI/CD pipelines without manual oversight.
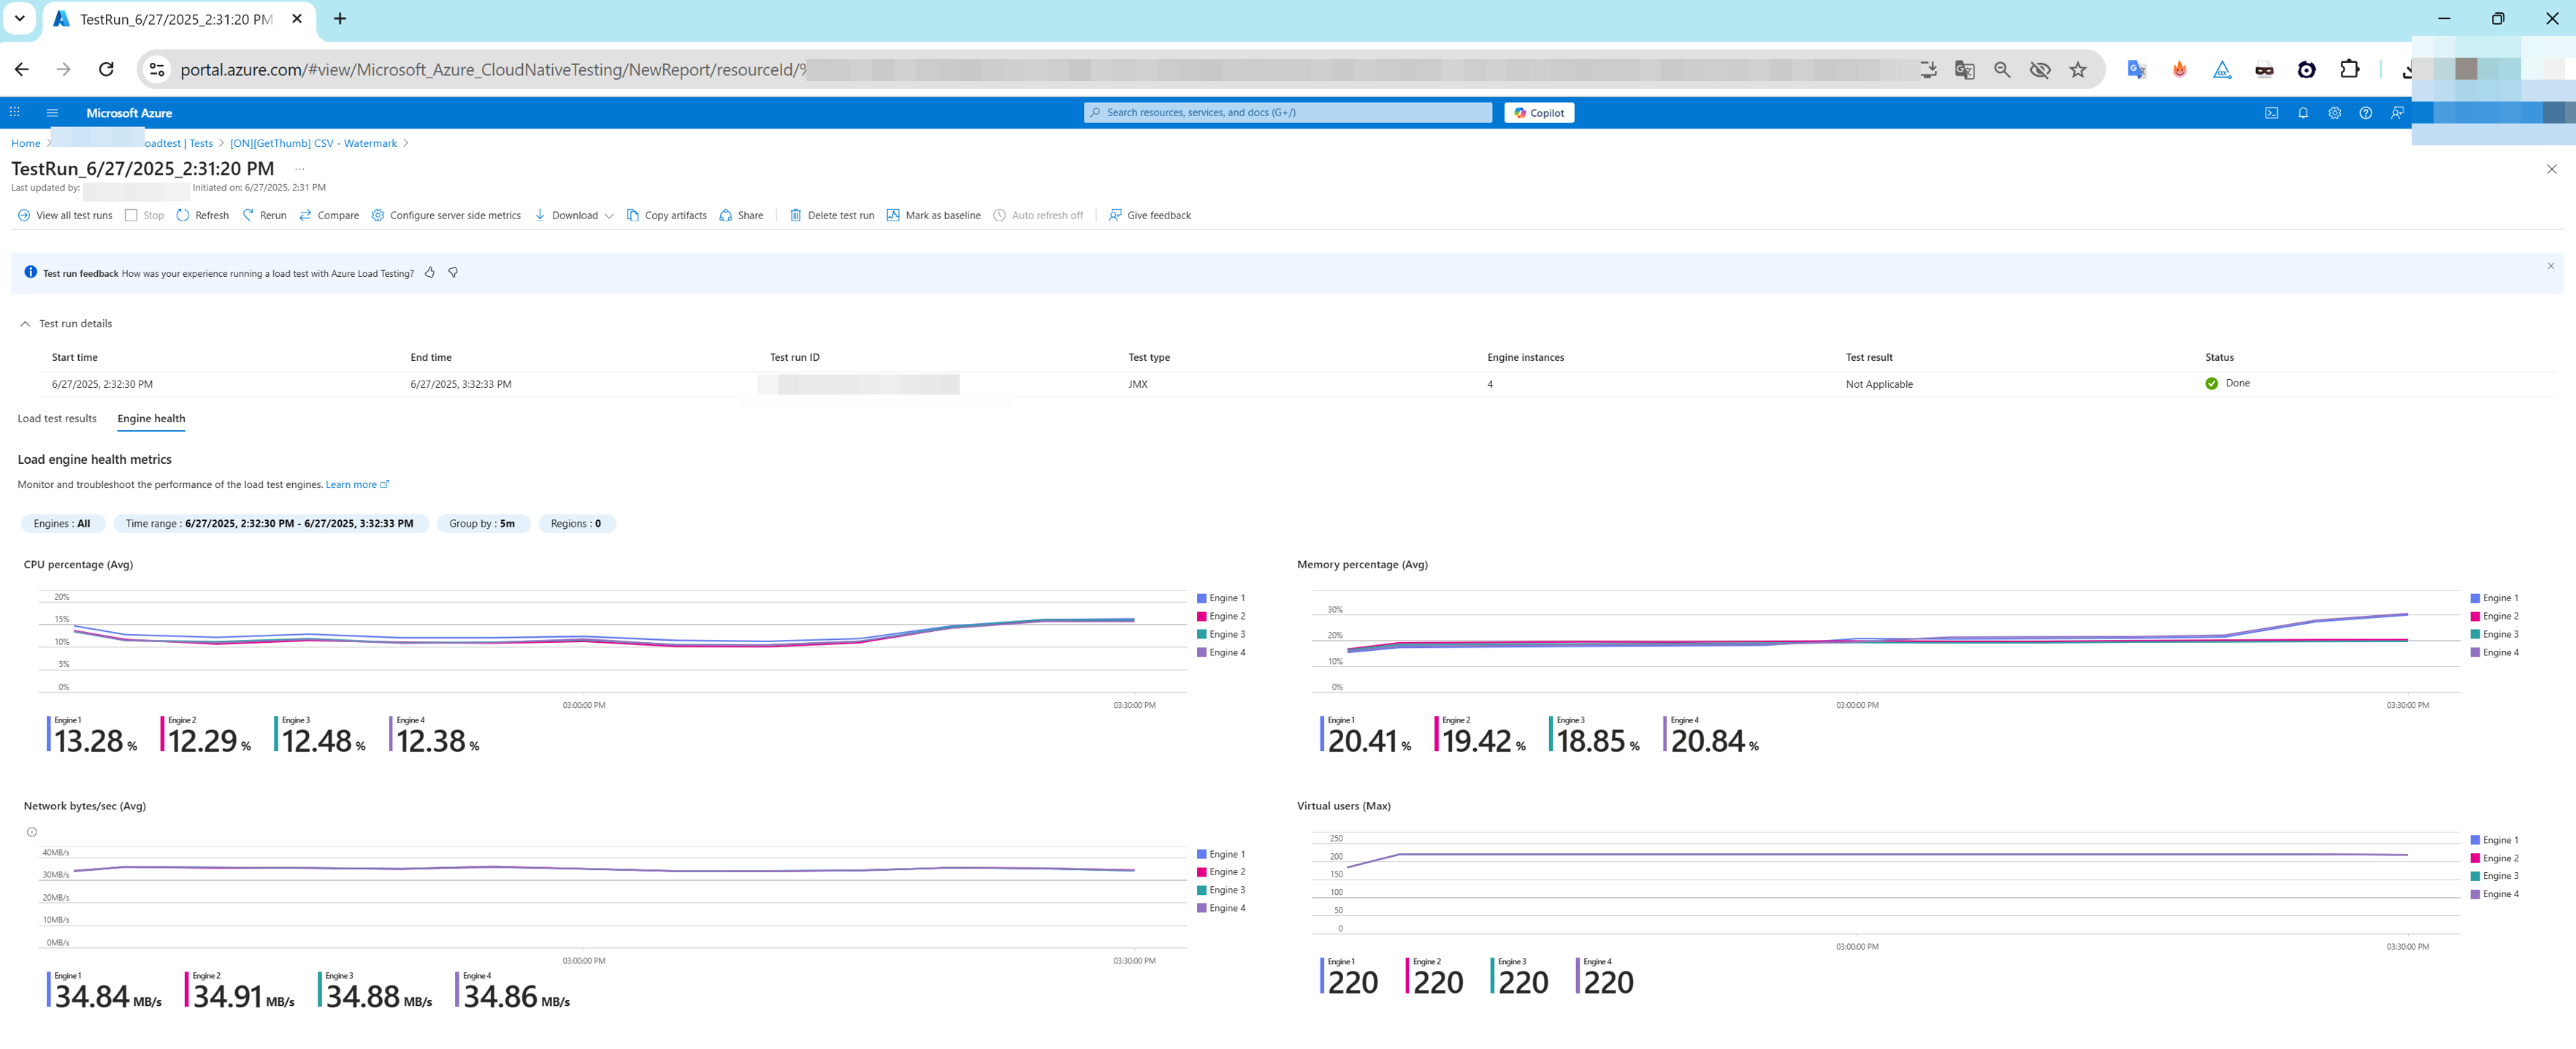
- Monitor Test Engine Health Metrics: At scale, track CPU, memory, and request throughput across test engine instances. Even load distribution prevents skewed results caused by overloaded agents and improves result consistency.
- Correlate Client and Server-Side Metrics for Root Cause Analysis: Consider test-engine metrics (latency, RPS, error rate) alongside backend metrics from Azure Monitor (CPU utilization, HTTP responses, queue lengths). This dual perspective helps isolate whether bottlenecks stem from client-side, network, or server resources.
- Leverage VNet Injection for Private Endpoint Testing: For internal or staging endpoints not exposed to the internet, deploy test engines into an Azure Virtual Network. This secures connectivity while allowing comprehensive load testing of private services.
- Adopt Progressive Ramp-Up Strategy: Start with a low number of virtual users and ramp load gradually. Monitor response times and failure rates to identify load thresholds and protect backend systems from sudden load spikes.
- Automate Recurring Tests and Track Performance Over Time: Integrate Azure Load Testing into automated build and deployment workflows or schedule periodic runs. Use historic comparisons to identify performance regressions and validate stabilization over releases.
- Secure Secrets via Key Vault or Environment Variables: Centralize sensitive data (API keys, tokens, certificates) in Azure Key Vault or environment variables instead of embedding in scripts. This ensures secure and repeatable test runs across environments.
- Export Test Data for In-Depth Analysis: Beyond Azure dashboards, download logs in CSV, JTL, or raw engine format and analyze offline using tools like Power BI, Grafana, or Excel to create customized dashboards, archival records, and collaborative reporting.
- Prioritize Tail-Latency Percentiles (P90, P95, P99): Average latency can mask worst-case user experiences. Monitoring high-percentile latency under load is critical to ensure SLAs are met, especially during peak usage.
8. Limitations & Consideration
- Engine & VU Limits per Test: Azure Load Testing supports up to 400 engine instances per test, each handling around 250 virtual users, enabling up to 100,000 VUs when fully scaled—depending on script complexity.
- Subscription/Region Quotas: Default limits per test are typically 45–400 engine instances, depending on subscription and region. Increasing beyond quotas requires a support ticket.
- Maximum Test Duration: Default test runtime is 1 hour, but JMeter-based tests can be extended up to 24 hours via support request.
- Monthly Virtual User Hour (VUH) Cap: You can define a monthly VUH limit per resource. Exceeding this cap stops in-flight tests and blocks further runs until the limit resets.
- Test Run Limits per Test: Each test is limited to around 5,000 runs. Automated or frequent testing may exhaust this quota quickly, so older runs should be cleaned up or spread across tests/subscriptions.
Data Retention Periods:
– Client-side metrics: up to 365 days.
– Server-side metrics: up to 90 days.
– Logs and test results: up to 6 months.
– Data older than these thresholds is automatically purged.- Supported Frameworks Only: JMeter & Locust, Other tools (e.g., gRPC, Selenium, custom scripts) are not supported.
- Debug Mode Constraints: Debug mode runs on a single engine, with a 10-minute max duration, and does not record results in test‑run history—unsuitable for performance evaluation.
- Quick Test Limitation for Deep Scenarios: Quick URL-based tests are convenient for smoke checks but lack advanced controls like think time, parameterization, or ramp-down customization—unsuitable for robust performance testing.
9. Comparison of Azure Load Testing vs. other popular load testing tools
| Feature / Tool | Azure Load Testing | Apache JMeter | k6 (Grafana Labs) | Locust | LoadRunner (Micro Focus) |
|---|---|---|---|---|---|
| Tool Type | Managed Cloud-native PaaS | Open-source Desktop/CLI Tool | OSS CLI + SaaS | Open-source Python-based Framework | Commercial, On-Prem & Cloud |
| Supported Protocols | HTTP(S), WebSocket | HTTP(S), SOAP, JDBC, JMS, FTP, TCP, SMTP, LDAP | HTTP(S), WebSocket | HTTP(S), WebSocket | HTTP(S), SAP, Citrix, Oracle, RDP, MQTT, etc. |
| Test Authoring Language | JMeter XML (.jmx), YAML (test plan), REST API | XML, Groovy, Beanshell scripting | JavaScript (ES6), TypeScript | Python | GUI (Vuser scripts), JavaScript, C-like languages |
| Test Runner Interface | Azure Portal, CLI, REST API, VS Code Extension | GUI, CLI (non-headless), Plugins | CLI (k6), k6 Cloud Web UI | CLI, Web UI (optional setup) | Controller GUI, CLI, LoadRunner Cloud |
| Infrastructure Setup Required | ✅ None – managed by Azure | ⚠️ Yes – install JMeter, plugins, JVM, JVM tuning | ✅ CLI setup locally, SaaS option available | ⚠️ Requires Python + environment setup | ⚠️ Complex: Controllers, Injectors, Monitors |
| Distributed Load Execution | ✅ Azure-injected engine with autoscaling | ⚠️ Requires custom remote agents (JMeter Server) | ✅ Native cloud scale via k6 Cloud or Kubernetes | ⚠️ Manual containers or distributed workers | ✅ Built-in via Load Generators |
| Max VUs / Scaling | 1000+ VUs per region by default; scalable | 1000s possible via tuning | 1000s (with paid k6 Cloud) | Limited by custom infra | Millions (licensed VUs) |
| Real-Time Metrics | ✅ Integrated with Azure Monitor, App Insights | ❌ Needs InfluxDB/Prometheus & Grafana plugins | ✅ Built-in dashboards (Grafana UI) | ⚠️ Requires integration with external systems | ✅ Advanced live graphs and bottleneck detection |
| Telemetry Correlation | ✅ App Insights Correlation ID, Server Metrics | ❌ Manual correlation needed | ✅ Custom metrics tagging | ❌ Not built-in | ✅ Deep diagnostics with APM tools |
| Assertions / Thresholds | ✅ Pass/Fail criteria based on metrics | ✅ Via Assertions or custom plugins | ✅ JS-based thresholds | ⚠️ Manual or via Python logic | ✅ SLA assertions |
| Error Diagnostics | ✅ Error summary + Azure telemetry correlation | ❌ Basic logs | ✅ Logs + error summary | ⚠️ Manual inspection | ✅ Root cause analysis tools |
| Private Network Testing (VNet/VPC) | ✅ Native Azure VNet support | ⚠️ Only via custom agent deployment | ✅ k6 Private Load Zone | ✅ SSH/Proxy/VPN supported | ✅ Private agent provisioning |
| CI/CD Integration | ✅ GitHub Actions, Azure DevOps, REST API | ✅ Jenkins, GitLab, Azure DevOps | ✅ All major CI/CD tools | ⚠️ Requires scripting and custom setup | ✅ Jenkins, Bamboo, GitLab |
| Result Reporting | ✅ Side-by-side test comparison, downloadables | ⚠️ Basic HTML reports | ✅ JSON/HTML dashboards | ⚠️ CSV or build-your-own | ✅ Detailed HTML, PDF reports |
| Cloud-native Observability | ✅ Full integration with Azure services | ❌ Not built-in | ✅ Grafana Cloud + Loki/Prometheus | ❌ Requires manual setup | ✅ via LoadRunner Cloud, APMs |
| Learning Curve | ✅ Easy portal usage, CLI available | ❌ Steep: XML config & plugin learning | ✅ Dev-friendly syntax | ⚠️ Python required | ⚠️ Enterprise-only, high complexity |
| Use Case Suitability | Azure apps, microservices, AKS, serverless apps | Protocol-heavy apps, on-prem systems | APIs, microservices, shift-left dev teams | Custom test logic, low cost | Enterprise, regulated industries |
| Licensing Model | Pay-as-you-go based on virtual users | Free (Apache 2.0), infra cost only | OSS (free), Paid SaaS tier | Free (MIT), own infra | Expensive, user-based licensing |
10. Conclusion and Key Takeaways
Azure Load Testing is a powerful, fully managed service that makes it easy to simulate realistic, high‑scale traffic across applications hosted anywhere, without the burden of infrastructure setup. It integrates seamlessly with JMeter and Locust scripts, supports testing web APIs and private endpoints, and embeds into CI/CD pipelines allowing automated regression detection via defined pass/fail thresholds. The service provides rich client‑ and server‑side metrics (especially when targeting Azure‑hosted apps via Azure Monitor), encrypted data handling, and pay‑as‑you‑go pricing—helping teams validate performance under load, reveal bottlenecks early, and confidently release resilient applications while minimizing overhead and cost.
In future parts of this series, we’ll explore more advanced topics like integrating Azure Load Testing into CI/CD pipelines, using parameterized tests, and setting up custom dashboards.
The references:
- Azure Load Testing documentation
- Key concepts for new Azure Load Testing users
- Azure Load Testing Walkthrough
- Recommendations for performance testing
- Test private endpoints by deploying Azure Load Testing in an Azure virtual network
- Service limits in Azure Load Testing
- Manage usage limits on Azure Load Testing resource
- Comparing k6 and JMeter for load testing
- 15 Top Load Testing Software Tools for 2025 (Open Source Guide)
- Top Performance Testing Tools Compared: JMeter, LoadRunner, etc
- Top 10 Performance Testing Tools in 2025: Features, Pros, and Use Cases Compared
- Software load testing
- Apache JMeter
- K6 (software)
- LoadRunner
- Top Performance Testing Tools – Boost Scalability!