


Monitoring and debugging APIs is a key part of a tester’s role when working with MuleSoft. Accessing and searching logs effectively can help identify issues faster and ensure the quality of integrations. This blog will guide you through how to search and filter logs using the Anypoint Platform with step-by-step instructions.
1. What is MuleSoft?
MuleSoft is a powerful integration platform that helps organizations connect everything including applications, data, and devices by using APIs to enable digital transformation at scale. It was acquired by Salesforce in 2018, and it’s now a key part of Salesforce’s Integration Cloud that provides a platform for building application networks through API-led connectivity. Its core product is Anypoint Platform, which enables organizations to:
- Integrate applications, data, and devices across cloud and on-premises environments.
- Design, build, manage, and monitor APIs.
- Create reusable and scalable integrations, reducing redundancy and speeding up development.
2. Why should Tester search Log?
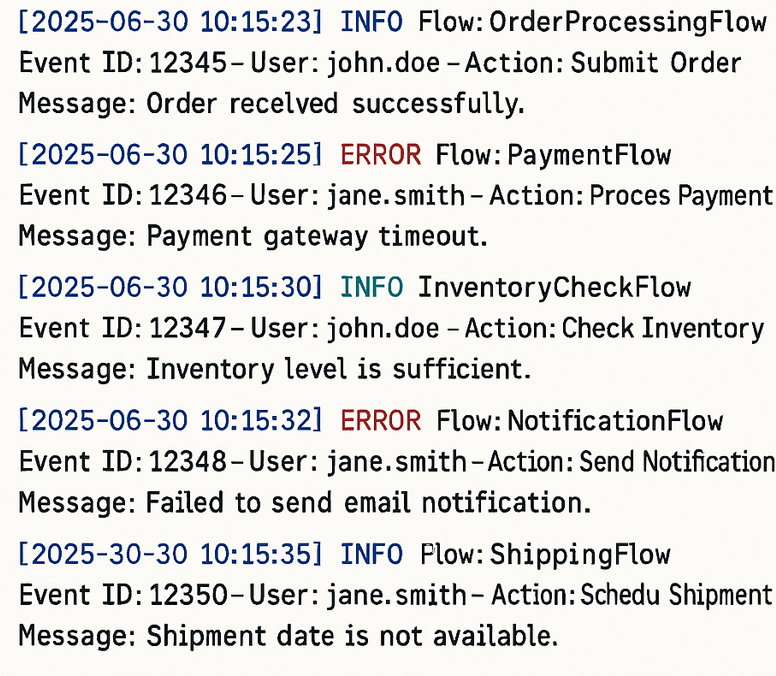
MuleSoft applications generate logs at different levels (INFO, DEBUG, ERROR, etc.) during execution. These logs help testers to:
- Validate whether a flow was triggered
- Track payloads and transformations
- Identify unexpected errors, warnings, or flow terminations
- Check performance metrics or execution time
- Debug integration test failures
3. Where to Find Logs in MuleSoft?
There are two main places where you can access MuleSoft logs in the Anypoint Plaftform
- Runtime Manager (CloudHub): This is the most common log access point for cloud deployments.
- On-Premise Server Logs: If your application is deployed on-premise, logs are available in the server’s filesystem.
In this post, we will walk through each step to search Logs in Mulesoft with Runtime Manager
3.1. Go to Anypoint Platform and log in with your credentials. Then, navigate to Runtime Manager In the top navigation bar
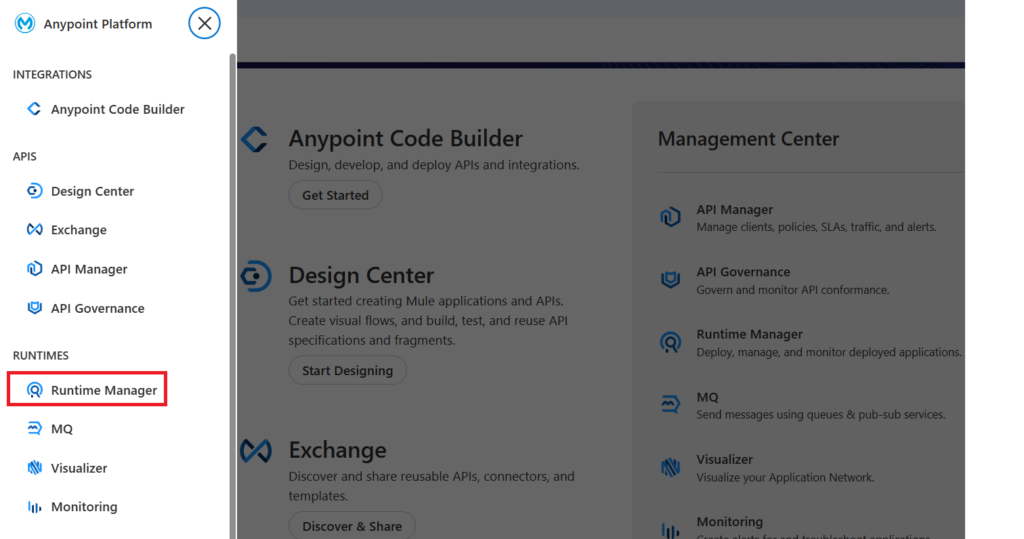
3.2. Click Runtime Manager, there are list of applications to select.

3.3. Click on your application in ‘Name‘ column (for example: test-service) and select the Logs tab.
3.4. How to search from the Log
To search the logs, you can search from the Log Search Field: Type your search query into the log search field and press Enter.
- Search for a term, such as
"unblock". Without quotes, the query returns results for matches to each term. - Use a wildcard in your search, such as
resourceId=Personal*. - Use logical operators, such as
resourceId=Personal* AND "unblock".
Besides, you can use the Search Bar and Advanced Filters
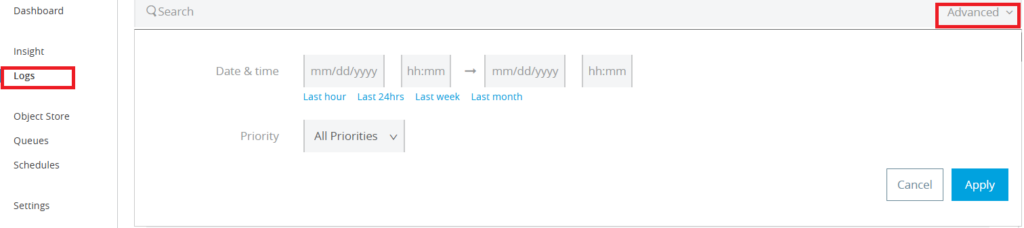
You can search logs by text keyword (e.g., “error”, “timeout”, “success”), time range or Priority (All Priorities, INFO, DEBUG, ERROR, FATAL, SYSTEM, CONSOLE, WARN) by filling information as example and click ‘Apply’ button
4. Conclusion
Start by searching logs will help to improve your ability to troubleshoot, validate, and collaborate with your dev team. By using Runtime Manager’s logging tools, testers can quickly pinpoint issues, validate test outcomes, and ensure robust performance of APIs and integrations. Thanks for your reading and happy testing with Mulesoft.