


1. Introduction — Why Testing in Production Still Matters
Testing in production is no longer a risky or reckless move.
In fast-moving environments with microservices, APIs, and globally distributed apps, real-time production testing is essential to maintain uptime, user experience, and confidence after each deployment.
Traditional QA environments can’t always replicate real-world load, data, or dependencies. Production testing ensures that:
- Every service behaves correctly under real conditions.
- API and frontend latency stay within defined thresholds.
- Users never experience broken flows silently.
For IT outsourcing or multi-technology companies, where multiple clients depend on different stacks, this approach ensures 24/7 reliability across all systems — from e-commerce APIs to multimedia platforms.
2. What Is New Relic?
New Relic is a comprehensive observability and monitoring platform that gives engineering and QA teams deep insight into production systems — in real time.
Unlike traditional synthetic tools, New Relic combines:
- Application performance monitoring (APM)
- Real-user monitoring (RUM)
- Synthetic and scripted checks
- Distributed tracing and alerting
This makes it a powerful choice for teams who want to move from passive uptime monitoring to active production validation.
Key capabilities include:
- Synthetic Monitoring: Automatically test endpoints, APIs, and browser flows.
- Scripted Browser Checks: Use Selenium-based scripts to validate user journeys.
- Dashboards & NRQL Queries: Customize metrics and KPIs for real-time insight.
- Intelligent Alerting: Create rules that detect anomalies or threshold breaches.
- Integrations: Seamlessly integrates with Slack, PagerDuty, Jira, GitHub, and CI/CD tools.
- Programmability (NerdGraph API): Automate test creation and manage alerts via GraphQL API.
3. Getting Started with New Relic Synthetics
3.1 Creating Your Account
- Visit newrelic.com and create a free account.
- Choose Full Platform (All capabilities) to unlock Synthetics, APM, and Dashboards.
- Once logged in, go to “Synthetic Monitoring” from the left navigation.
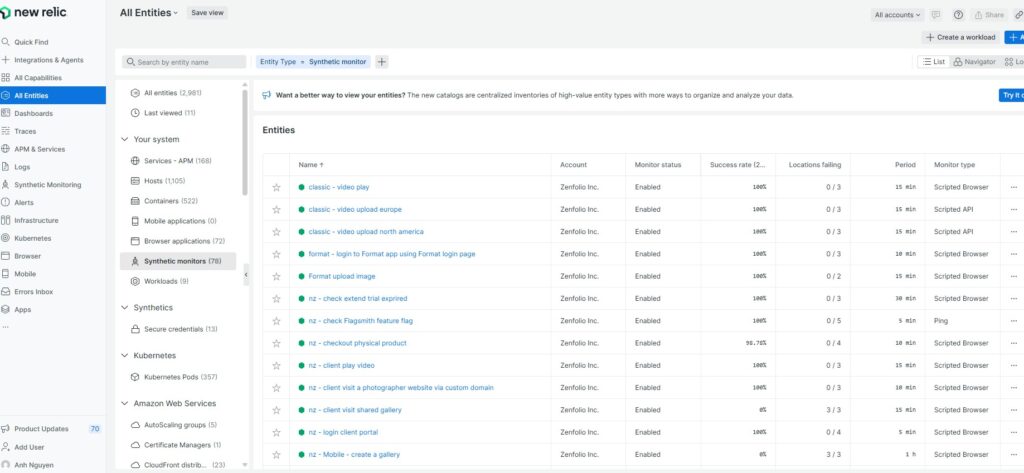
3.2 Creating Your First Synthetic Check
Let’s start with a simple API ping test for your production endpoint.
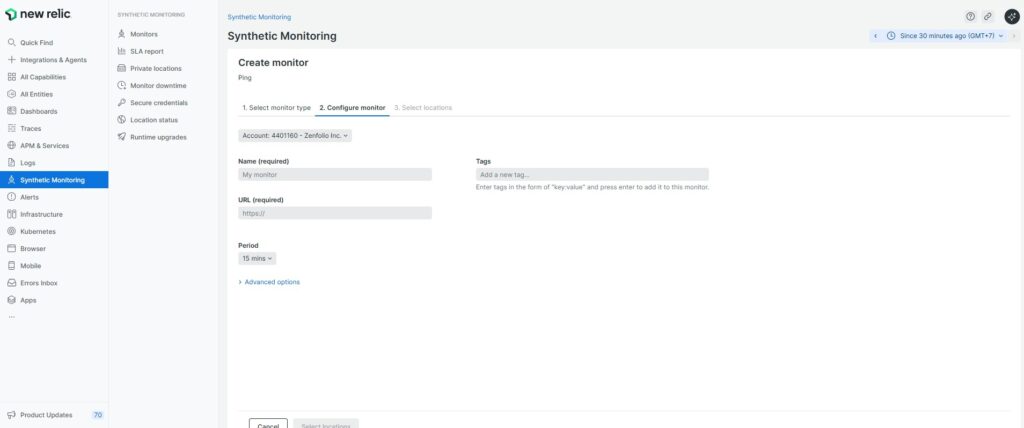
- Go to Synthetics → Create monitor → Simple Browser or API test.
- Choose Monitor Type: API test (Ping)
- Enter details:
- Name:
Production API Health - URL:
https://api.example.com/health - Period: 15 minutes
- Locations: Choose 2 global regions (e.g., Singapore, Frankfurt).
- Name:
Click Save monitor, and New Relic begins real-time testing from distributed agents.
Click Save monitor — and within 60 seconds, Checkly starts testing your endpoint in real time.
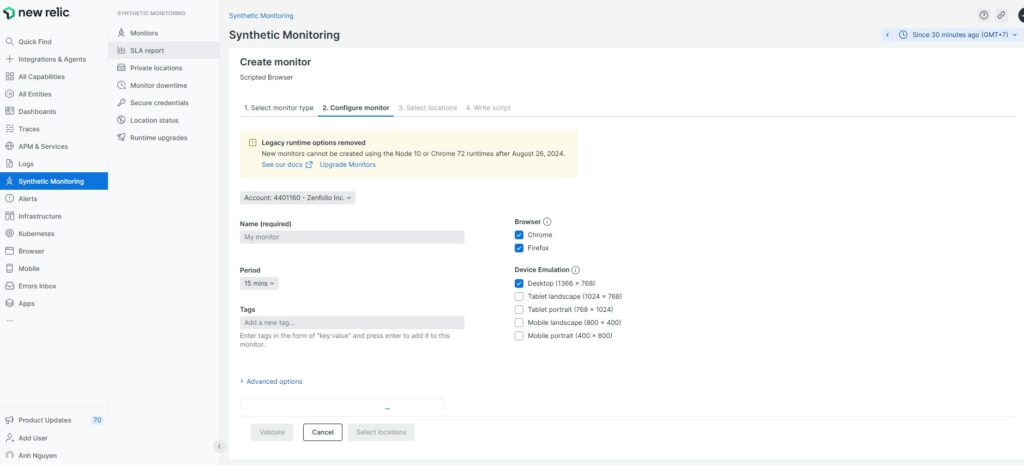
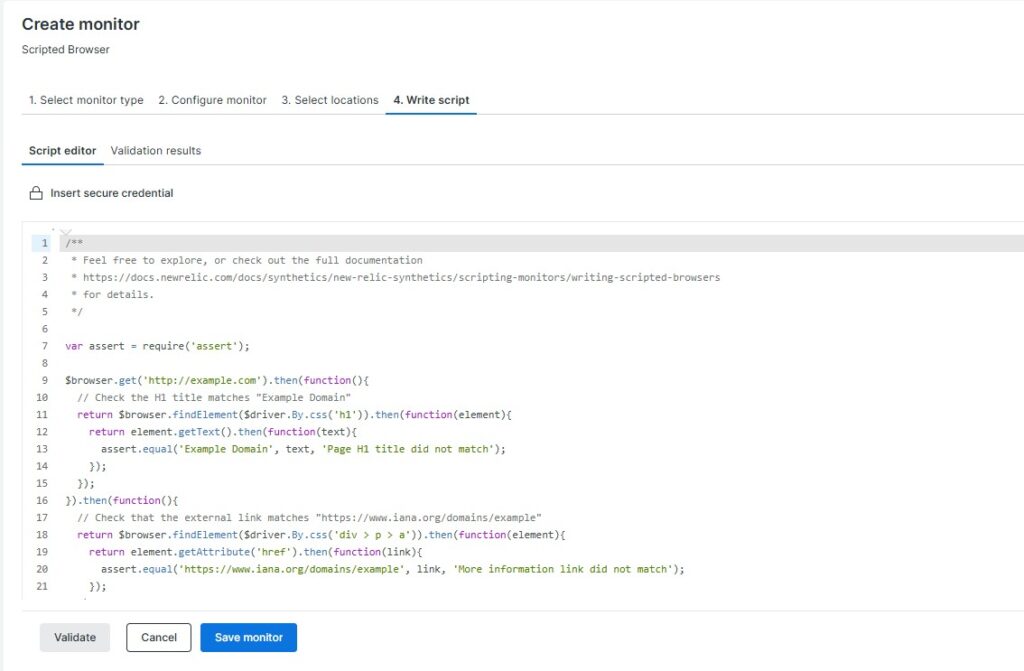
4. Browser Testing with Scripted Monitors
New Relic also allows you to perform browser-level scripted tests that simulate user flows using JavaScript (Selenium WebDriver).
Here’s an example script to test a login and dashboard redirect:
Here’s how a Playwright-based browser check looks in Checkly:
var assert = require('assert');
$browser.get('https://app.example.com/login')
  .then(function() {
    return $browser.findElement($driver.By.id('email')).sendKeys('testuser@example.com');
  })
  .then(function() {
    return $browser.findElement($driver.By.id('password')).sendKeys('password123');
  })
  .then(function() {
    return $browser.findElement($driver.By.css('button[type="submit"]')).click();
  })
  .then(function() {
    return $browser.waitForAndFindElement($driver.By.css('h1'), 5000);
  })
  .then(function(element) {
    return element.getText().then(function(text) {
      assert.equal(text, 'Welcome');
    });
  });
💡 Tips:
- Use
waitForAndFindElement()to avoid timing issues on dynamic pages. - Add assertions to verify expected outcomes (titles, URLs, content).
- Group related monitors (login, checkout, upload) for easy management.
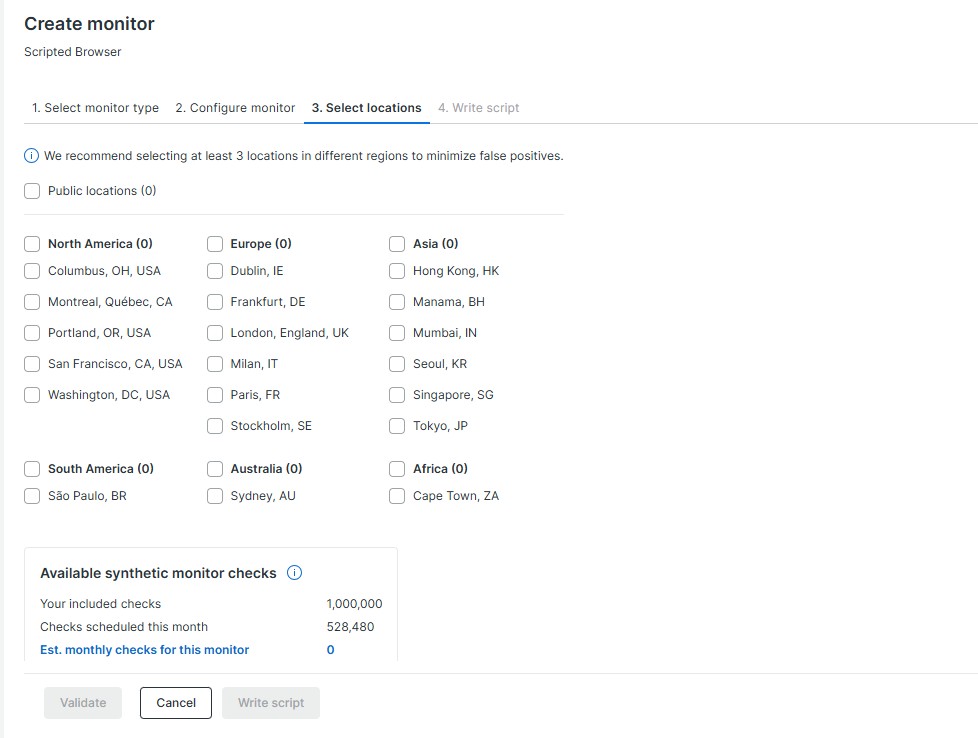
5. Organizing Monitors and Schedules
To maximize efficiency and avoid overlapping runs:
Example setup:
| Monitor Group | Type | Frequency | Regions |
|---|
| Core API | API | Every 1 min | US, EU |
| Frontend Flows | Scripted Browser | Every 3 min | Asia, EU |
| Upload Pipeline | API + Browser | Every 5 min | US East, APAC |
Best practices:
- Stagger monitor schedules to reduce false positives.
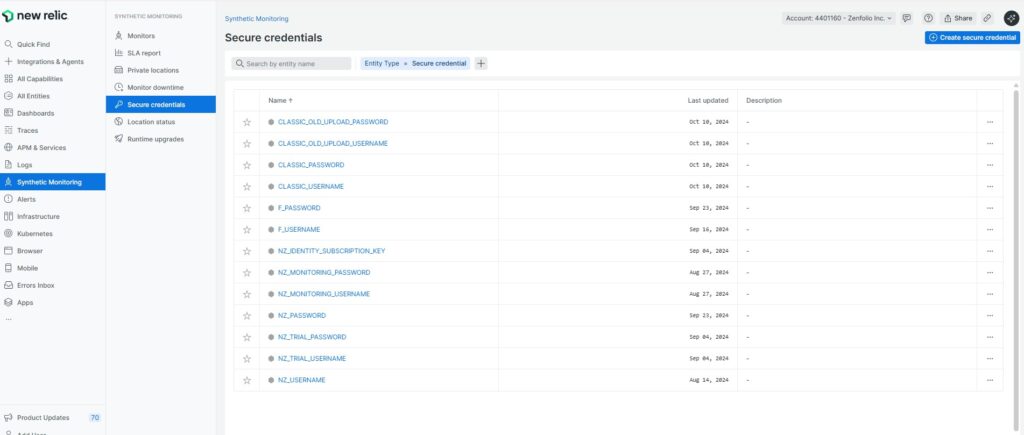
- Use labels/tags for each client or service.
- Separate alert policies per group (API vs frontend).
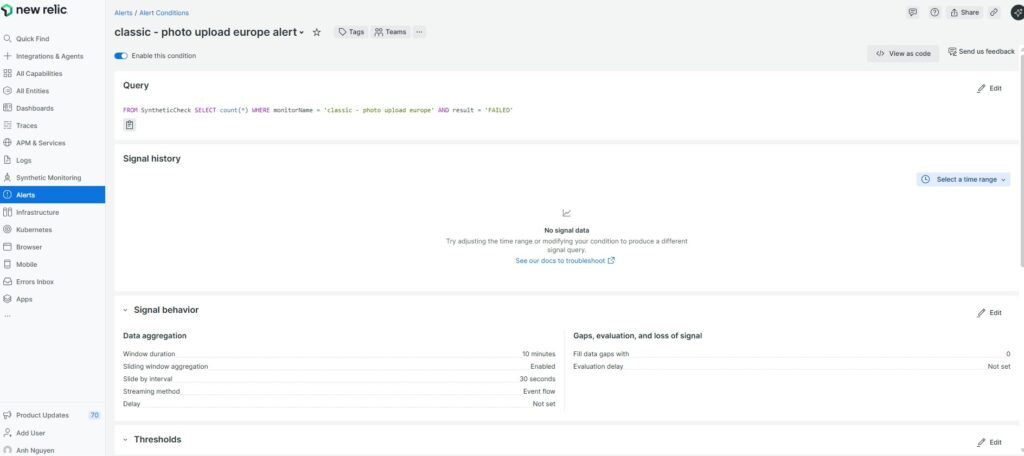
6. Setting Up Alerts with NRQL
New Relic uses NRQL (New Relic Query Language) for advanced alert conditions.
Example: Alert when an API latency exceeds 2 seconds for 3 consecutive checks.
Example using Checkly CLI (checkly-cli):
SELECT average(duration)
FROM SyntheticCheck
WHERE monitorName = 'Production API Health'
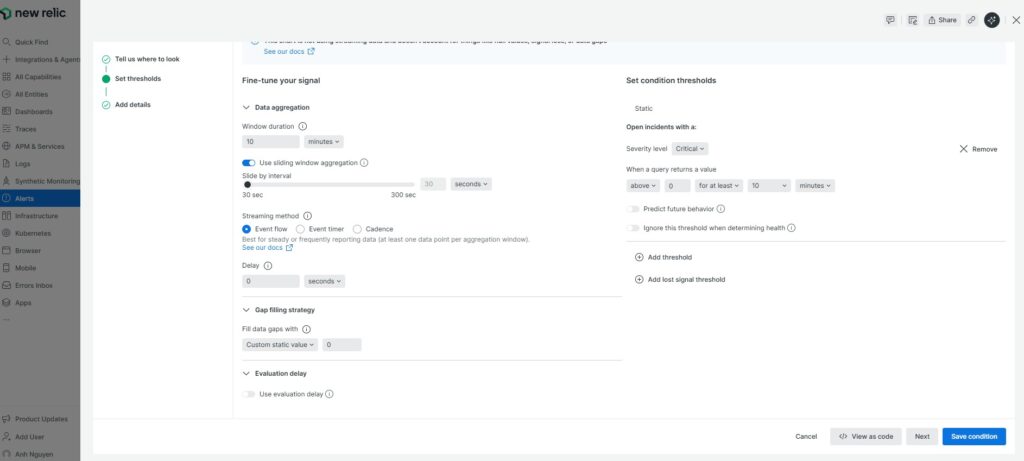
FACET locationLabelAlert condition example:
Incident Preference: Per Condition
Threshold: average duration > 2000 ms for 3 out of 5 minutes
Notification Channels: Slack, PagerDuty, Email
7. Integrating New Relic into CI/CD Pipelines
For continuous validation, you can trigger synthetic checks automatically after each deployment.
Example of defining environment variables:
name: Run New Relic Synthetic Check
on:
  deployment:
    types: [created]

jobs:
  trigger-synthetics:
    runs-on: ubuntu-latest
    steps:
      - name: Call New Relic API
        run: |
          curl -X POST \
          -H "Api-Key: ${{ secrets.NEW_RELIC_API_KEY }}" \
          -H "Content-Type: application/json" \
          https://synthetics.newrelic.com/synthetics/api/v3/monitors/<MONITOR_ID>/run
This setup ensures each new release is immediately tested in production, closing the feedback loop between CI/CD and observability.
8. Advanced Use Cases
For outsourcing and large engineering teams, New Relic Synthetics scales efficiently:
- Multi-Environment Validation: Run the same script against staging, UAT, and prod using variables.
- Custom Dashboards: Combine Synthetic, APM, and Error data in one view.
- AI-Assisted Anomaly Detection: Use New Relic’s Applied Intelligence to detect unusual behavior automatically.
- Integrations with External Systems: Forward alert payloads to Slack, Teams, Grafana, or custom webhooks.
- Private Locations: Run checks behind firewalls (ideal for client-specific networks).
9. Pros and Cons of Using New Relic for Production Testing
| Pros | Cons |
|---|---|
| Unified observability (APM + Synthetics + Logs) | Learning curve for NRQL and scripting |
| Highly reliable global infrastructure | Limited scripted monitor quota on free plan |
| Strong alerting and visualization | Pricing can rise with large-scale use |
| Excellent integration ecosystem | Less flexibility in browser script customization |
| AI-powered anomaly detection | Requires agent setup for full APM insight |
10. Best Practices
- Tag and label everything: Helps trace which client/service each monitor covers.
- Use baseline thresholds: Avoid alert noise by setting realistic SLA targets.
- Run multi-region tests: Identify latency variations geographically.
- Combine APM + Synthetic: Correlate backend metrics with user-facing results.
- Review weekly trends: Use dashboards to identify slow degradation or recurrent errors.
11. Conclusion
Testing in production with New Relic isn’t just about checking uptime — it’s about measuring experience.
By combining APM, Synthetics, and intelligent alerting, engineering teams gain full visibility into how production truly behaves under real-world conditions.
For outsourcing or multi-stack teams, it delivers three crucial advantages:
- Proactive detection before clients notice issues.
- Unified dashboards across projects and environments.
- Confidence to deploy faster without sacrificing reliability.
If your team already uses New Relic for monitoring, enabling Synthetic Testing is the next logical step toward complete observability.