


Overview
Before AI and MCP entered the picture, every performance test I ran against a project API started the same way: open JMeter’s desktop UI and manually design a Test Plan from scratch, thread groups, samplers, assertions, listeners, for whatever endpoint I was testing that day. Run it, wait, open the report, hunt for the one endpoint dragging my p95 up, write the findings up by hand. None of it is hard. It’s just slow, repetitive work that eats an afternoon before you get to a real answer.
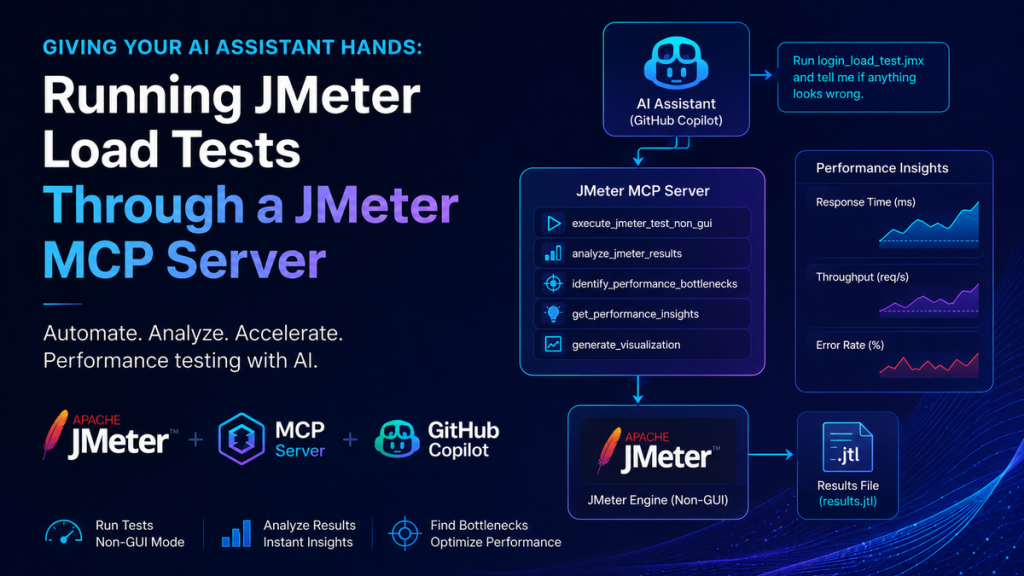
In 2026, that loop finally has a shortcut. jmeter-mcp-server, an open-source project, wires Apache JMeter into your AI coding assistant through the Model Context Protocol (MCP), so instead of clicking through the JMeter GUI, you can say “run the login load test and tell me if anything looks wrong,” and the assistant just does it. I set this up with GitHub Copilot, since that’s what we’re standardizing on, but the same server works unmodified with Claude, Cursor, Codex, or anything else that speaks MCP, which turns out to matter more than I expected.
What MCP actually changes here
MCP is an open standard for letting an AI assistant call real tools, not just talk about them. Instead of pasting JMeter output into a chat and asking the model to eyeball it, an MCP server gives the assistant tools it can invoke directly: run this test plan, parse this results file, find the slow endpoints. It gets structured data back instead of raw text to guess at.
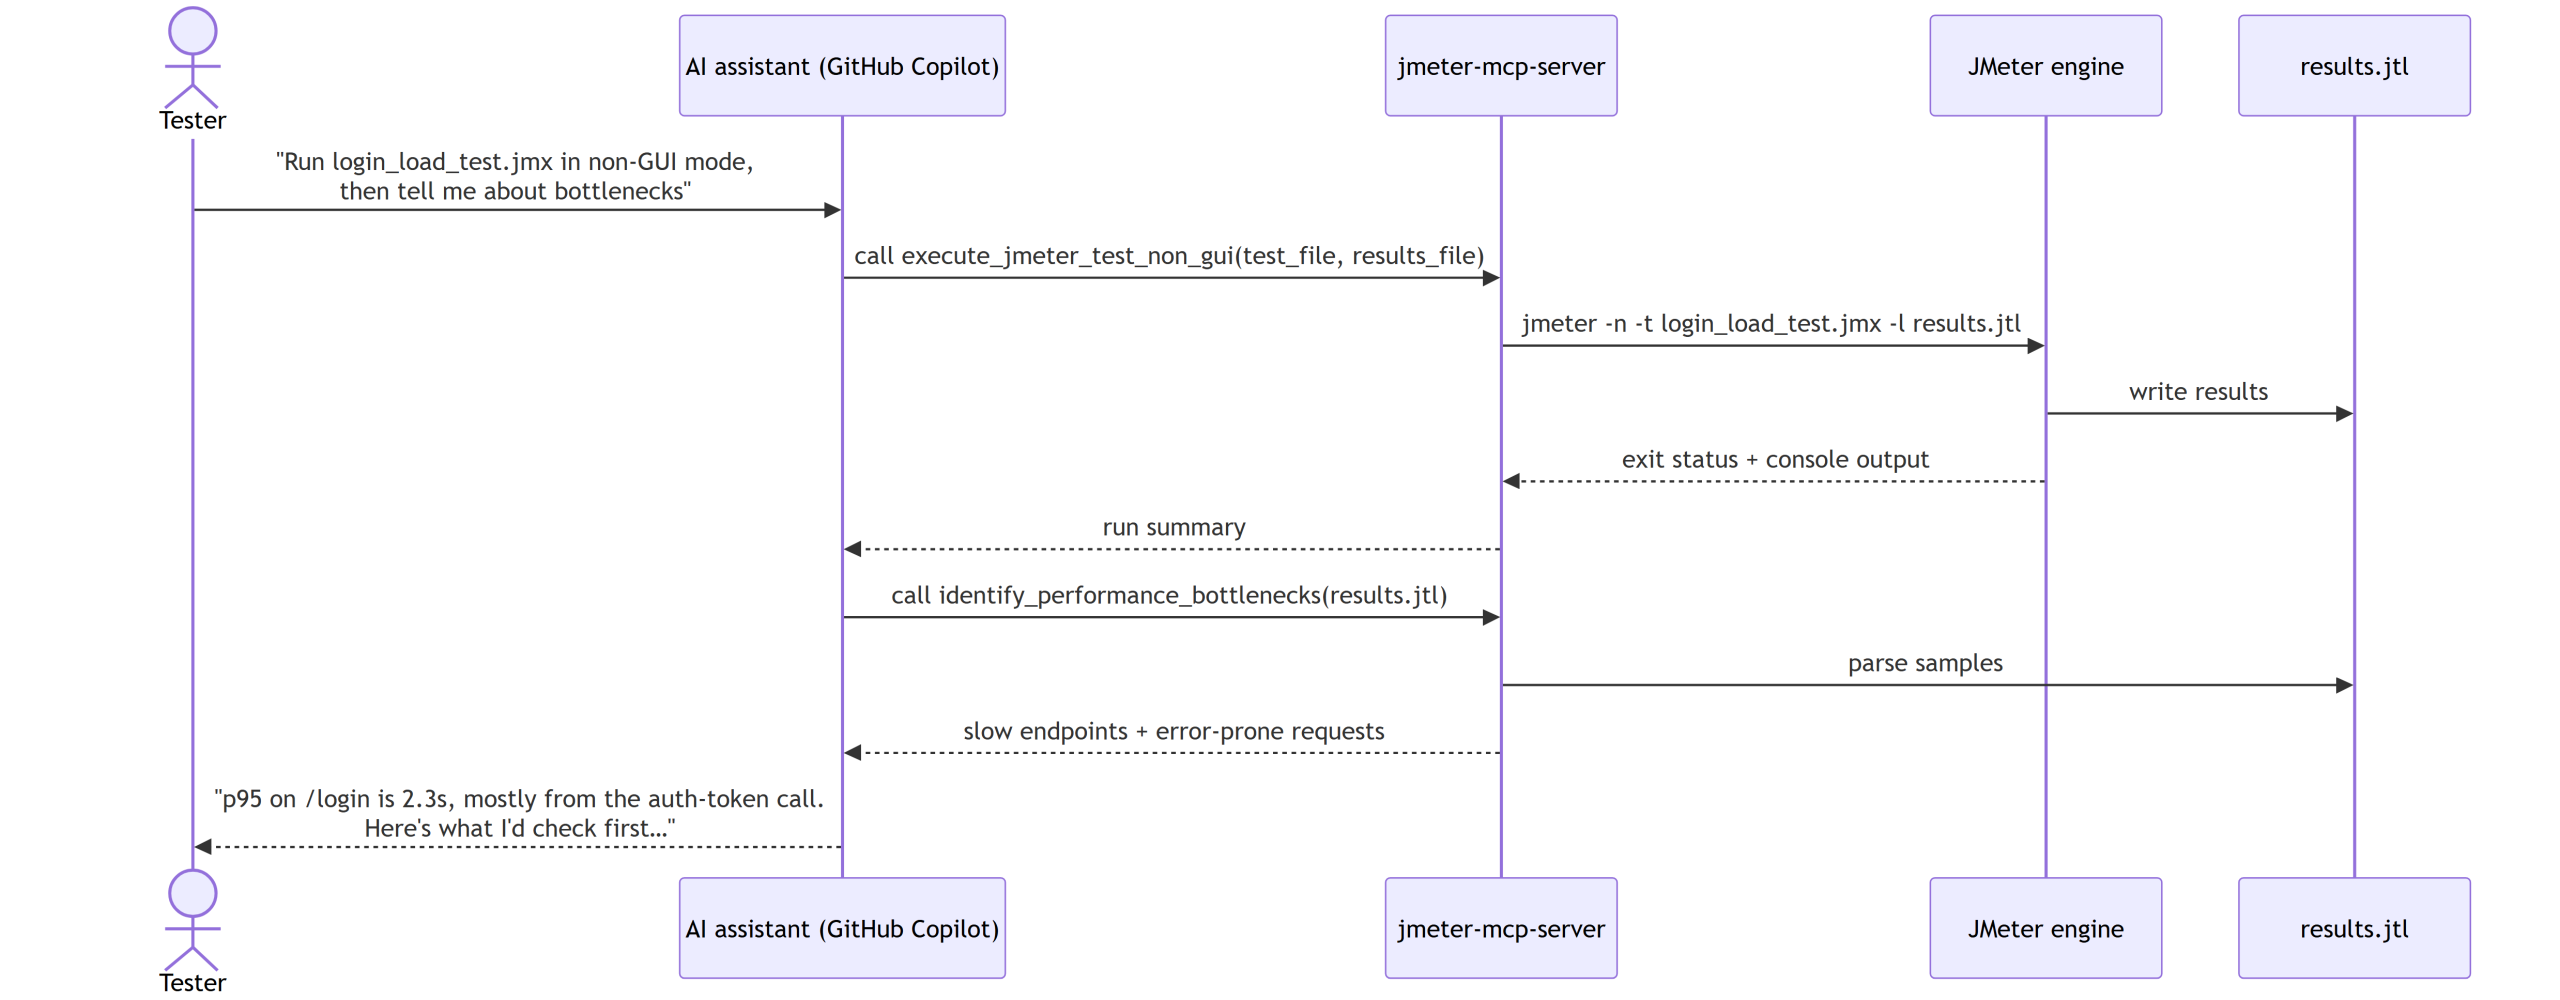
A full round trip, prompt to answer, looks like this:
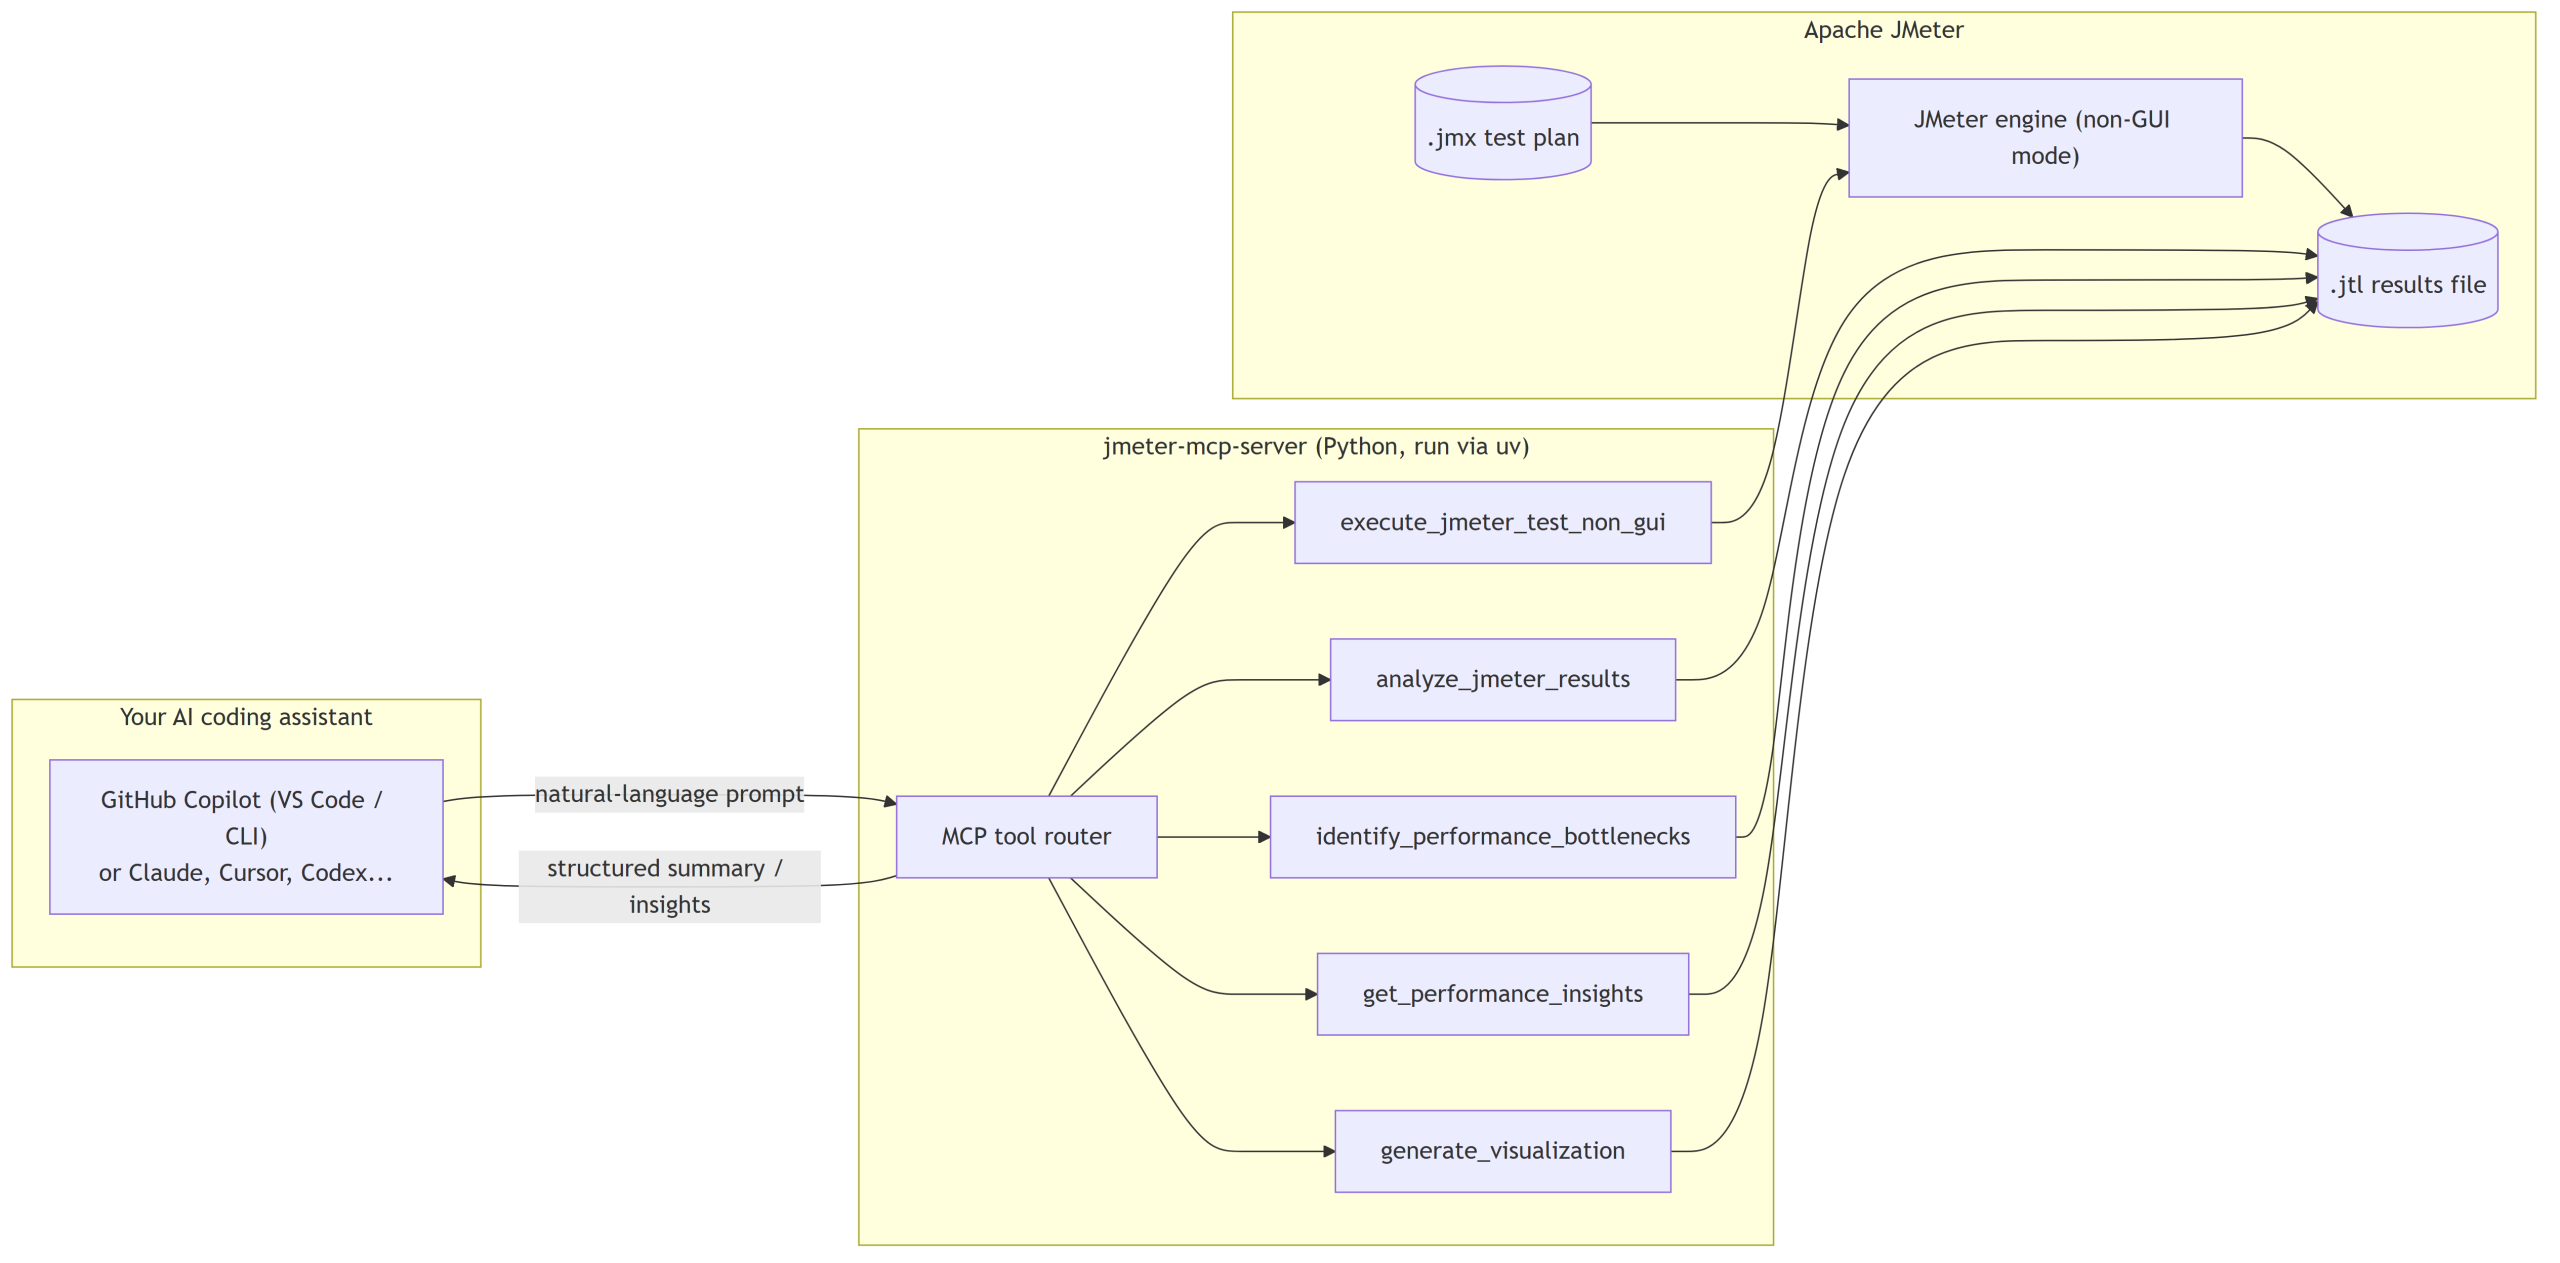
A full round trip, prompt to answer, looks like this:
Setting it up with GitHub Copilot
You need JMeter installed, uv, and VS Code with Copilot Chat in Agent mode: MCP tools don’t show up in Ask mode.
- Clone it and install: git clone https://github.com/QAInsights/jmeter-mcp-server.git, then uv sync inside the folder.
- Add a .env pointing at your JMeter install (JMETER_HOME, JMETER_BIN).
- Register it in VS Code: .vscode/mcp.json, root key servers (Claude Desktop uses mcpServers instead), command/args pointing uv at jmeter_server.py.
- Switch Copilot Chat to Agent mode, open Configure Tools, and enable the jmeter server’s 6 tools (off by default).
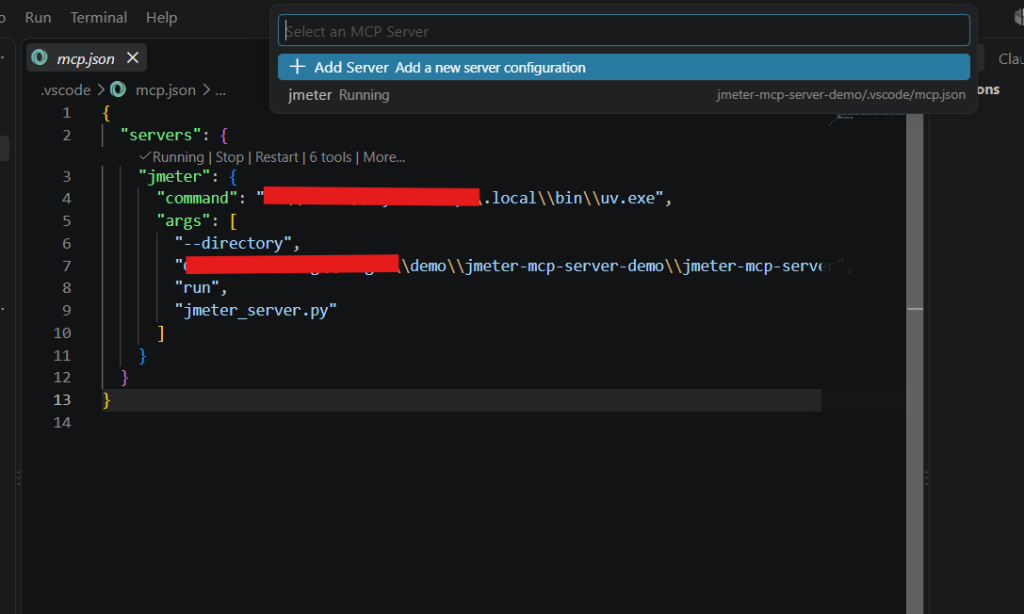
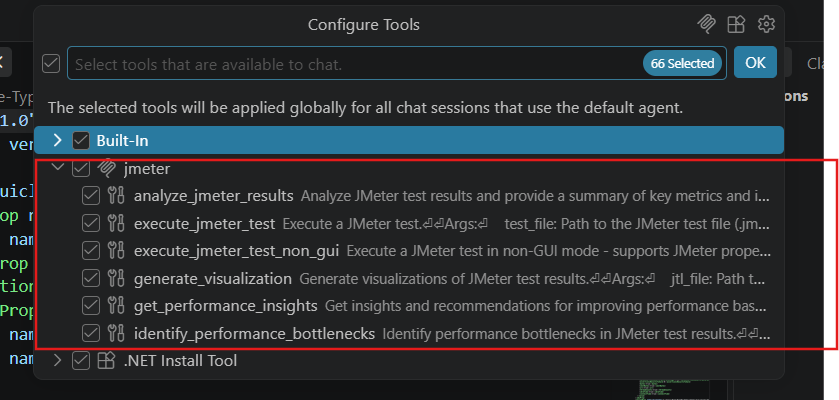
This setup is Copilot-specific only in where the config lives. Claude Desktop, Cursor, and Copilot/Codex CLI all register the same command/args shape, just under different file paths. Set it up once; whichever assistant your team standardizes on next carries it over.
What the assistant can actually do
| Tool | What it does | Example prompt |
| execute_jmeter_test_non_gui | Runs a .jmx test plan headlessly and writes results to a .jtl file | “Run sample_test.jmx in non-GUI mode and save results to results.jtl” |
| execute_jmeter_test | Opens the test plan in JMeter’s GUI (for editing, not execution) | “Open sample_test.jmx in the JMeter GUI so I can look at it” |
| analyze_jmeter_results | Summarizes key metrics (throughput, error rate, response times) from a JTL file | “Analyze the results in results.jtl and give me the headline numbers” |
| identify_performance_bottlenecks | Flags slow or error-prone requests | “What are the performance bottlenecks in results.jtl?” |
| get_performance_insights | Turns raw metrics into plain-language recommendations | “What should we fix first based on this run?” |
| generate_visualization | Builds response-time/throughput charts from the results | “Create a time series graph of response times from results.jtl” |
Observing Copilot run the JMeter test plan through the MCP server
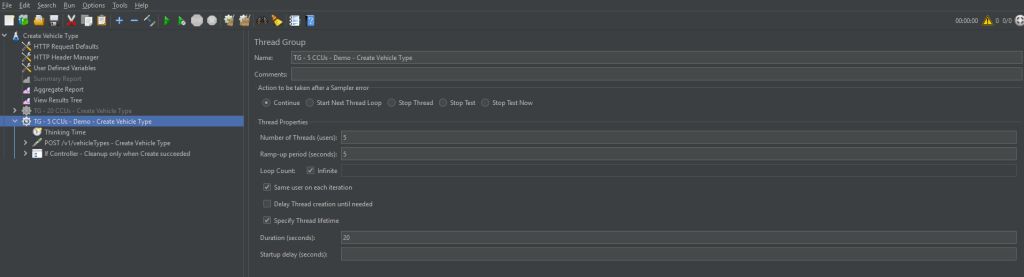
For the demo, I picked a concrete example: the Create Vehicle Type API endpoint. It’s a test plan I’d already designed by hand for one of our projects, but this time, instead of running it manually like before, I let jmeter-mcp-server run it, analyze the results, and report back. One sentence in Agent mode:
“Run Create-Vehicle-Type.jmx in non-GUI mode, save results to results/live-demo.jtl, then analyze the results and tell me results summary and there are any bottlenecks.”
Behind that one prompt, Copilot worked through three of jmeter-mcp-server’s six tools: execute_jmeter_test_non_gui to run the test plan, analyze_jmeter_results to parse the JTL it produced, and identify_performance_bottlenecks to flag the slow request.

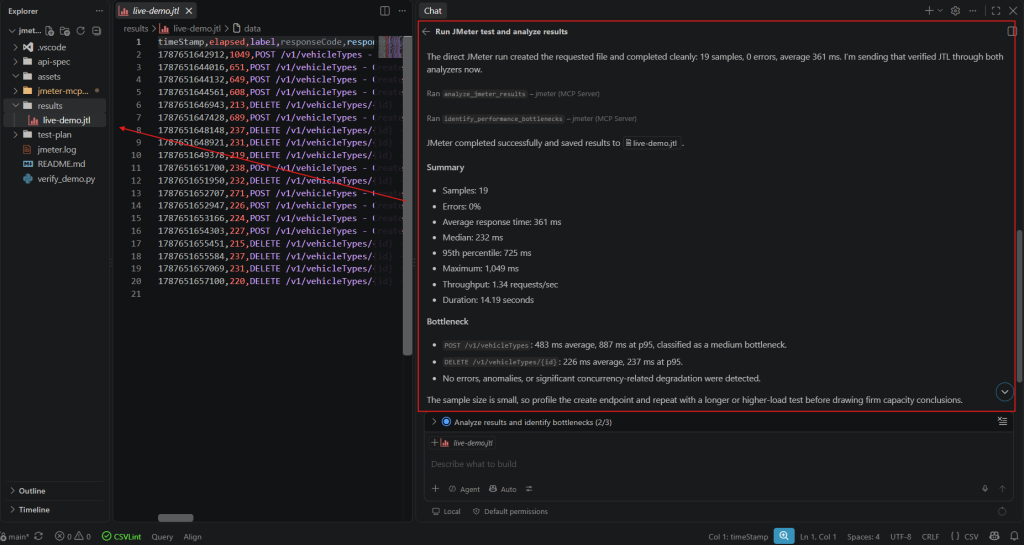
What came back was a complete summary: 22 samples, 0% errors, averages and percentiles already worked out, the slow endpoint flagged by name, and a caveat that a 5-user, 20-second run is too small a sample to draw real capacity conclusions from. That’s the read I’d normally build myself after squinting at a report for ten minutes, done before I finished reading the answer.
Before vs. after: manual JMeter vs. MCP-driven testing
| Step | Manual JMeter workflow | MCP-driven workflow |
| Kick off a run | Open GUI or type the CLI command yourself | “Run the login load test” |
| Watch for completion | Tab back periodically, check the terminal | Assistant reports back when done |
| Read results | Open results.jtl or the HTML dashboard, scan manually | Assistant summarizes throughput/errors/response times |
| Spot bottlenecks | Sort tables, eyeball p95/p99 columns yourself | Assistant flags the slow/error-prone requests directly |
| Write up findings | Manually compose a summary for the team | Assistant’s summary is already in plain language |
Designing an agentic performance-testing workflow
This is really where I think this goes for day-to-day project work, beyond just running a test plan that already exists. On a real project, the starting point for a new endpoint is a spec, a user story or an API contract, not a .jmx file. Copilot can already read that spec and write files; jmeter-mcp-server can already run and analyze whatever it writes. Chain the two together and you get a small end-to-end workflow for performance testing a new CRUD endpoint, not just a faster way to run an old one:

Noting that the drafting step isn’t an MCP tool. jmeter-mcp-server has no create_test_plan tool, it only executes and analyzes. Copilot is doing two different jobs back to back here, and the generated .jmx deserves the same review as any AI-written code before you run it against something real: thread counts, assertions, and especially the cleanup logic.
Take it one step further and this stops being a one-off prompt: standardize the spec-to-report flow above as a proper skill in your project’s own Copilot workflow harness templates, so any test engineer on the team can trigger the same reviewed process instead of reinventing the prompt each time.
Conclusion
What I’m actually planning to do with this is fold it straight into our project’s Copilot harness template: register jmeter-mcp-server alongside whatever other MCP tools the team already relies on, and turn “run this test plan and tell me what’s wrong” into a real, repeatable step in our performance-testing workflow, not something I wire up by hand every time I need it. If you’re trying this yourself, start small: point it at a disposable test plan against staging, then decide whether it earns a permanent spot in the template for the rest of the team.
And because the same server runs fine with Claude, Cursor, or Codex, this isn’t really a bet on Copilot specifically. It’s a bet on having this step in the workflow at all, whichever assistant your team ends up standardizing on next.