


Introduction
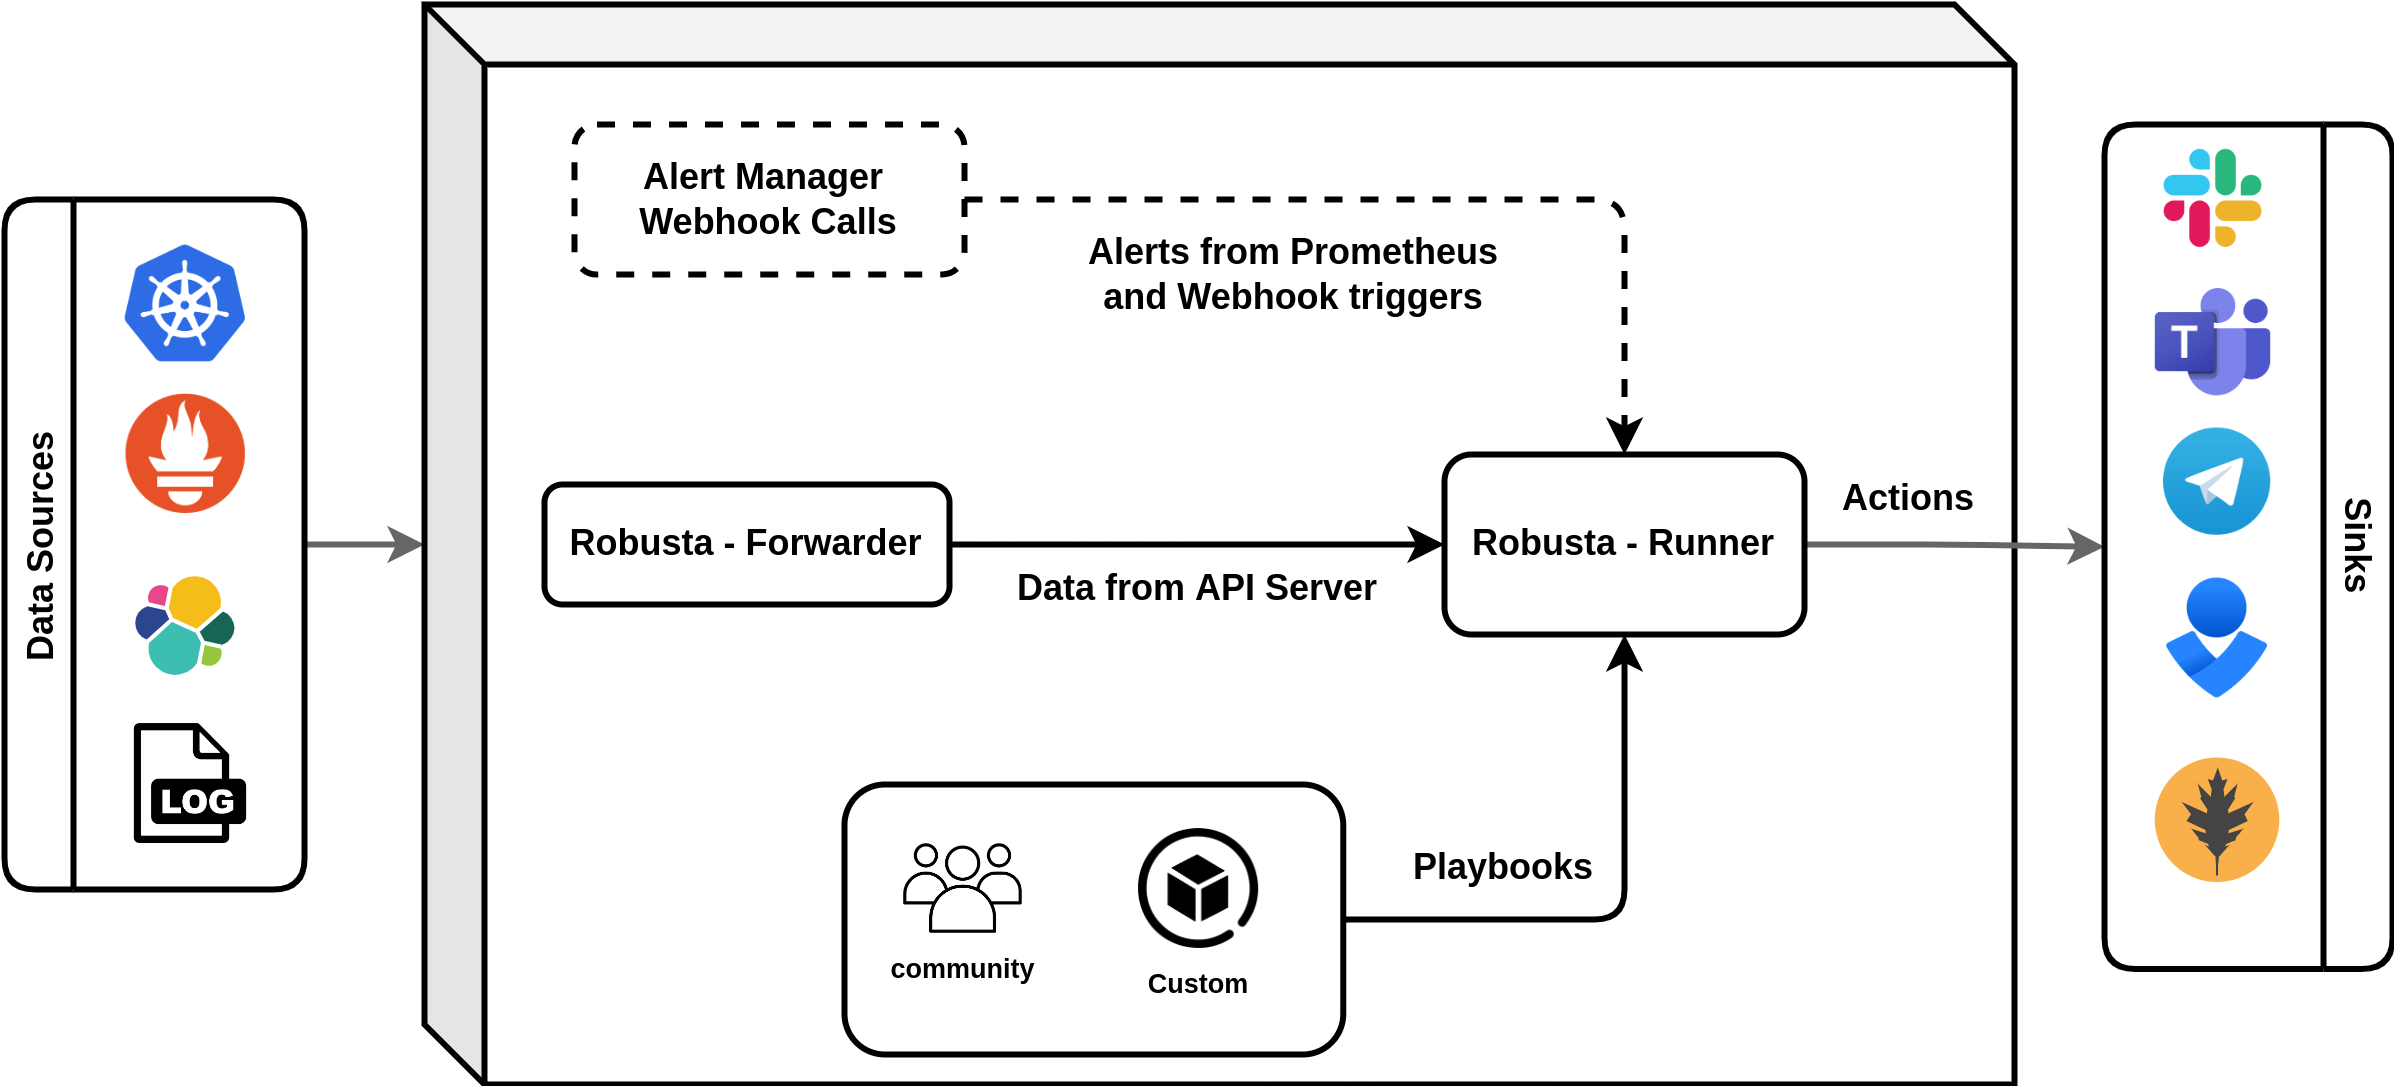
Robusta is an open source observability tool for Kubernetes, which extends Prometheus. Using automation rules, So Robusta automatically fetches the data you need to investigate, and attaches it to your alerts. Robusta is used in production by hundreds of teams. It monitors infrastructure for Fortune 500 companies, MSPs, and startups. It can install everything you need to monitor Kubernetes from scratch, or it can be added to an existing Prometheus.
What is Robusta?
Robusta is more than just a Prometheus extension; it’s a full-fledged observability platform designed specifically for Kubernetes. It seamlessly integrates with Prometheus, automatically fetching data to investigate alerts and attaching it directly to them. So This eliminates the need for manual data gathering, streamlining the incident response process.
Key Features of Robusta:
- Automated Data Fetching: Robusta automatically fetches relevant data for investigations, saving you time and effort. So no more manually scraping logs or metrics!
- Batteries-Included Alerts and Automations: Robusta comes pre-packaged with a set of sensible alerts and automations, helping you proactively identify and address potential issues.
- Granular Alert Routing: Route alerts based on namespace, team, and severity to ensure the right people are notified at the right time.
- Notifications for Rollouts and Changes: Stay informed about deployments and changes with automated notifications, so reducing the risk of regressions or incidents.
- Custom Alert Remediation: Take control of incident response with custom commands triggered by specific alerts.
Get Started with Robusta:
Getting Started with Robusta
Deploying Robusta is a breeze. It can be installed using Helm charts or manifests and integrates seamlessly with your existing Prometheus setup. The Robusta documentation provides detailed instructions and configuration options to get you up and running quickly.
Robusta can be installed three ways:
- Monitor Kubernetes from Scratch (recommended, includes Robusta + Prometheus)
- Integrate with Existing Prometheus (or a Prometheus compatible metrics-store)
- Barebones Installation (no Prometheus at all)
Monitor Kubernetes from scratch:
Prerequisites:
- A Supported K8s Cluster (All Distributions are supported except Minikube)
- Helm
- A sink (Slack, Teams etc for alerts)
Step 1: Generate Config for Robusta Installation:
Robusta needs settings to work. For example, if you use Slack then Robusta needs a Slack API key. These settings are configured as Helm values. We can use the robusta cli tool to generate the Helm values. You can install the cli with pip or run it inside a prebuilt container.
pip install -U robusta-cli --no-cache
robusta gen-config --enable-prometheus-stack
This interactive process asks you various questions about your desired setup, including cluster name and storage options. Follow the prompts carefully, choosing settings that suit your needs. Now you should have a generated_values.yaml file with a Robusta config. Save this file! We’ll use it to install Robusta on new clusters. This generated_values.yaml file contains sensitive values. We can manage these Secrets with K8s secret.
Step 2: Add the Robusta Helm Repository:
Open a terminal and run the following command to add Robusta’s Helm repository:
helm repo add robusta https://robusta-charts.storage.googleapis.comSo This adds the repository where Robusta’s Helm charts reside, making them easily installable. Once the repository is added, update its information using ‘‘helm repo update”. This ensures you have the latest versions of Robusta charts available.
Step 3: Install Robusta in Cluster:
helm install robusta robusta/robusta -f ./generated_values.yaml --set clusterName=<YOUR_CLUSTER_NAME>Use the above command so to install robusta into our cluster. Replace <YOUR_CLUSTER_NAME> with your cluster name. This will install robusta into our cluster.
Step 4: Verify Robusta Deployment:
Run the following command to check if Robusta is up and running:
kubectl get pods -A -n <your_namespace>
robusta logs
So above commands looks for pods with names like robusta-operator and robusta-ui in a “Running” state. We can see if the installation is successful.
Step 5: Access the Robusta UI:
Open the address displayed by kubectl get service robusta-ui -n <your_namespace> (replace <your_namespace> with the actual namespace) in your web browser. This opens the Robusta user interface, So we can monitor your cluster’s health and configure alerts.
Congratulations! So now we’ve successfully set up Robusta from scratch and are now ready for comprehensive Kubernetes monitoring. In addition to the monitoring Robusta will send alerts to the sink (slack, teams etc) of any pod crash or any error.
Step 6: See Robusta in action:
Let’s Deploy a crashing pod:
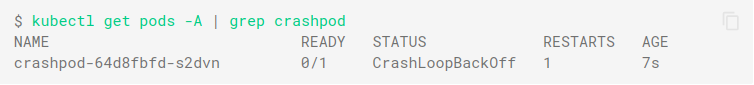
kubectl apply -f https://gist.githubusercontent.com/robusta-lab/283609047306dc1f05cf59806ade30b6/rawLet’s Verify if the pod is crashing:
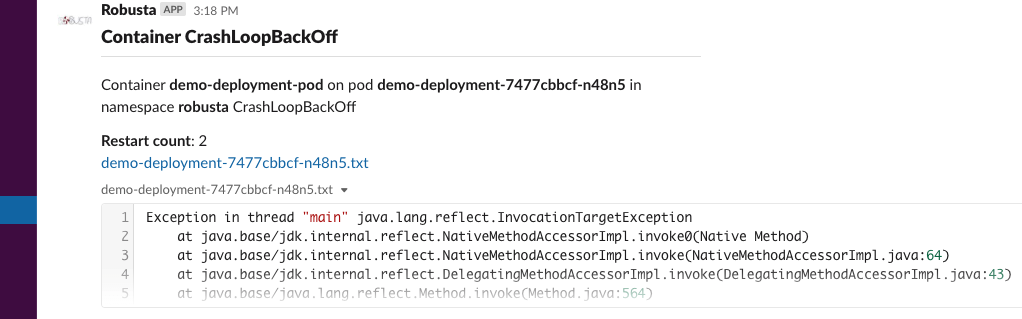
Once the pod restarts twice, you’ll get notified in your configured sink. In my case I’ve configured it using Slack API, So I’m getting notified in my Slack.
Conclusion
Robusta is a customizable and powerful tool. Experiment, explore, and tailor it to your specific needs to elevate your Kubernetes observability to new heights.
Happy monitoring!
Additional Resources:
- Robusta Documentation: https://docs.robusta.dev/master/
- Robusta Tutorials: https://docs.robusta.dev/master/
- Robusta Quick Start: https://docs.robusta.dev/master/