


Introduction
Splunk is a versatile and comprehensive observability tool designed to collect, analyze, and visualize machine-generated data. It caters to the growing demand for actionable insights in real-time, making it an invaluable asset for IT professionals, DevOps teams, and businesses aiming to enhance their operational efficiency.
This journey through the world of Splunk begins by understanding its evolution—from a log management tool to a full-fledged observability platform. We delve into the historical context, showcasing how It has adapted to the changing needs of the industry, incorporating new features and capabilities to stay ahead in the fast-paced world of IT.
Features of Splunk Monitoring Tool:
1. Data Ingestion and Parsing:
- Splunk’s ability to efficiently ingest and parse data from various sources is a key strength.
- Support for numerous data formats ensures compatibility with different environments.
2. Search and Analysis:
- The real-time search processing language (SPL) allows users to query and analyze data instantaneously.
- Complex searches enable the identification of patterns, anomalies, and trends within large datasets.
3. Visualization and Dashboards:
- Splunk’s visualization tools facilitate the creation of intuitive and customizable dashboards.
- Graphs, charts, and maps provide a clear and comprehensive view of system performance.
4. Alerting and Monitoring:
- Splunk’s alerting mechanisms enable proactive monitoring of systems.
- Customizable alerts can be set up to notify users of critical events and potential issues.
Types of Splunk Monitoring Tools and Software:
Splunk offers three main solutions, each suited for different needs and preferences:
1. Splunk Cloud Platform:
- Ideal for: Those who want the benefits of Splunk without managing their own infrastructure.
- Key features: Secure, reliable, and scalable cloud service, easy to set up and use.
- Pricing: Free 14-day trial, then paid subscriptions starting at $99 per user per month.
- Strengths: Fast deployment, no infrastructure management, automatic updates.
- Considerations: Less control over the environment, potential latency issues.
2. Splunk Enterprise:
- Ideal for: Organizations with specific infrastructure requirements or needing complete control over their data.
- Key features: On-premises deployment, powerful data analysis capabilities, flexible customization.
- Pricing: Free 60-day trial, then perpetual licenses priced based on data volume and features.
- Strengths: High degree of control and customization, flexible deployment options.
- Considerations: Requires managing your own infrastructure, ongoing maintenance and updates.
3. Splunk Observability Cloud:
- Ideal for: Teams focused on monitoring and optimizing application performance and user experience.
- Key features: Cloud-based observability platform with metrics, logs, and traces analysis.
- Pricing: Free 14-day trial, then paid subscriptions starting at $49 per user per month.
- Strengths: Specifically designed for observability, AI-powered insights, easy integration with DevOps tools.
- Considerations: May not offer all the features of Cloud Platform or Enterprise.
Demo: Integrating Splunk Observability Cloud with AKS
The aim of this demonstration is to showcase the robust capabilities of Splunk Observability Cloud in monitoring and deriving actionable insights from Azure Kubernetes Services (AKS). This document serves as a comprehensive guide, detailing the steps involved in setting up monitoring for AKS using Splunk Observability Cloud.
Prerequisites:
- Provisioned and accessible Azure Kubernetes Service (AKS) cluster.
- Access to the Observability Cloud platform.
Steps to Set Up Monitoring:
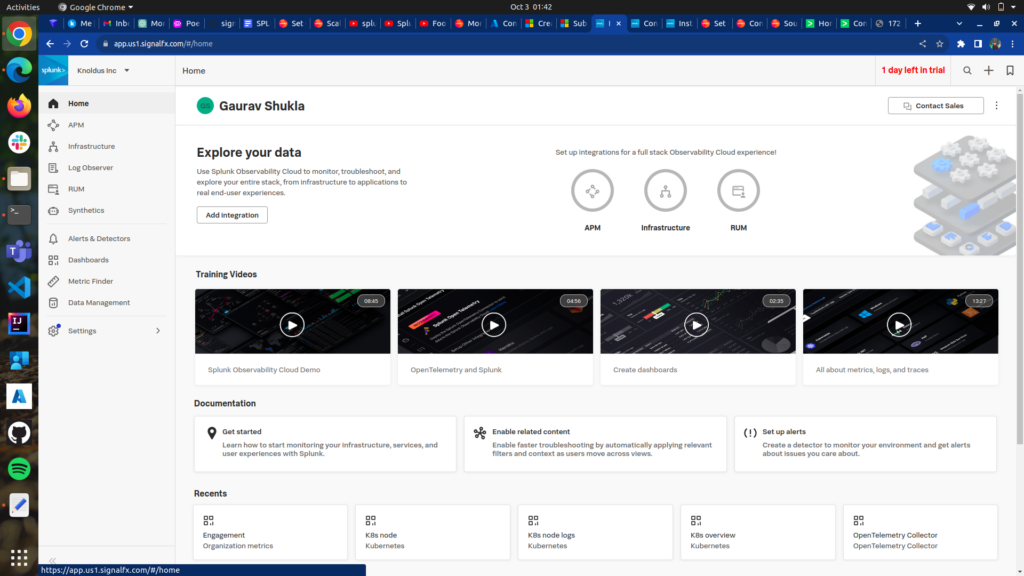
- Access the Observability Cloud Dashboard:
- Log in to the Splunk Observability Cloud dashboard using your newly created account credentials.
- Deploy Splunk OpenTelemetry Collector for Kubernetes (Azure Kubernetes Service):
- Utilize the Splunk OpenTelemetry Collector for Kubernetes Helm chart to streamline the process.
- This Helm chart, designed for the Splunk Distribution of OpenTelemetry Collector, creates a Kubernetes DaemonSet and other objects to receive, process, and export metric, trace, and log data.
- Prerequisites:
- Helm 3 (Helm 2 is not supported)
- Administrator access to your Kubernetes cluster with familiarity of the Kubernetes configuration.
- To send data to Splunk Observability Cloud:
- Splunk Observability Cloud:
- Splunk Access Token
- Splunk Realm
- Installation involves configuring parameters based on the destination (splunkPlatform or ObservabilityCloud).
- For Splunk Observability Cloud:
splunkObservability.realm: Splunk realm to send telemetry data.splunkObservability.accessToken: Your Splunk Observability org access token.
- Splunk Observability Cloud:
- Connect to the AKS Cluster and run the following commands, replacing parameters with appropriate values.
# Add Helm repo
helm repo add splunk-otel-collector-chart https://signalfx.github.io/splunk-otel-collector-chart

# Sending data to Splunk Observability Cloud
helm install my-splunk-otel-collector --set="splunkObservability.realm=us0,splunkObservability.accessToken=xxxxxx,clusterName=my-cluster" splunk-otel-collector-chart/splunk-otel-collector

# Sending data to Splunk Enterprise or Splunk Cloud
helm install my-splunk-otel-collector --set="splunkPlatform.endpoint=https://127.0.0.1:8088/services/collector,splunkPlatform.token=xxxxxx,splunkPlatform.metricsIndex=k8s-metrics,splunkPlatform.index=main,clusterName=my-cluster" splunk-otel-collector-chart/splunk-otel-collector
NOTE: Replace Access Token with generated ACTs on Splunk Enterprise and Observability Cloud.
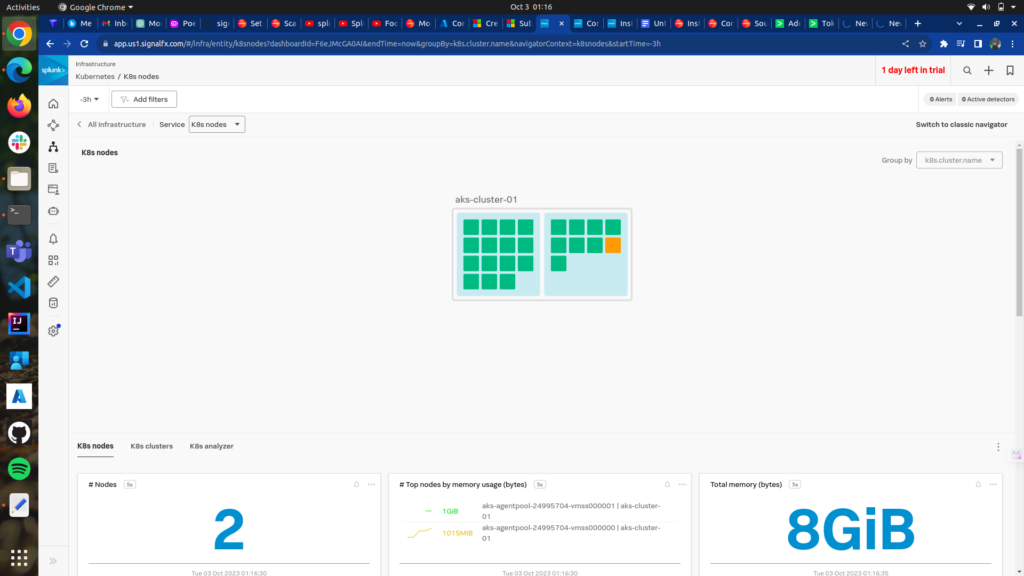
Create Dashboard and Alerts:
In the Observability Cloud dashboard, navigate to the “Infrastructure Monitoring” section. Create custom dashboards based on the specific metrics and log events you want to monitor. Include visualizations and charts for a comprehensive overview. Set up alerts to receive notifications when specific conditions or thresholds are met. This proactive approach ensures timely issue resolution.
So, by following these steps, We can seamlessly integrate Observability Cloud with their AKS environment, unlocking powerful monitoring and analytical capabilities for enhanced operational efficiency.
Conclusion:
This integration not only streamlines the process of data collection but also enables users to leverage the full potential of Splunk’s monitoring capabilities. The Observability Cloud dashboard, with its intuitive interface, provides a centralized hub for visualizing key metrics and log events, fostering a deeper understanding of the AKS environment. this demo showcases how the seamless integration of Observability Cloud with AKS empowers organizations to monitor, analyze, and optimize their Kubernetes-based applications with ease. The result is a unified and insightful observability solution that enhances decision-making, accelerates issue resolution, and contributes to the overall success of IT operations in a dynamic and ever-evolving landscape.