


What is OpenTelemetry?
OpenTelemetry provides a collection of tools, APIs, and libraries to instrument applications for gathering telemetry data. It standardizes the generation, collection, and exportation of telemetry data from various sources, facilitating the analysis and understanding of your applications’ behavior.
It supports multiple programming languages, including .NET, and integrates with various telemetry backends, such as Azure Monitor, Prometheus, Jaeger, and more.
Signals in OpenTelemetry
OpenTelemetry collects different types of telemetry data, known as signals, from your applications. The three main types of signals are:
- Traces
- Metrics
- Logs
Traces
Traces represent the flow of an operation or request through your application. They provide detailed information about the execution path, including timing, duration, and metadata associated with each step. Traces help understand the performance of individual requests and identify bottlenecks or issues in your application’s behavior.
Metrics
Metrics represent the state or behavior of your application over time through numerical measurements. Examples of metrics include the number of requests per second, response times, error rates, and memory usage. Metrics are collected at regular intervals to monitor, alert, and identify trends or patterns in your application’s behavior.
Logs
They are textual records of events or messages generated by your application, including diagnostic information, error messages, or other relevant data. Logs provide context and insights when analyzed alongside traces and metrics.
Handling Signals with OpenTelemetry
OpenTelemetry standardizes the collection and exportation of these signals from your applications. Instrumenting your code with Open-Telemetry generates traces, metrics, and logs that conform to a common data model.
Tracing in Action
When a user makes a request to your web application, Open Telemetry automatically generates a trace that captures the entire request lifecycle, including any downstream calls to other services or databases.
Metrics Collection
Simultaneously, Open-Telemetry collects metrics related to the request, such as the response time.
Logging with OpenTelemetry
Open-Telemetry also emits log messages to provide additional context or diagnostic information.
Analyzing Signals for Better Insights
Collecting and analyzing these signals provides insights into the performance, reliability, and behavior of your applications. This analysis enables informed decisions about optimizations, troubleshooting, and capacity planning.
Open-Telemetry simplifies the collection and exportation of telemetry data, making it easier to analyze and correlate the data across different systems and components.
How to add OpenTelemetery support in Asp.Net Applications?
1. Install OpenTelemetry.Extensions.Hosting and package
2. Open Program.cs and add following line to add OpenTelemetry
builder.Services.AddOpenTelemetry();
builder.Logging.AddOpenTelemetry();
3. Install OpenTelemetry.Instrumentation.AspNetCore and OpenTelemetry.Instrumentation.Runtime packages
4. Configure Tracing and Metrics with following code:
builder.Services.AddOpenTelemetry()
    .WithTracing(tracing =>
    {
      tracing.AddAspNetCoreInstrumentation();
    })
    .WithMetrics(metrics =>
    {
      metrics.AddAspNetCoreInstrumentation()
      .AddRuntimeInstrumentation();
    })
    .UseOtlpExporter();
5. Install OpenTelemetry.Exporter.Console package to see the output and updat the Program.cs as following
builder.Services.AddOpenTelemetry()
    .WithTracing(tracing =>
    {
      tracing.AddAspNetCoreInstrumentation();
      tracing.AddConsoleExporter();
    })
    .WithMetrics(metrics =>
    {
      metrics.AddAspNetCoreInstrumentation()
     .AddRuntimeInstrumentation()
     .AddConsoleExporter();
    });

builder.Logging.AddOpenTelemetry(logging =>
{
  logging.AddConsoleExporter();
});
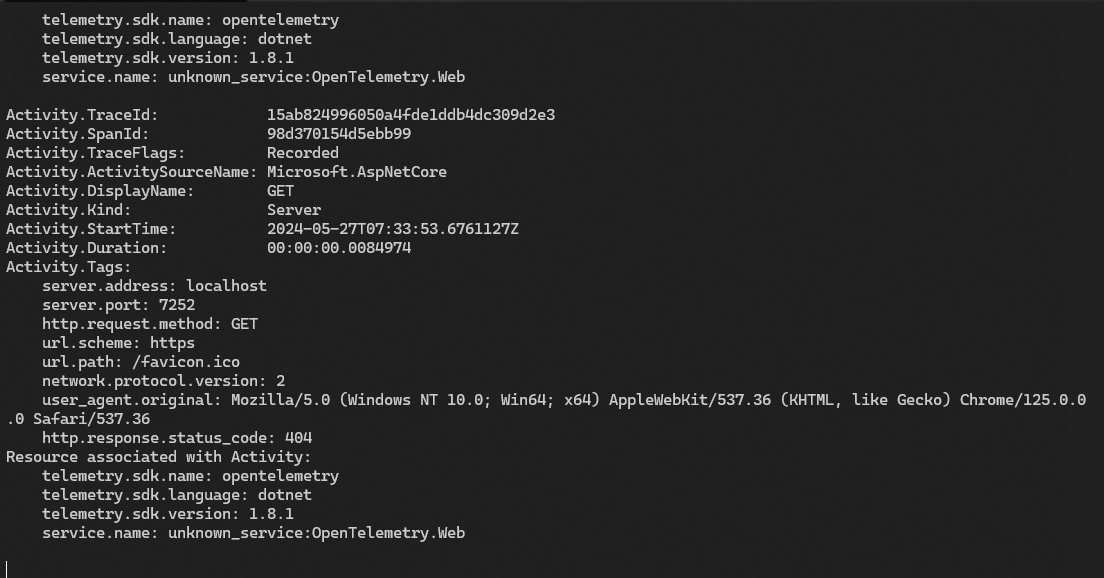
6. Run the application and call any endpoint, you will notice output like following:
7. To export it in standard OpenTelemetry format, install OpenTelemetry.Exporter.OpenTelemetryProtocol package from Nuget.
8. Finally , Add OTEL_EXPORTER_OTLP_ENDPOINT to your environment variables and replace it with following code:
builder.Services.AddOpenTelemetry()
.WithTracing(tracing =>
{
tracing.AddAspNetCoreInstrumentation();
})
.WithMetrics(metrics =>
{
metrics.AddAspNetCoreInstrumentation()
.AddRuntimeInstrumentation();
})
.UseOtlpExporter();
That’s all needed for configuring Open Telemetry in Asp.Net application. You can configure the endpoint to backend of your choice like Jaeger, Prometheus, Application Insights, Zipkin, Datadog, etc.
Tip: You can use visualize the output and confirm if it is working locally using Aspire Dashboard.
How to add OpenTelemetery support in Azure Function App?
Azure Functions apps by default use proprietary format for sending out telemetry to applications insights but you can configure it to use OpenTelmetery format for making it backend agnostic by following below steps:
1. Update host.json file with adding “telemetryMode”: “openTelemetry”, after which it looks like following:
{
    "version": "2.0",
    "logging": {
      "applicationInsights": {
        "samplingSettings": {
          "isEnabled": true,
          "excludedTypes": "Request"
        },
      "enableLiveMetricsFilters": true
      }
    },
  "telemetryMode": "openTelemetry"
}
2. Update OTEL_EXPORTER_OTLP_ENDPOINT environment variable and point it to backend of your choice.
You can refer to this https://opentelemetry.io/docs/languages/sdk-configuration/otlp-exporter/ for more configuration options.
3. Add these packages to your application:
Microsoft.Azure.Functions.Worker.OpenTelemetry
OpenTelemetry.Extensions.Hosting
OpenTelemetry.Exporter.OpenTelemetryProtocol
Note: Microsoft.Azure.Functions.Worker.OpenTelemetry is still in early preview at the time of writing this, but hopefully it will get a stable release soon.
4. Now configure it in Program.cs inside ConfigureServices delegate like following:
services.AddOpenTelemetry()
.UseFunctionsWorkerDefaults()
.UseOtlpExporter();
You can add configure it just like we did it for Asp.Net earlier and add more instrumentations according to your needs.
Conclusion
Integrating OpenTelemetry into your Asp.Net and Azure Function applications enhances your ability to gather, analyze, and understand telemetry data. By following the outlined steps, you can easily set up OpenTelemetry to collect traces, metrics, and logs, providing valuable insights into your applications’ performance and behavior. This enables more informed decisions about optimization, troubleshooting, and capacity planning. With OpenTelemetry’s standardized approach and broad support for various backends, you can ensure a consistent and comprehensive monitoring solution across your systems. Keep OpenTelemeterying!