


Introduction
Monitoring application performance and behaviour is crucial for maintaining reliability and ensuring a smooth user experience. Custom metrics allow developers to gain insights into specific aspects of their applications, enabling proactive detection of issues and informed decision-making. In this blog post, we will explore how to integrate custom metrics into a .NET Todo application using OpenTelemetry. We will cover best practices for defining and recording metrics, showcase the implementation of various metric types, and writing tests against it. Whether you’re looking to enhance observability or optimize performance, this guide will help you effectively instrument your .NET applications.
We saw in last post on how to add OpenTelemetry support to .Net Application, in this post we will add custom metrics to it.
While you have .Net Built-in metrics and ASP.NET Built-in metrics. System.Diagnostics.Metrics also exposes IMeterFactory to write your own custom meterics tailored to your specific use case. Let’s explore that.
Prerequisites
- An existing .Net Web Api Project
- Understanding basics of Metrics and OpenTelemetry integration
Implementing Custom Metrics in .Net application
1. Create a new class TodoMetrics like following:
public class TodoMetrics
{
public const string MeterName = "Todo.Api";
private readonly Counter _todoRequestCounter;
public TodoMetrics(IMeterFactory meterFactory)
{
var meter = meterFactory.Create(MeterName);
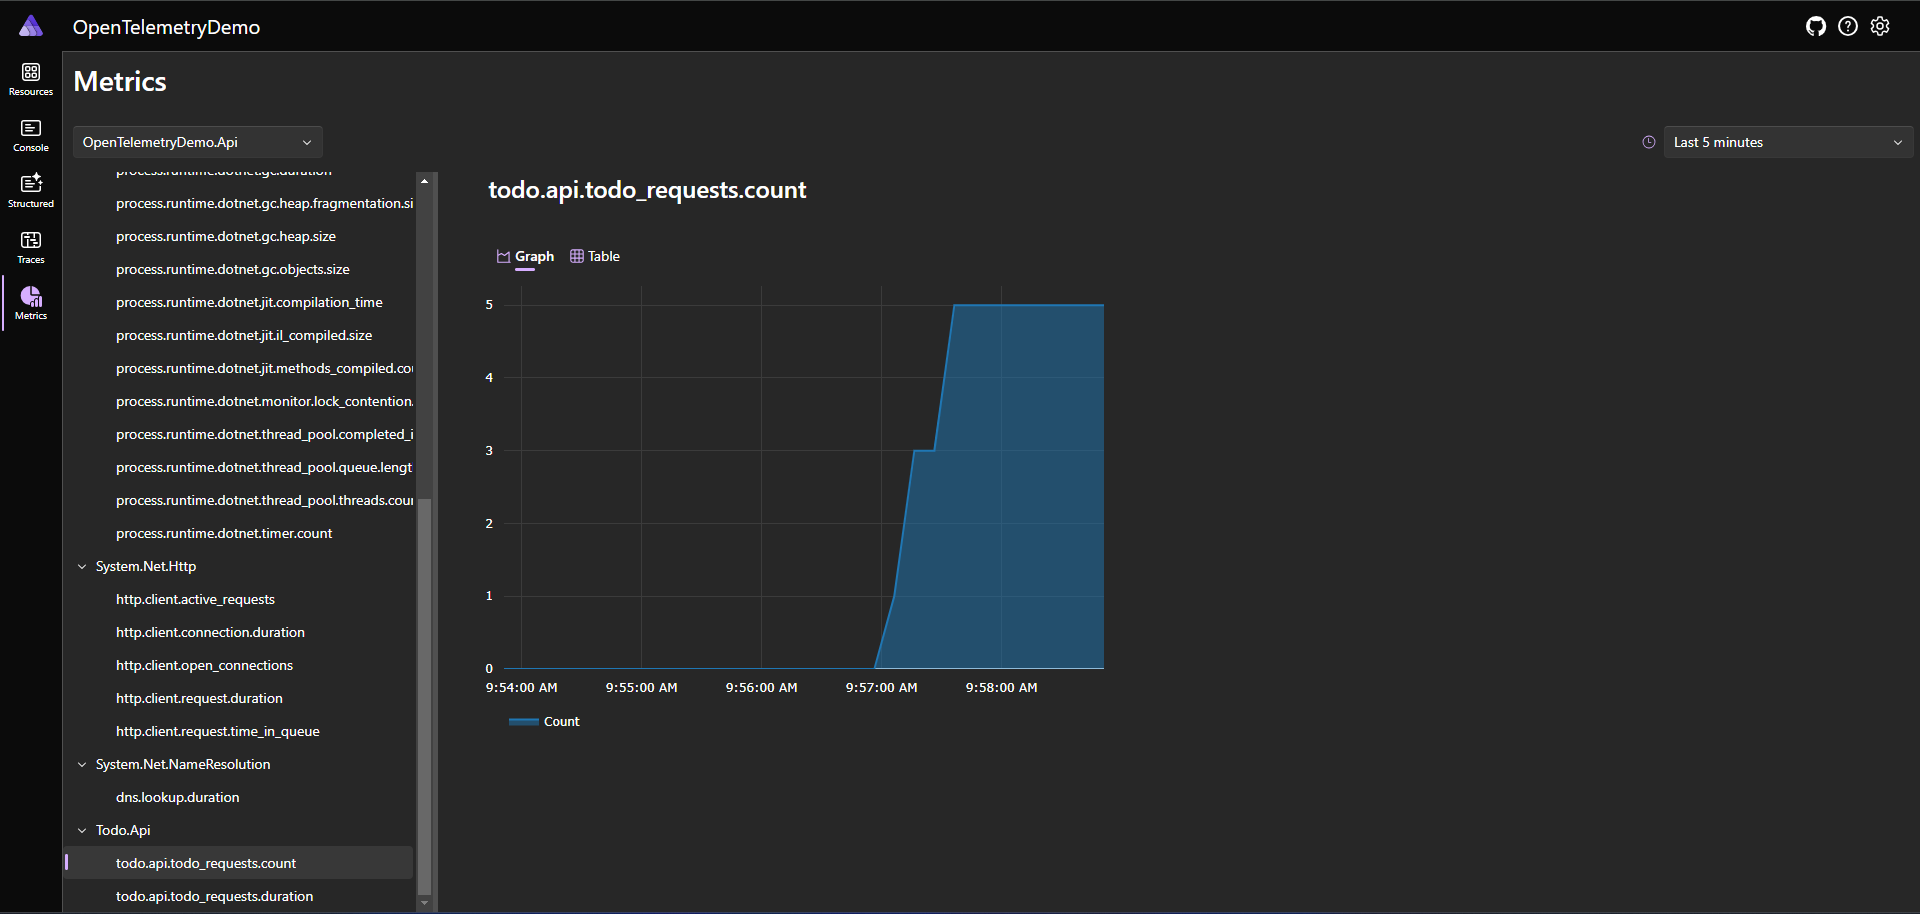
_todoRequestCounter = meter.CreateCounter("todo.api.todo_requests.count");
}
public void IncrementTodoRequestCount()
{
_todoRequestCounter.Add(1);
}
}
Here we are declaring the meter name that will show up in dashboard and then creating a simple counter to track count of requests. The IMeterFactory will be injected using DI that we will setup in following steps.
2. Next, we will register the services and our custom TodoMetrics class in DI inside Program.cs
  builder.Services.AddMetrics();

  builder.Services.AddSingleton();
3. Add our custom meteric as below:
builder.Services.AddOpenTelemetry()
  .WithMetrics(metrics =>
  {
    metrics
    .AddAspNetCoreInstrumentation()
    .AddHttpClientInstrumentation()
    .AddRuntimeInstrumentation()
    .AddMeter("Todo.Api");
  })
  .WithTracing(tracing =>
  {
    tracing.AddAspNetCoreInstrumentation()
    .AddHttpClientInstrumentation();
  });
Here, alongside built-in metrics, we are registering our custom metric that we want to populate in dashboard. Note, the name that you pass in AddMeter function should exactly matchup with the meter that we created in TodoMetrics class.
4. In order to use this metrics class we will do it as following:
app.MapGet("todo", (TodoMetrics todoMetrics) =>
{
  todoMetrics.IncrementTodoRequestCount();
  return Results.Ok(todoList);
});
5. To see everything so far in action, we will launch our AppHost project that will fire up Aspire dashboard where we can visualize our metrics. This is easy to setup and provides fast dev loop to implement this kind of things.
6. Next, we will add a Histogram to our custom metrics. Inside TodoMetrics.cs declare a new private field _todoRequestDuration with Histogram as type.
And instantiate it in constructor as following:
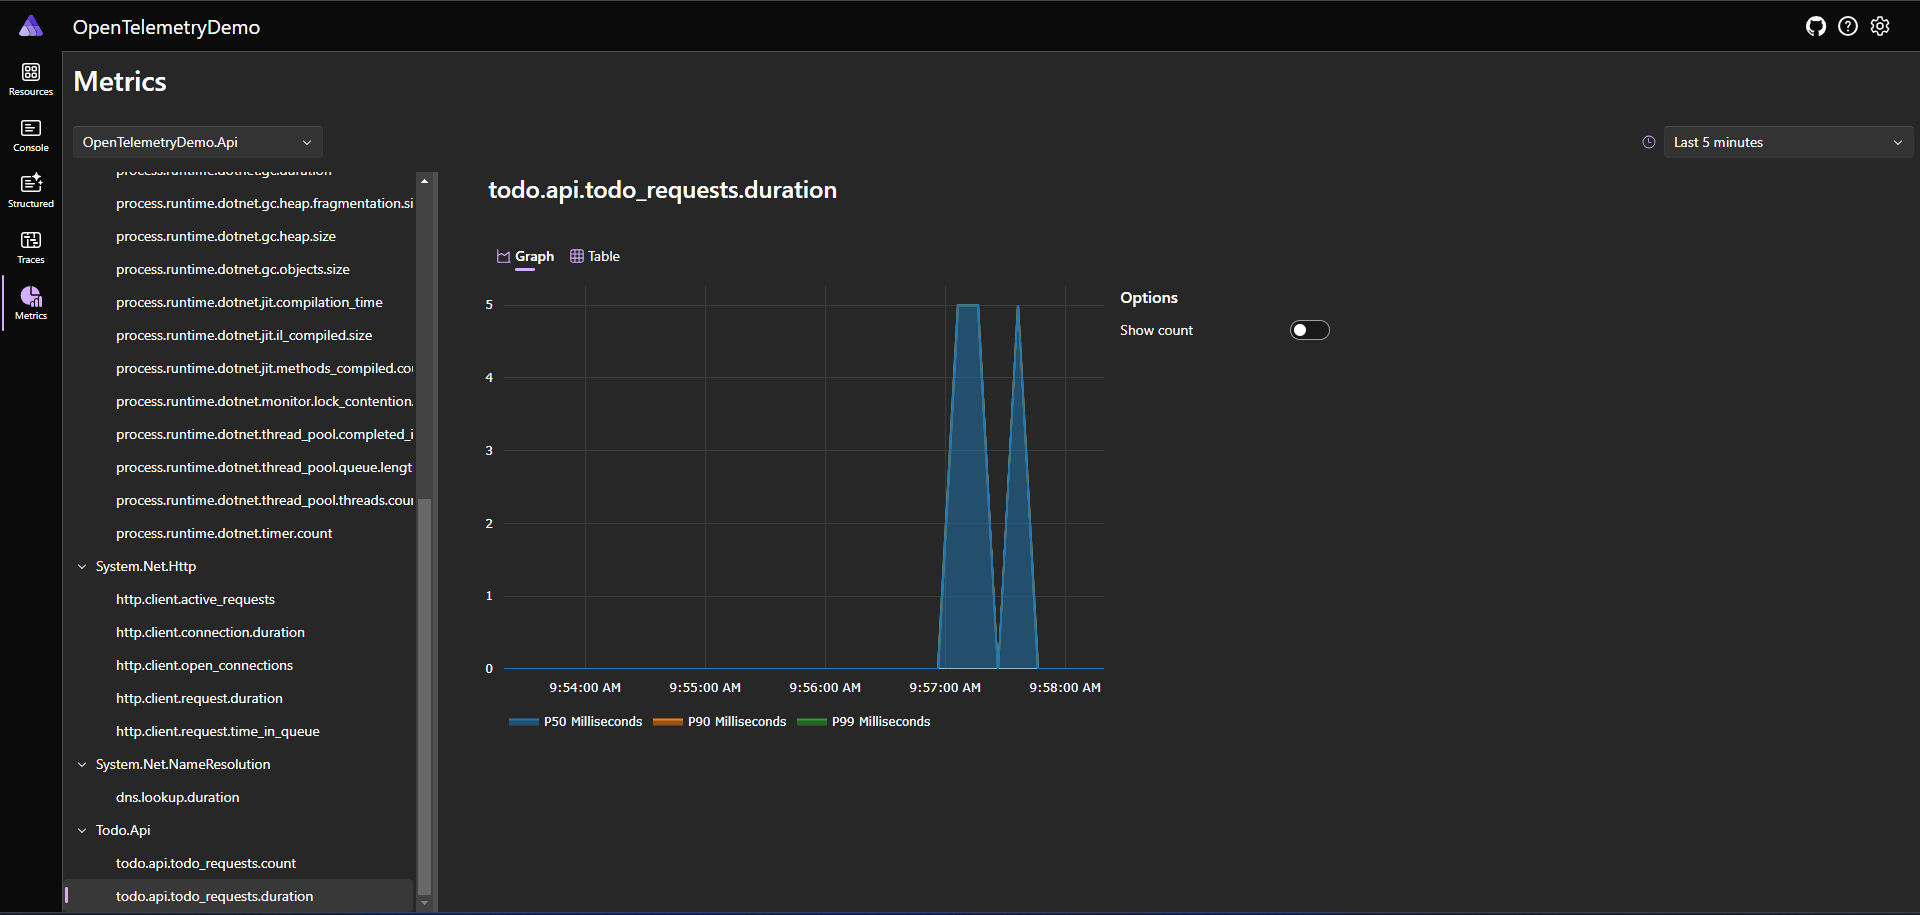
_todoRequestDuration = meter.CreateHistogram("todo.api.todo_requests.duration", "ms", "Total duration of request");
Create a new class TrackRequestDuration implementing IDisposable as following:
public class TrackedRequestDuration : IDisposable
{
  private readonly long _requestStartTime = Stopwatch.GetTimestamp();
  private readonly Histogram _requestDuration;

  public TrackedRequestDuration(Histogram requestDuration)
  {
  _requestDuration = requestDuration;
  }

  public void Dispose()
  {
    var elapsed = Stopwatch.GetElapsedTime(_requestStartTime);
    _requestDuration.Record(elapsed.TotalMilliseconds);
  }
}
Finally create a new method MeasureRequestDuration as following:
public TrackedRequestDuration MeasureRequestDuration()
{
  return new TrackedRequestDuration(_todoRequestDuration);
}
7. This new metric can be used inside our api as following:
app.MapPost("todo", (Todo todo, TodoMetrics todoMetrics) =>
{
  using var _ = todoMetrics.MeasureRequestDuration();
  todoList.Add(todo);

  todoMetrics.IncrementTodoRequestCount();

  return Results.Ok();
});
8. And all of this will show up as beautifully graph in dashboard with different percentile latencies like following:
Additionally, you may want to explore other instruments like UpDownCounter, ObservableCounter, ObservableUpDownCounter and ObservableGauge. You can read about their differences in the documentation.
Testing Custom Metrics
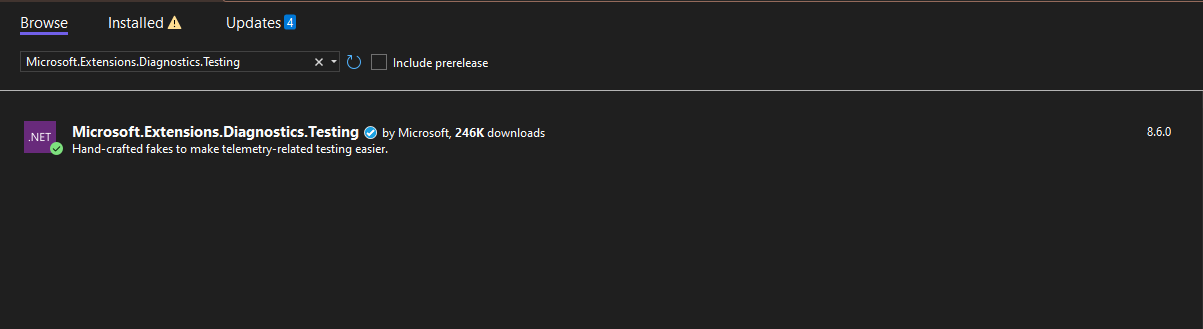
1. Assuming you already have a Unit Test project setup, install Microsoft.Extensions.Diagnostics.Testing package from NuGet
Also, add a reference to Api project in your Unit Test project.
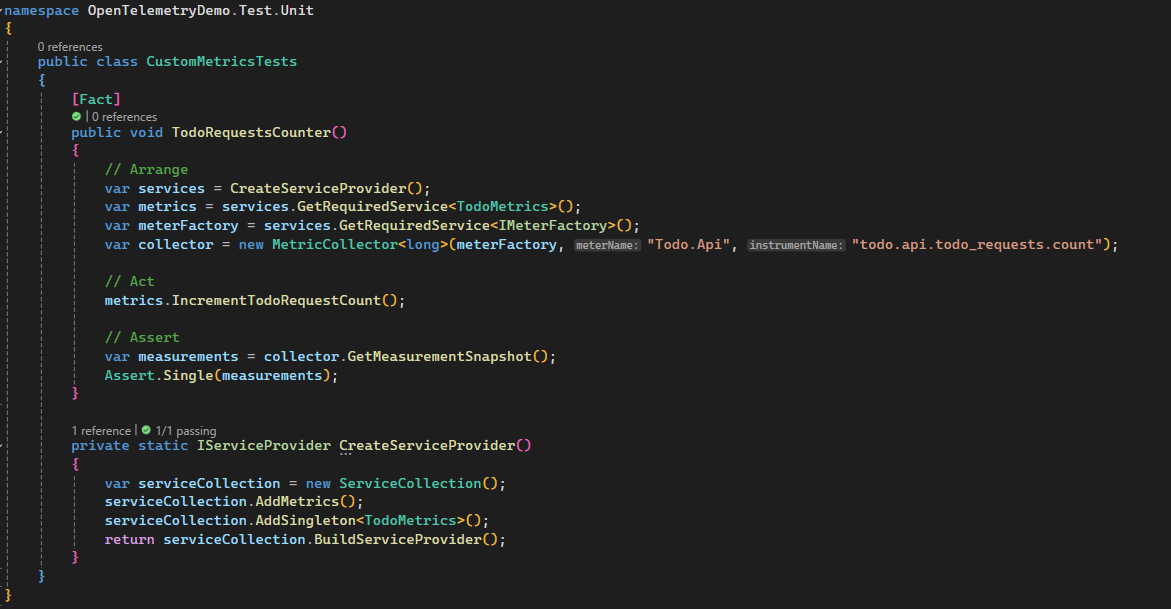
2. Write a test method as following:
public class CustomMetricsTests
{
  [Fact]
  public void TodoRequestsCounter()
  {
    // Arrange
    var services = CreateServiceProvider();
    var metrics = services.GetRequiredService();
    var meterFactory = services.GetRequiredService();
    var collector = new MetricCollector(meterFactory, "Todo.Api", "todo.api.todo_requests.count");

    // Act
    metrics.IncrementTodoRequestCount();

    // Assert
    var measurements = collector.GetMeasurementSnapshot();
    Assert.Equal(1, measurements.Count);
  }

  private static IServiceProvider CreateServiceProvider()
  {
    var serviceCollection = new ServiceCollection();
    serviceCollection.AddMetrics();
    serviceCollection.AddSingleton();
    return serviceCollection.BuildServiceProvider();
  }
}
Here we are using DI approach to add Metrics to ServiceCollection. Then we are instantiating our meter using IMeterFactory and then MetricCollector is being used to record the metrics and finally assert against it.
In this case, we have a simple counter but it could be more complex depending on your requirements.
Best Practices for Writing Custom Metrics
- Meter Initialization:
– For non-DI code, create a static Meter.
– In DI-aware code, avoid static Meters; use DI to manage Meter lifetimes.
– Use unique, hierarchical names for Meters (e.g., “MyApp.Metrics”). - Naming Conventions:
– Follow OpenTelemetry guidelines with lowercase, dotted hierarchical names.
– Example: “myapp.request.duration”. - Thread Safety:
– Instrument APIs are thread-safe, so no additional synchronization is needed for metric recording. - Performance:
– Instrument recording is efficient but be mindful in extremely performance-sensitive code. - Disposable Meters
– Meters are disposed automatically by DI containers; no need to manually dispose them. - Choosing Instrument Types:
– Counter/ObservableCounter: For values that only increase.
– Histogram: For measuring durations or distributions.
– UpDownCounter/ObservableUpDownCounter: For values that can increase or decrease. - Memory Usage:
– Histograms can consume more memory; provide guidance for managing many Histogram metrics. - Observable Instrument Callbacks:
– Ensure callbacks are quick and do not perform blocking operations. - Synchronization for Observable Instruments:
– Synchronize memory access or use methods like Volatile.Read and Volatile.Write. - Unit Naming:
– Use UCUM standards for units, e.g., “{requests}” for descriptive annotations.
Conclusion
Integrating custom metrics into your .NET Todo application with OpenTelemetry provides powerful insights into your application’s performance and behavior. By following best practices for defining, recording, and tagging metrics, you can ensure accurate and meaningful monitoring. This not only helps in identifying and resolving issues proactively but also enhances the overall reliability and user experience of your application. With the detailed steps and examples provided, you are now equipped to implement effective observability in your .NET projects, enabling you to make data-driven decisions and optimize performance efficiently.