


Introduction
In today’s data-driven world, real-time analytics has become crucial for businesses to stay competitive and responsive. Power BI, Microsoft’s powerful business intelligence tool, offers a feature called Streaming Datasets, which enables users to visualize and analyze data in real-time. Power BI Streaming Datasets allow you to push data to Power BI and visualize it in real-time without the need for refreshing the dashboard manually. This is particularly useful for monitoring IoT devices, tracking live sales data, or any scenario where immediate insights are valuable.
Real-Time Data Streaming
Real-time Data Streaming is a dynamic process that involves the continuous observation and analysis of data as it occurs, providing immediate insights into various aspects of a business operation. This real-time monitoring integration allows companies to be able to do real-time decision-making. For instance:
- Consider Inventory Management – The system tracks product sales, stock levels, and customer buying patterns continuously. As products sold, the system updates inventory levels in real-time.
- Real-time monitoring helps identify fraudulent activities – If there’s a sudden spike in high-value transactions or multiple transactions from the same location within a short time, the system can trigger alerts for further investigation.
- Operational efficiency required real-time data – Companies in distribution need to know real-time updates regarding shipments and inventory, so that corrective action can be taken.
How does it work?
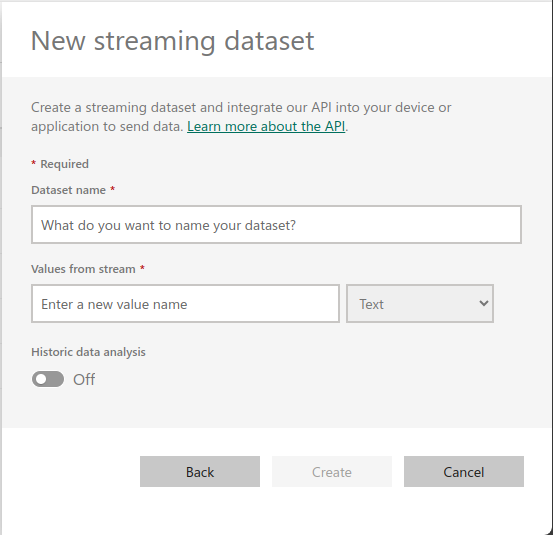
To utilize this feature, first create a streaming dataset in the Power BI service. Then specify the dataset name and the values received from the data stream. Currently, the supported data types are Text, Number, and DateTime. Once the dataset configured, the Power BI service will create a Push URL. The Push URL where your data will be sent in the Power BI service. This Streaming Dataset works on level dashboard.
Streaming Dataset
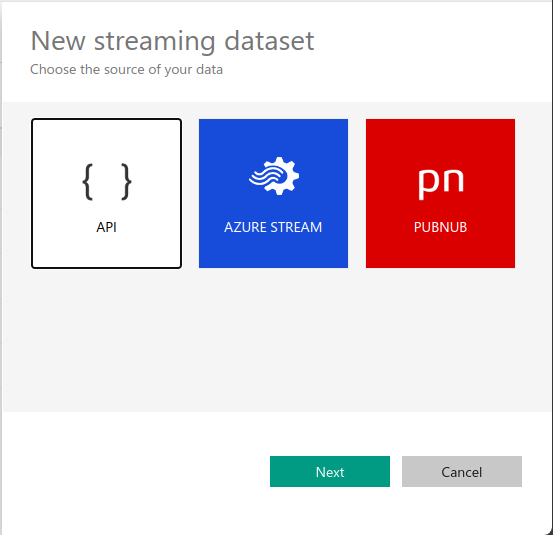
We can get the dataset in real-time using streaming option: API and Azure Stream and PubNub. The streaming dataset configuration can be only set in the Power BI Service. After selecting new “Streaming dataset” in Power BI Service, 3 options for streaming dataset sources will appear as below.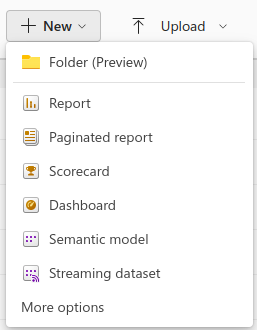
A. Using API
- Because for this example we use API as streaming option, choose API and continue. Then create a new dataset with any names. We also configure the column and the data type.

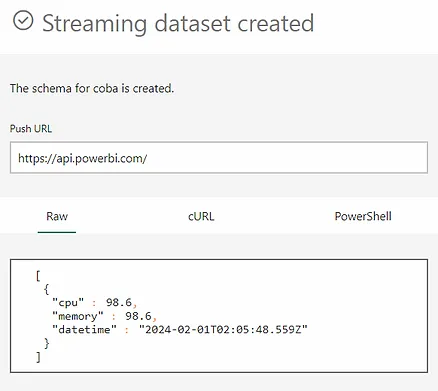
- After configuring the dataset, this will create the dataset with a Push URL. In this article we try to get real-time CPU data using API URL in Power Shell. Copy the URL and use it to get the real-time data of CPU.

B. Using PubNub
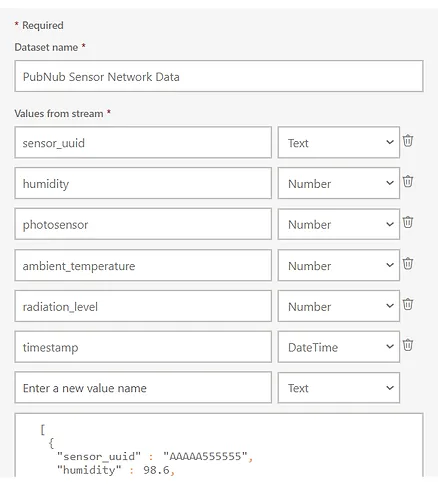
- First, configure all the settings. Name your dataset in Dataset Name, enter the Subscriber Key and Channel Name. PAM Auth Key can left blank. For example, below we are trying to use PubNub Sample Dataset which analyzes about sensor networks.
- After configuring your dataset, the publisher code is running, Power BI will be able to connect to the channel and receive some data.

- Streaming dataset is all set and we ready to create real-time monitoring dashboard.
Report
After the streaming datasets are created. we can create reports from that dataset. Only streaming datasets coming from the API have a create report menu. Simply click the three dots on the desired streaming dataset and select create report. Then, start creating visual on your report, including line chart, card, etc.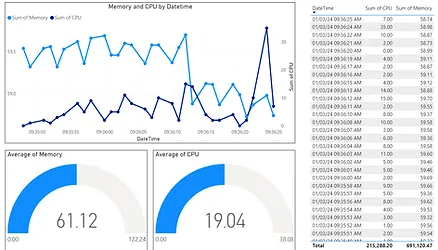
As explained earlier streaming datasets only work at the dashboard level. Real-time monitoring of data can be seen through the dashboard. The next step is to pin the desired chart to appear on your dashboard. “Pin Visual” can be done by hovering over the desired visual and later in the header icon of the visual just select the “Pin visual” menu.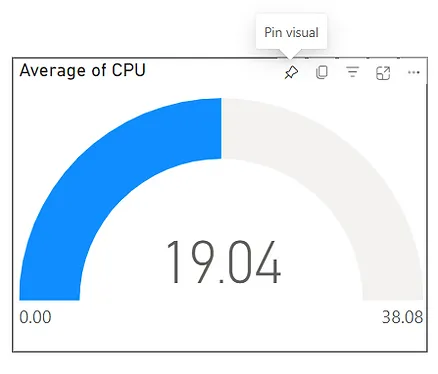
Create Dashboard Tile
Once the streaming dataset is generated, it can be used to create visual element in the dashboard. Create a new dashboard and select “Add Tile” located at the top right corner of the Power BI Interface. After that, click on “Custom Streaming Data” and proceed by Clicking “Next”.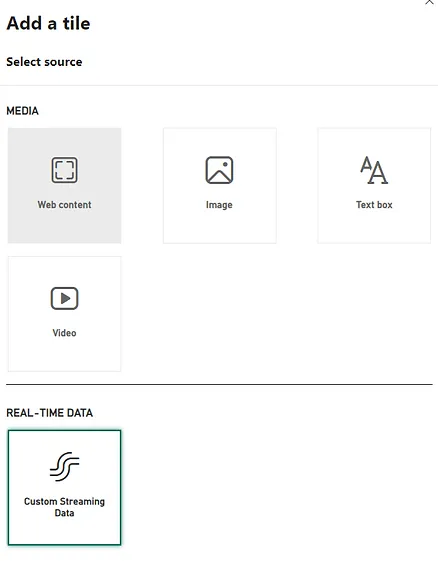
Select the dataset you just created and then click “Next”.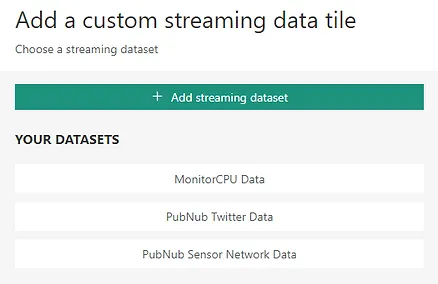
After that, you simply create your visualization element that you want. Customize your visualization and set up the field. The types of visuals that can be created in the dashboard are Card, Line Chart, Clustered Bar Chart, Clustered Column Chart, and Gauge.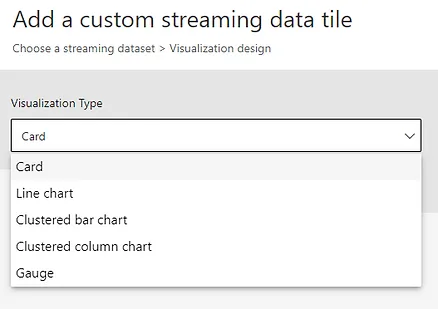
For example, you can add visual with the type of card to monitor main KPI of your data. Other than that, line chart can used to monitor value of some fields over the time.
Below is the example dashboard from the dataset sensor-network that have been generated from PubNub.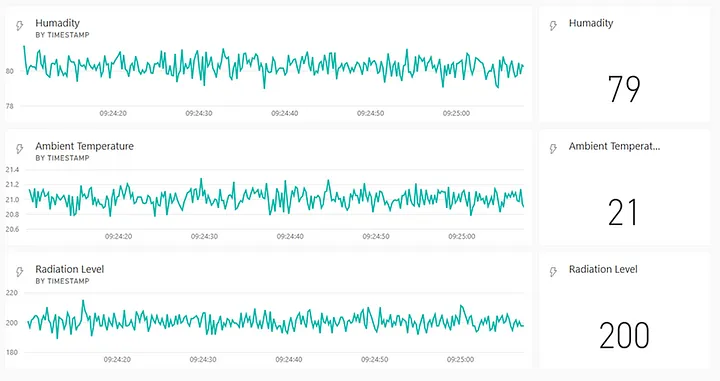
Conclusion
As the digital era progresses, embracing Real-time Monitoring and Analysis, Dynamic Dashboards, and Streaming Datasets is not just advisable; it’s a strategic imperative for thriving in the dynamic landscape of data-driven decision-making. The need for rapid real-time data analysis is becoming a critical synergy for business development. Leveraging these tools, businesses worldwide can unlock substantial value, enhancing processes, reducing costs, and making tangible contributions to revenue growth.