


In the fast-moving, competitive software development and IT operations field, being able to quickly spot the most critical issues is important. Logs are at the root of observability, providing insight into application and infrastructure health and behaviour. Still, identifying errors within them is manually intensive and potentially a source of human error. Think of Kibana Watcher, a powerful component within the Elastic Stack, formerly known as the ELK Stack, which automates watching Elasticsearch indices for pre-defined conditions and, upon satisfaction of those conditions, triggers an alert to the defined renderer. Today in this following blog we will go through a step-by-step process of creating a Kibana Watcher watching Elasticsearch logs for a certain error string and triggering an alert on the same. This allows for more depth in how to use the same tool for real-time alerting.
Understanding Kibana Watcher
Before diving into the setup, let’s briefly explore what Kibana Watcher is and why it’s an essential tool for modern IT operations.
What is Kibana Watcher?
Kibana Watcher is a feature within Kibana that enables users to automate the monitoring of Elasticsearch indices. It works by periodically executing queries against your data and triggering actions based on the results. These actions can range from sending notifications via email or Slack to indexing documents or even calling external webhooks. We have a detailed guide on Kibana watcher that you have a look at in this post
Why Use Kibana Watcher?
- Real-time Monitoring: Automatically monitor your Elasticsearch indices for changes in real-time.
- Automated Alerts: Receive immediate notifications when specific conditions are met, enabling quick response to critical events.
- Customizable Actions: Tailor actions to fit your operational needs, whether it’s sending an email alert, posting to Slack, or integrating with other systems.
- Scalability: Easily scale monitoring across large datasets and complex conditions without significant overhead.
Setting Up a Kibana Watcher for Log Monitoring
Let’s walk through setting up a Kibana Watcher to monitor Elasticsearch logs for a specific error string, “DatabaseConnectionError”, and send email notifications upon detection.
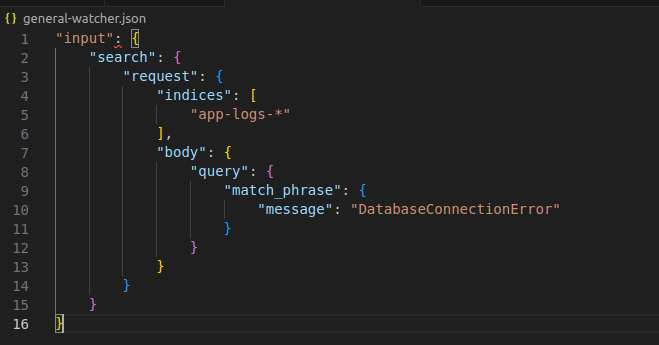
Step 1: Define the Input
The input specifies which Elasticsearch index to monitor and how to query it. Assume your logs are stored in an index named app-logs-*, and you want to check for log entries containing “DatabaseConnectionError”.
Step 2: Set the Schedule
Define how often the watch should run. For real-time monitoring, you might set it to run every minute. Following is a snippet to set the interval for this watcher to 1 minute:
"schedule": {
  "interval": "1m"
}
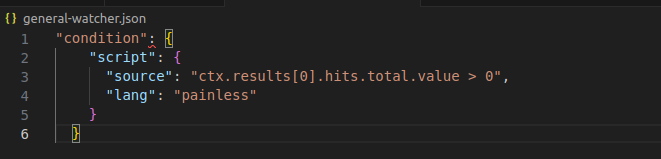
Step 3: Specify the Condition
The condition checks if the query returned any documents. If so, it means the error string was found in the logs. Just for an example, in the following snippet, we are setting condition so that if our target message is found even once in the Elasticsearch logs, we set the condition to true and trigger the alert:
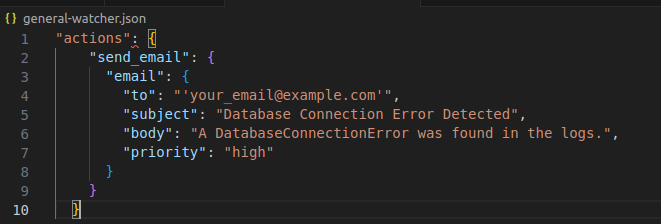
Step 4: Configure Actions
For this example, let’s configure an email action. You can configure more actions like Slack, Teams etc. You’ll need to replace "your_email@example.com" with the recipient’s email address.
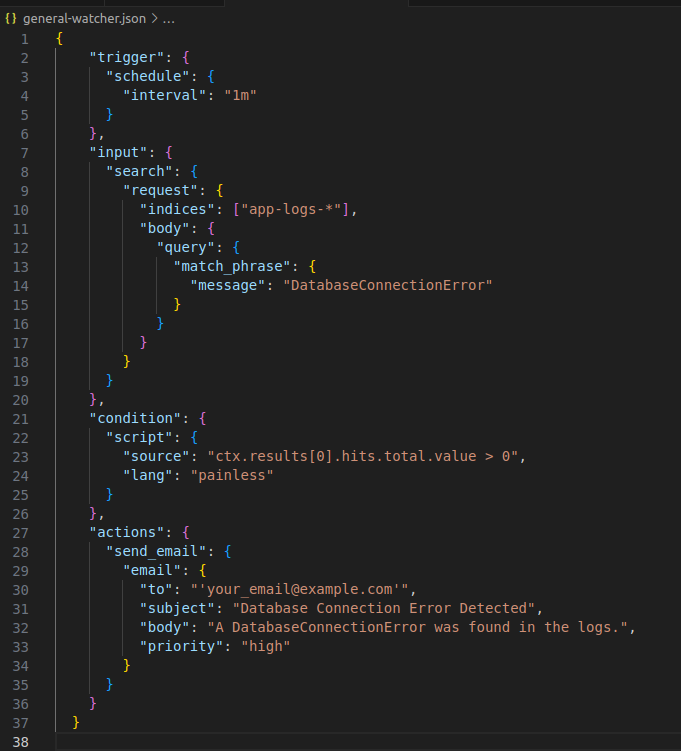
Complete Watch Definition
Combining all the above components, the complete watch definition in JSON format would look like this:
Implementing the Kibana Watcher
With the watch definition ready, you can implement it in Kibana by navigating to the Watcher UI under Management. Click on “Add watch”, paste your JSON definition, and activate the watch. Kibana will now periodically check your Elasticsearch logs for the specified error string and send email notifications upon detection.
Conclusion
Kibana Watcher is a powerful tool for automating log monitoring and alerting within the Elastic Stack. By setting up watches like the one described above, IT operations teams can proactively monitor their systems for critical errors, enabling faster response times and improved system reliability. Whether you’re dealing with application logs, infrastructure metrics, or security events, Kibana Watcher provides a flexible and scalable solution for real-time monitoring and alerting. As you continue to explore the capabilities of Kibana Watcher, remember that the key to effective monitoring lies not just in setting up watches but also in continuously refining them based on evolving operational needs and insights gained from your data.