


Introduction
In the world of Business Intelligence (BI) tools, Power BI and Tableau stand out as leading solutions. Both tools offer powerful data visualization capabilities, but they serve different needs and preferences. This blog will compare Power BI and Tableau, exploring their features, strengths, and ideal use cases to help you make an informed decision.
Overview of Power BI and Tableau
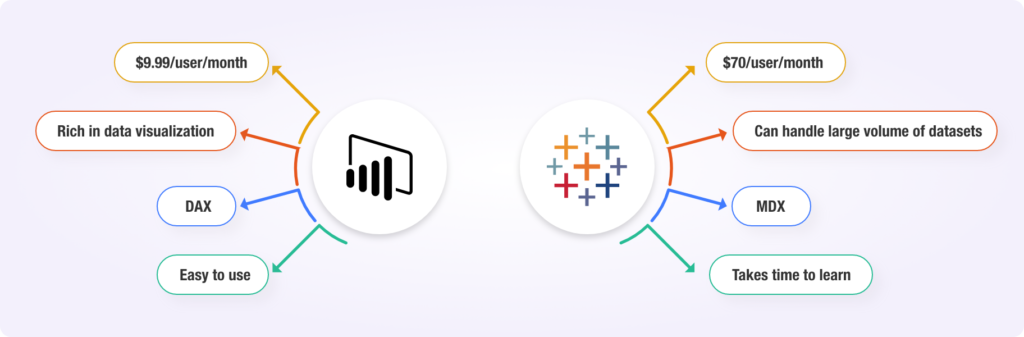
Power BI: Power BI is a business analytics service by Microsoft. It provides interactive visualizations and business intelligence capabilities with an interface simple enough for end users to create their own reports and dashboards. Power BI integrates seamlessly with other Microsoft products, making it a popular choice for organizations already using the Microsoft ecosystem.
Tableau: Tableau is a powerful data visualization tool used in the Business Intelligence industry. It helps in simplifying raw data into an understandable format. Tableau is known for its ability to create a wide range of visualizations to present data insights. It is widely used for its advanced analytics capabilities and interactive dashboards.
Key Features Comparison
Data Connectivity
Power BI
- Connects to a wide variety of data sources, including Excel, SQL Server, Azure, and more.
- Supports real-time data streaming and automatic data refresh.
- Example code to connect to a SQL Server database:
import pyodbc

conn = pyodbc.connect('DRIVER={SQL Server};'
                      'SERVER=server_name;'
                      'DATABASE=database_name;'
                      'UID=user;'
                      'PWD=password')
cursor = conn.cursor()
cursor.execute('SELECT * FROM table_name')
for row in cursor:
    print(row)
Tableau:
- Extensive data connectivity options, including on-premise databases, cloud services, and big data.
- Allows for live and in-memory data connections.
- Example code to connect to a PostgreSQL database using Tableau’s Data Extract API:
import tableauserverclient as TSC

tableau_auth = TSC.TableauAuth('username', 'password', 'site_id')
server = TSC.Server('http://your-server', use_server_version=True)

with server.auth.sign_in(tableau_auth):
    all_datasources, pagination_item = server.datasources.get()
    print([datasource.name for datasource in all_datasources])
Data Preparation
Power BI: Power BI offers Power Query for data transformation. Power Query allows users to clean, transform, and mash up data from multiple sources. It provides a user-friendly interface for data preparation tasks.
- Built-in Power Query Editor for data transformation.
- M language for advanced data manipulation.
- Supports DAX (Data Analysis Expressions) for complex calculations.
- Example of using Power Query M language:
let
    Source = Sql.Database("ServerName", "DatabaseName"),
    SalesData = Source{[Schema="dbo",Item="Sales"]}[Data],
    FilteredRows = Table.SelectRows(SalesData, each [Year] = 2023)
in
    FilteredRows
Tableau: Tableau provides Tableau Prep for data cleaning and preparation. Tableau Prep is designed to make data preparation simple and intuitive, allowing users to combine, shape, and clean their data for analysis.
- Tableau Prep for data cleaning and preparation.
- Drag-and-drop interface for easy data manipulation.
- Supports Tableau’s own calculation language for custom calculations.
- Example of a simple data preparation flow:
import pandas as pd

df = pd.read_csv('data.csv')
df_cleaned = df.dropna().query('Year == 2023')
df_cleaned.to_csv('cleaned_data.csv', index=False)
Visualization Capabilities
Power BI: Power BI offers a wide range of visualizations including bar charts, pie charts, and maps.
- It provides interactive dashboards that allow users to drill down into data and gain insights.
Tableau: Tableau is known for its advanced visualization capabilities and interactive dashboards.
- It allows users to create complex visualizations and perform in-depth data analysis.
- Advanced chart types like treemaps, heat maps, and bullet charts.
Performance and Speed
Power BI
- Optimized for handling large datasets.
- Leverages Azure for enhanced performance.
- Incremental data refresh for faster updates.
Tableau
- In-memory and live connection options for high performance.
- Hyper data engine for fast data processing.
- Efficient handling of large datasets with optimized queries.
Integration with Other Tools
Power BI
- Strong integration with Microsoft products like Azure, Excel, and SharePoint.
- API support for custom integrations.
- Integration with third-party tools through connectors.
- Seamless embedding of reports in custom applications using Power BI Embedded.
- Example: Embedding Power BI Report in a Web Application
https://app.powerbi.com/reportEmbed?reportId=reportId&autoAuth=true&ctid=tenantIdTableau
- Integrates with a wide range of data sources and platforms.
- API support for custom development.
- Integration with Salesforce and other CRM tools.
- Tableau extensions and plugins for additional functionality.
- Example: Embedding Tableau Dashboard in a Web Application
https://public.tableau.com/views/DashboardName/Dashboard?:embed=y&:display_count=yes&:showVizHome=noUse Cases and Industry Adoption
Power BI
- Widely used in enterprises leveraging Microsoft ecosystems.
- Common in financial, healthcare, and retail sectors.
- Suitable for small to large organizations.
- Examples of use cases:
- Financial reporting and analysis
- Sales and marketing analytics
- Operational performance monitoring
Tableau
- Popular in industries focusing on data visualization and analytics.
- Common in media, technology, and education sectors.
- Suitable for both small and large organizations.
- Examples of use cases:
- Data exploration and discovery
- Customer behavior analysis
- Academic research and visualization
Matrix Comparison
| Feature | Power BI | Tableau |
| Overview | Developed by Microsoft, offers a suite of services including Power BI Desktop, Power BI Service, and Power BI Mobile | Acquired by Salesforce, includes Tableau Desktop, Tableau Server, Tableau Online, and Tableau Public |
| Embedded Analytics | Excellent embedding capabilities within the Microsoft ecosystem. | Strong support for embedding dashboards into other applications. |
| Artificial Intelligence | Built-in AI capabilities like Power BI Q&A, AI visuals, and integration with Azure ML | Advanced AI features with Tableau AI and integration with R and Python |
| Deployment Options | Cloud-based with on-premises options via Power BI Report Server | On-premises, cloud, and hybrid deployments |
| Mobile Support | Excellent mobile support, with a focus on mobile optimization and native apps | Strong mobile support with responsive dashboards and native apps |
| Example Use Cases | Financial reporting, sales and marketing analytics, operational performance monitoring | Data exploration, customer behavior analysis, academic research and visualization |
Conclusion
Both Power BI and Tableau are powerful BI tools with unique strengths. Power BI is ideal for organizations heavily invested in the Microsoft ecosystem, offering robust integration and affordability. Tableau, on the other hand, excels in advanced data visualization and flexibility, making it a preferred choice for users seeking rich, interactive visualizations.
References
- SimpliLearn Tutorial: https://www.simplilearn.com/tutorials/power-bi-tutorial/power-bi-vs-tableau
- Post: https://billigence.com/blog/tableau-vs-power-bi/