


Virtual threads are a new feature in Java that allow you to handle a large number of concurrent tasks more efficiently. When testing the performance of applications that utilize virtual threads, tools like JMeter and Grafana are useful. This blog will guide you through using JMeter for performance testing and Grafana to visualize the results.
What are Virtual Threads?
Virtual threads are lightweight threads that allow you to create many more threads than traditional platform threads. They are designed to simplify concurrent programming and improve scalability.
Setting Up JMeter for Performance Testing
Step 1: Install JMeter
Download and install JMeter from the Apache JMeter website.
Step 2: Create a Test Plan
- Open JMeter and create a new test plan.
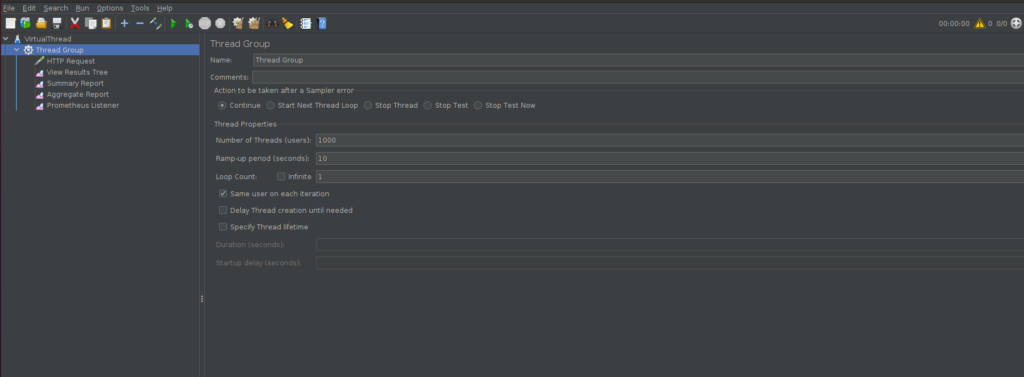
- Add a Thread Group: This is where you define the number of threads (virtual users), ramp-up period, and loop count.
- Right-click on the Test Plan > Add > Threads (Users) > Thread Group.
- Set the number of threads (e.g., 1000), ramp-up period (e.g., 10 seconds), and loop count (e.g., 1).
- Add HTTP Request:
- Right-click on the Thread Group > Add > Sampler > HTTP Request.
- Enter the server name or IP, and specify the path to your application’s endpoint.
- Add a Listener:
- Right-click on the Thread Group > Add > Listener > View Results Tree.
- This helps you see the results during the test.
Setting Up Prometheus and Grafana
Step 1: Set Up Prometheus
- Download and install Prometheus from the official Prometheus website.
- Configure Prometheus to scrape metrics from your application:
- Modify the
prometheus.ymlfile to include your application’s endpoint.
- Modify the
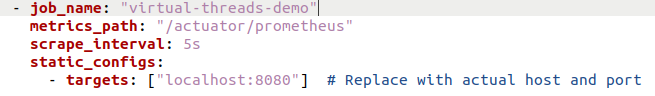
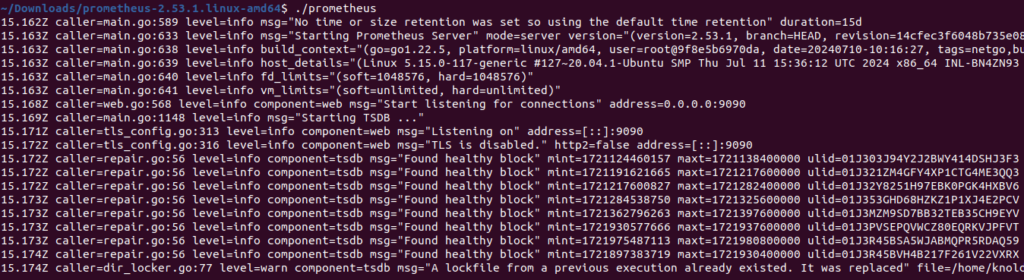
3. Start Prometheus by running ./prometheus in the terminal as shown in image given below.
Step 2: Set Up Grafana
- Download and install Grafana from the official Grafana website.
- Add Prometheus as a data source in Grafana:
- Go to Settings > Data Sources > Add data source > Prometheus.
- Enter the Prometheus URL (e.g.,
http://localhost:9090) and save.
- Create a Dashboard:
- Go to Dashboards > New Dashboard.
- Add panels to visualize metrics like heap memory usage, response time, JVM active threads and JVM classes loaded.
- You can access grafana at http://localhost:3000/
Example Grafana Queries
Heap Memory Usage
jvm_memory_used_bytes{area=”heap”, id=”G1 Old Gen”, job=”virtual-threads-demo”}
Response Time
http_server_requests_seconds_sum{job=”virtual-threads-demo”}
JVM Active Threads
jvm_threads_live_threads{job=”virtual-threads-demo”}
JVM classes loaded
jvm_classes_loaded_classes{job=”virtual-threads-demo”}
Running the Test and Analyzing Results
- Start Your Application that uses virtual threads.
- Run the JMeter Test Plan: Click the start button in JMeter to begin the test.
- Monitor Metrics in Grafana: Open your Grafana dashboard http://localhost:3000/ to observe metrics in real-time.
Conclusion
Testing applications using virtual threads with JMeter and Grafana allows you to effectively measure and visualize performance metrics. By monitoring heap memory usage, response time, JVM active threads and JVM classes loaded, you can ensure your application scales efficiently and meets performance expectations. Virtual threads, combined with robust testing tools, provide a powerful approach to modern concurrent programming.
For more, you can refer to the Project Loom documentation: https://openjdk.org/projects/loom/
For a more technical blog, you can refer to the Nashtech Blogs