


Introduction
If you’re just getting started with Python and want to work with data, Pandas is one of the most popular and essential libraries to learn. It provides easy-to-use data structures and data analysis tools. Whether you want to read, filter, modify, or analyze data, Pandas simplifies these tasks with just a few lines of code.
In this guide, you’ll learn the basics of Pandas with step-by-step examples.
Prerequisites
Before we begin, make sure you have:
- Python installed on your system.
to check this, open your terminal and simply type
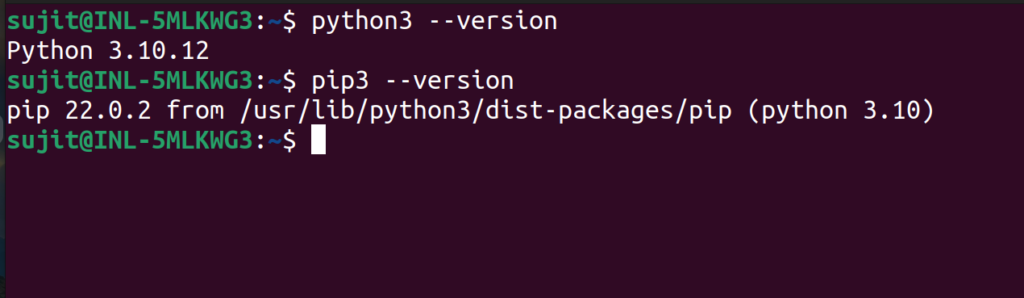
If not, download and install python from here
- Pandas library installed. If not, You can install it using pip3:
pip3 install pandas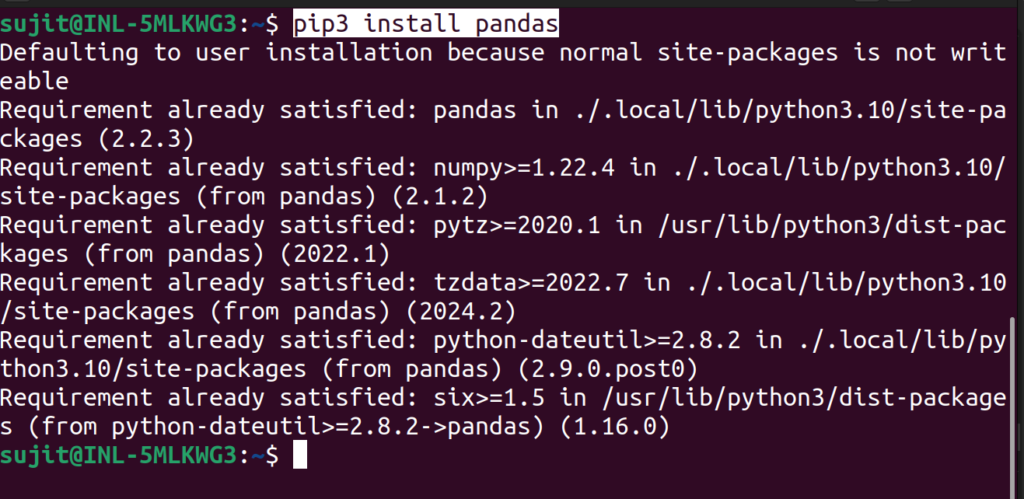
I have already installed in my system.
Step 1: Importing Pandas
To start using Pandas, we first need to create a python file, I created a file named “pandasLearning.py” and import pandas in it. By convention, it is imported with the alias pd:
import pandas as pd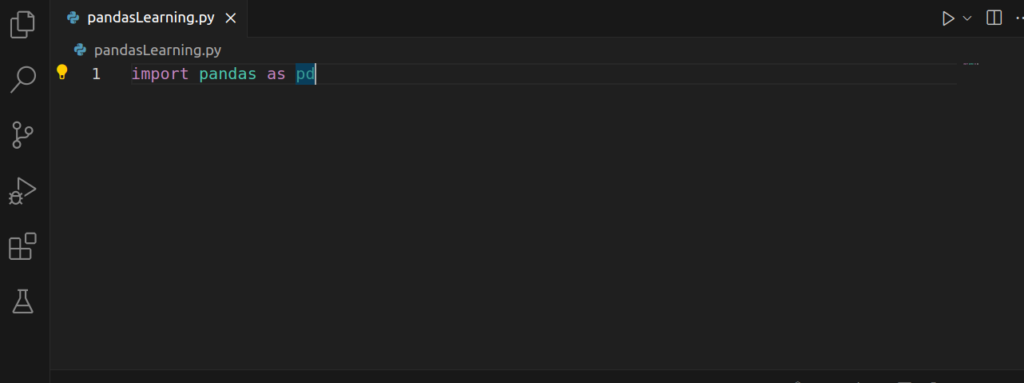
Step 2: Creating a DataFrame
A DataFrame is one of the most important data structures in Pandas. Think of it as a table in Excel or SQL, where data is organized in rows and columns.
Creating a DataFrame from a Dictionary
You can easily create a DataFrame using a dictionary:
data = {
    'Name': ['Alice', 'Bob', 'Charlie', 'David'],
    'Age': [24, 27, 22, 32],
    'City': ['New York', 'Los Angeles', 'Chicago', 'Houston']
}

df = pd.DataFrame(data)
print(df)
Output
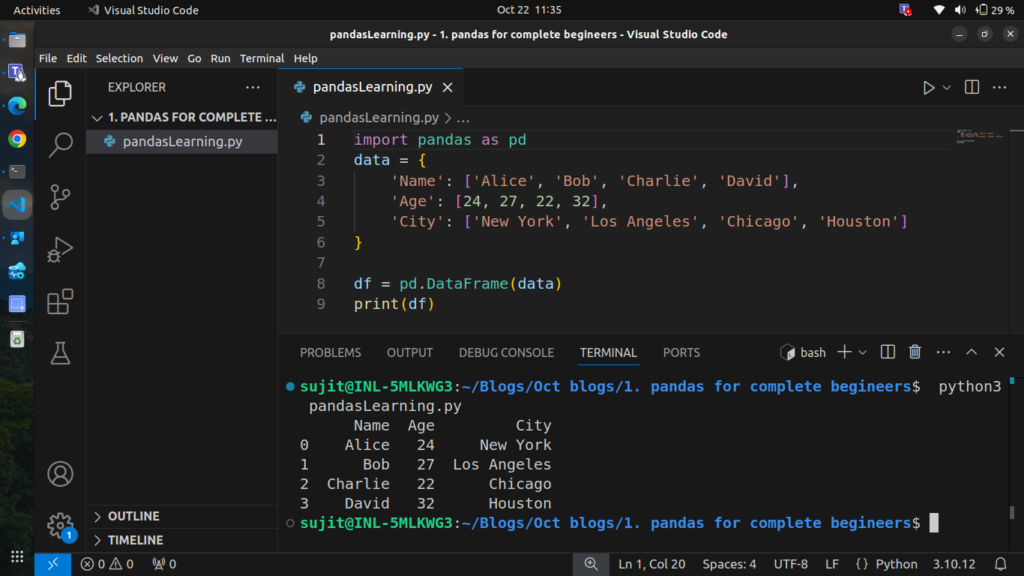
In this example, we created a DataFrame where each key in the dictionary represents a column, and the values are the rows.
Step 3: Reading Data from a File
Pandas makes it easy to load data from various file formats, such as CSV, Excel, or JSON.
Reading a CSV File
Let’s say you have a CSV file named data.csv, If not create a csv file and paste the given contents in it.
file contents:
Name,Age,City
Alice,24,New York
Bob,27,Los Angeles
Charlie,22,Chicago
David,32,Houston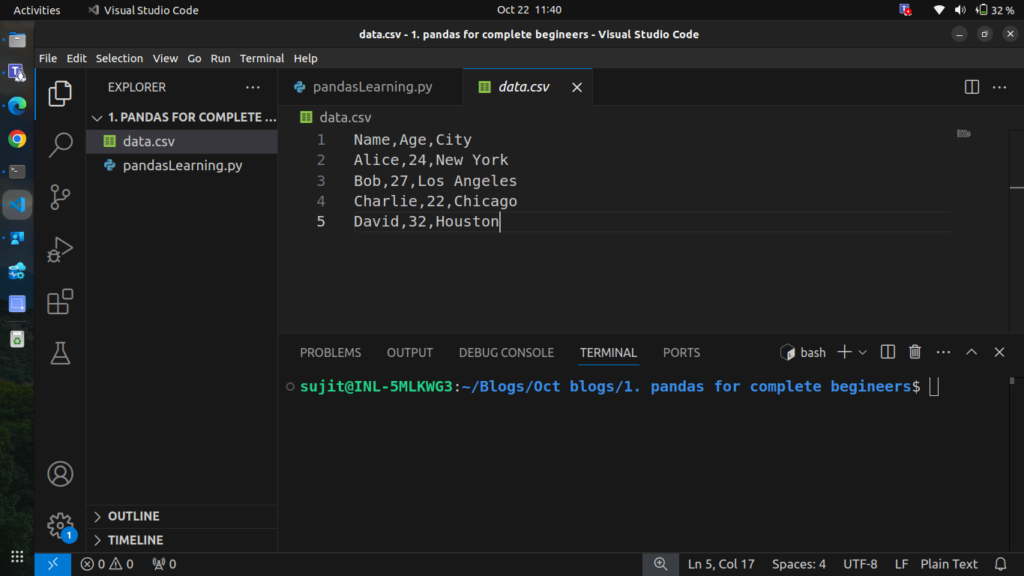
You can read the file using read_csv:
df = pd.read_csv('data.csv')
print(df)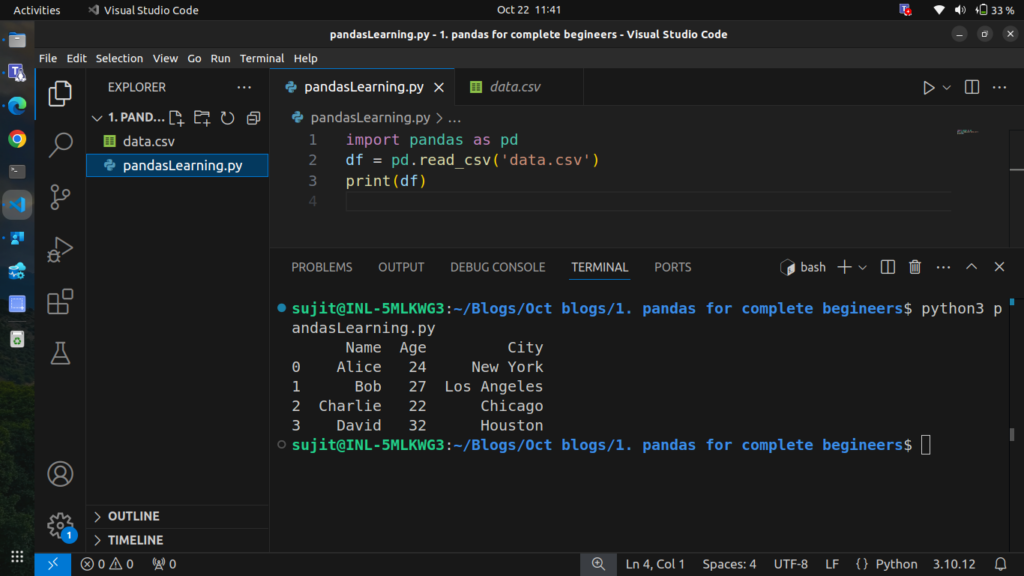
Step 4: Exploring and Understanding Data
Once you have loaded the data, you might want to take a quick look to understand its structure.
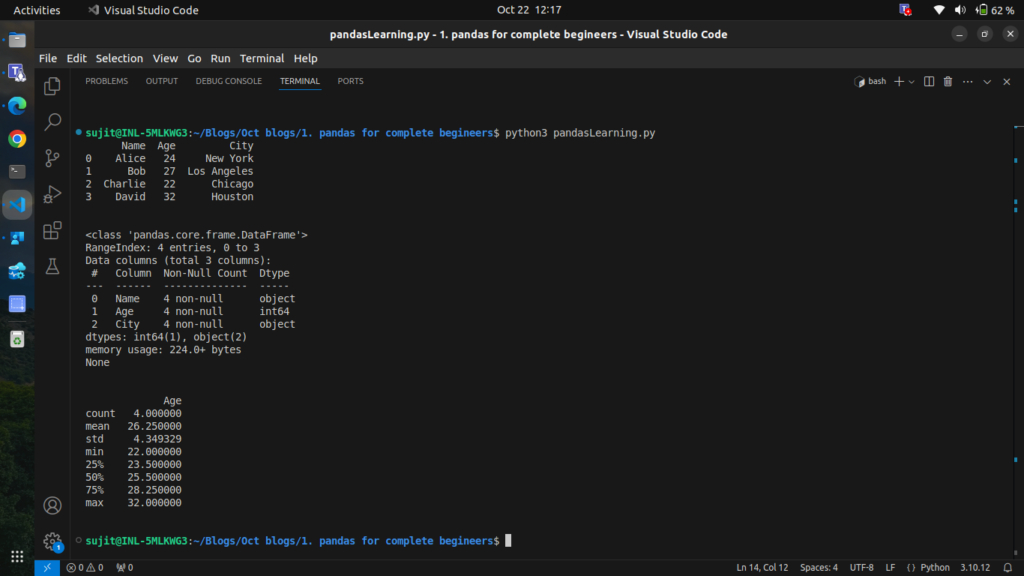
Basic Information
# Show the first few rows of the DataFrame
print(df.head())

# Get a summary of the DataFrame (columns, data types, and non-null counts)
print(df.info())

# Get statistics like mean, min, max, etc. for numeric columns
print(df.describe())
Output
Step 5: Accessing Data in a DataFrame
You can access columns and rows in a DataFrame in multiple ways.
Accessing Columns
You can access a specific column using the column name:
# Access the 'Name' column
print(df['Name'])

# Access multiple columns
print(df[['Name', 'City']])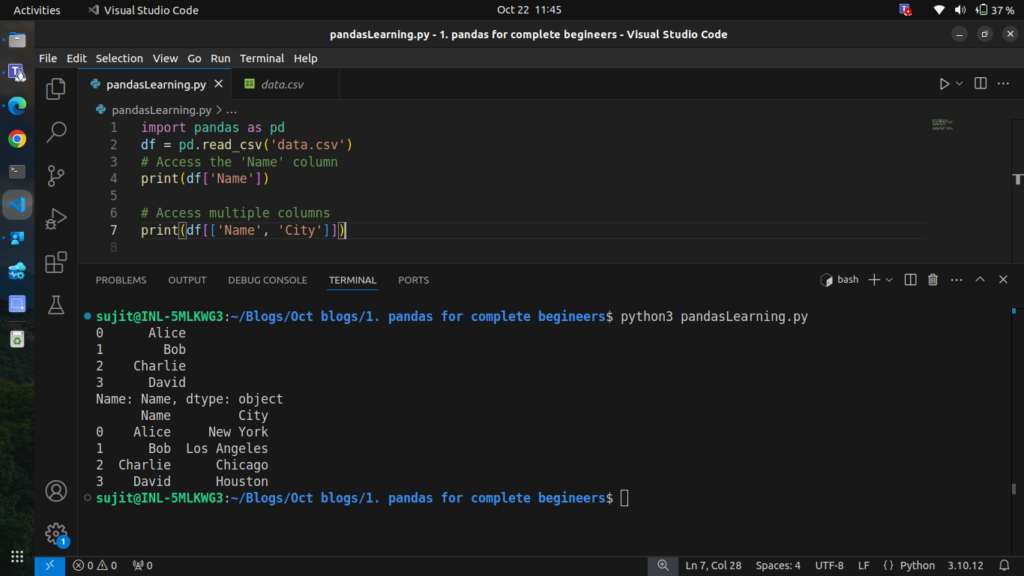
Accessing Rows by Index
You can access rows by using .iloc[] (index-based) or .loc[] (label-based):
# Access the first row
print(df.iloc[0])

# Access a specific row using the label (index)
print(df.loc[1])

# Access a range of rows
print(df.iloc[1:3])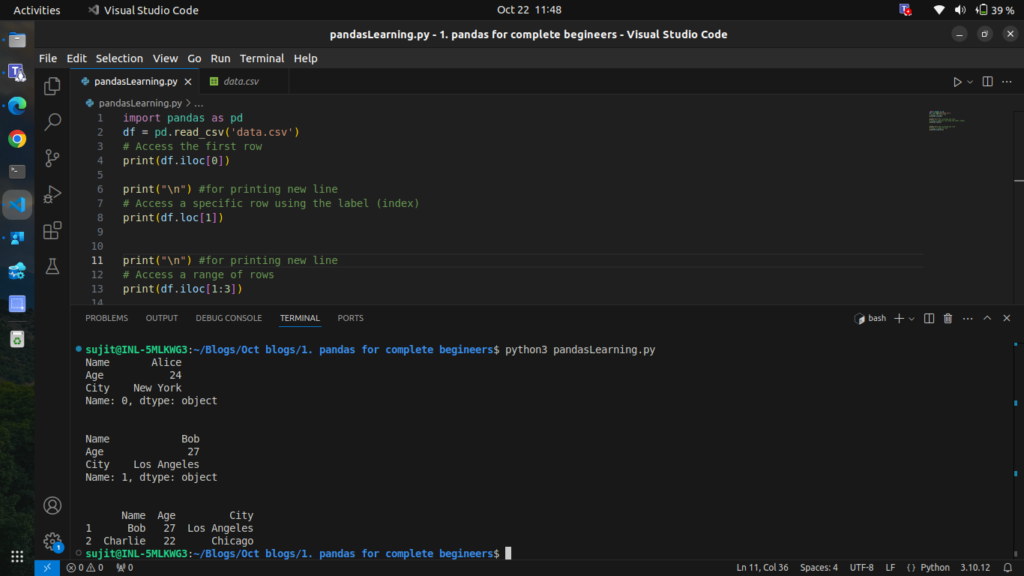
Step 6: Filtering Data
One of the most powerful features of Pandas is the ability to filter data based on conditions.
Filter Rows Based on a Condition
# Filter rows where Age is greater than 25
filtered_df = df[df['Age'] > 25]
print(filtered_df)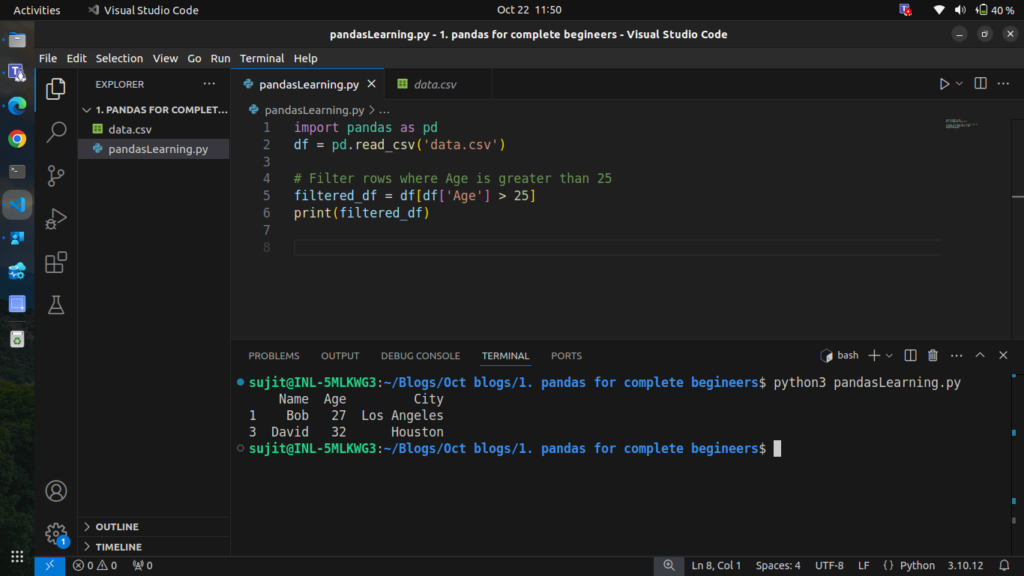
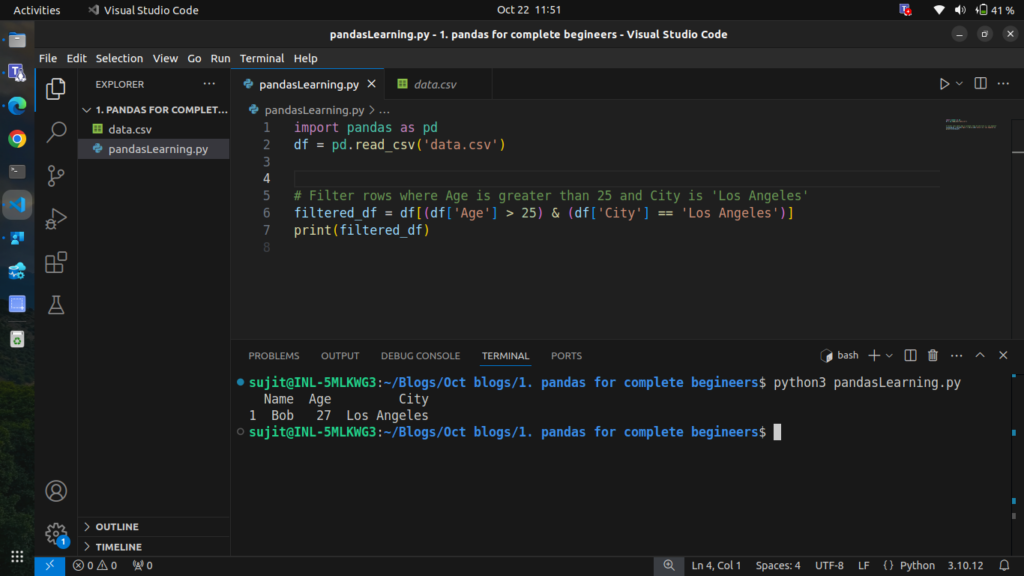
# Filter rows where Age is greater than 25 and City is 'Los Angeles'
filtered_df = df[(df['Age'] > 25) & (df['City'] == 'Los Angeles')]
print(filtered_df)
Step 7: Modifying Data
You can also modify data in your DataFrame.
Adding a New Column
# Add a new column 'Country' with the same value for all rows
df['Country'] = 'USA'
print(df)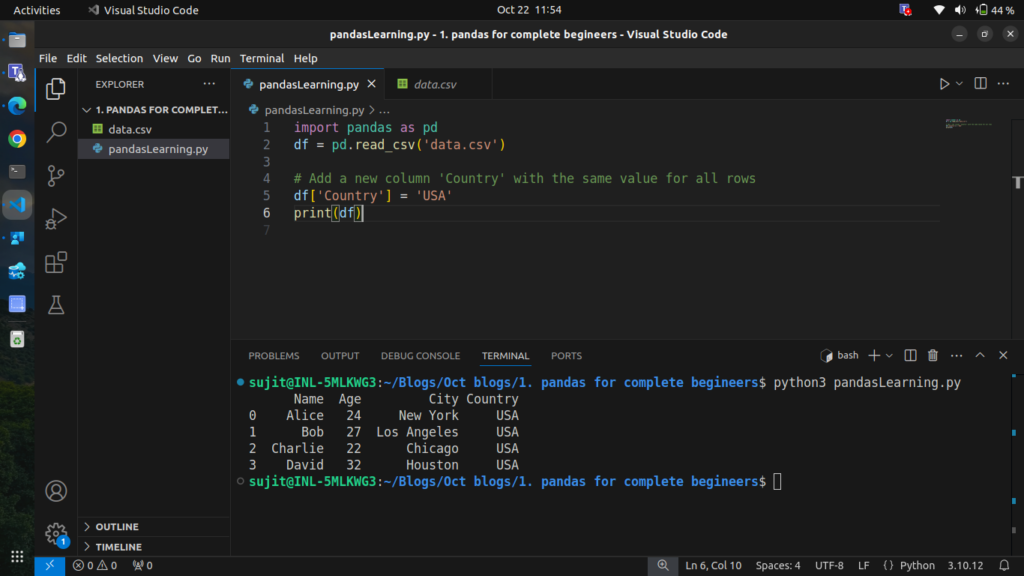
Updating Values in a Column
# Update the 'Age' column by adding 1 to each value
df['Age'] = df['Age'] + 1
print(df)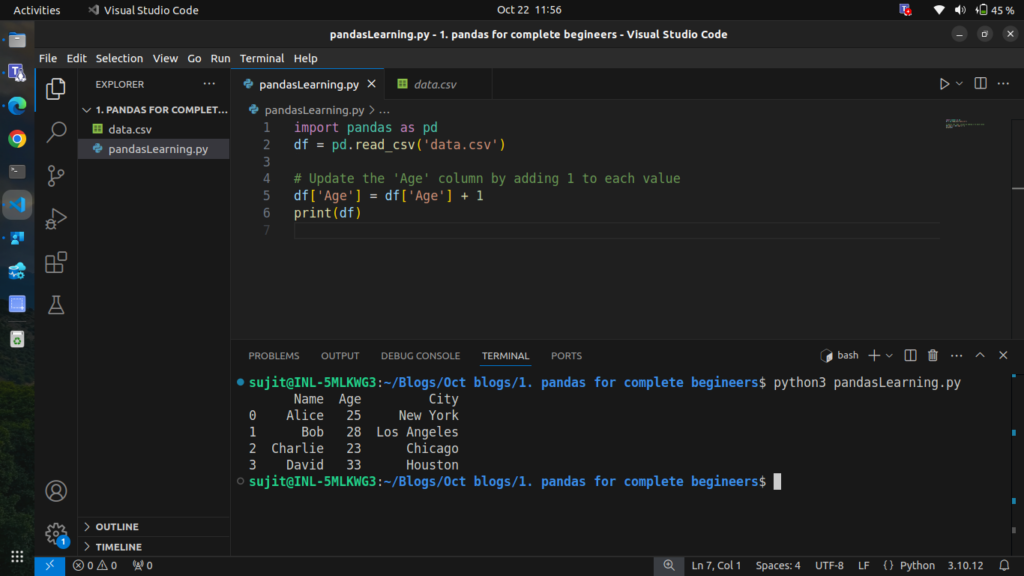
Step 8: Handling Missing Data
Data often contains missing values, and Pandas provides ways to handle them.
Checking for Missing Data
# Check for missing values
print(df.isnull())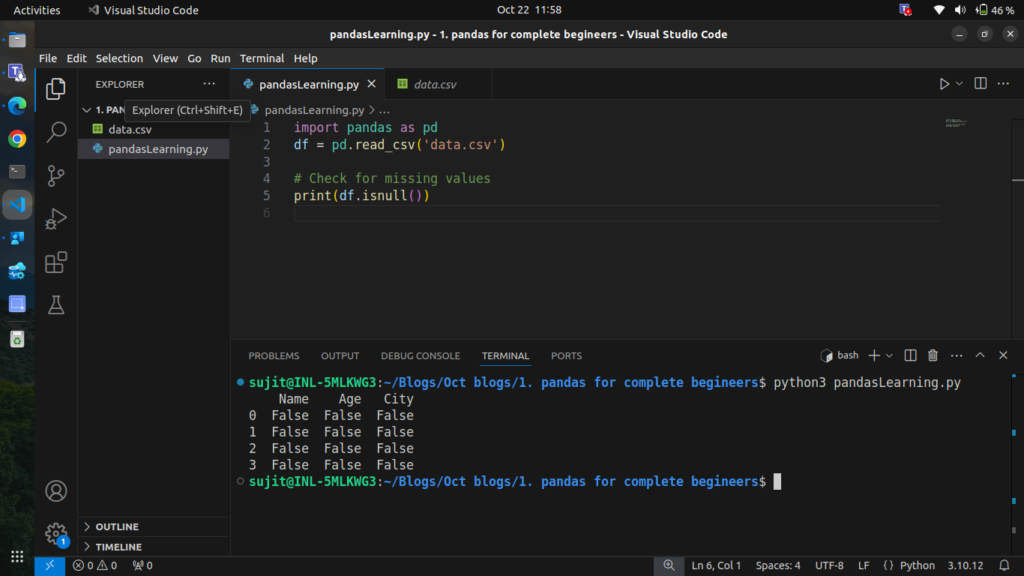
Filling Missing Values
# Fill missing values with a default value
df['Age'].fillna(0, inplace=True)
Dropping Rows with Missing Values
# Drop rows with any missing values
df.dropna(inplace=True)
Step 9: Grouping Data
You can group data by one or more columns using groupby to perform aggregations.
# Group by 'City' and calculate the mean age for each city
grouped = df.groupby('City')['Age'].mean()
print(grouped)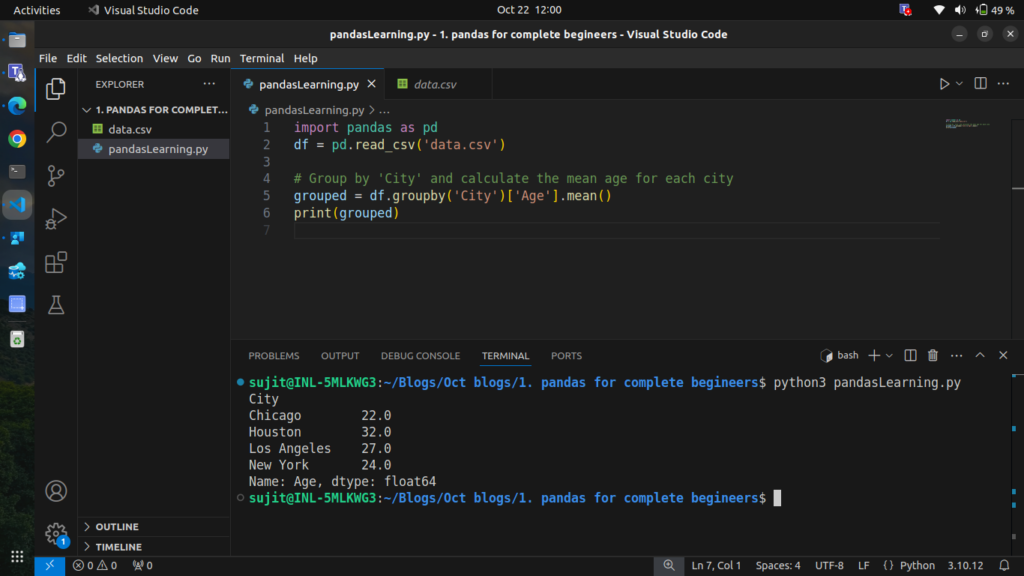
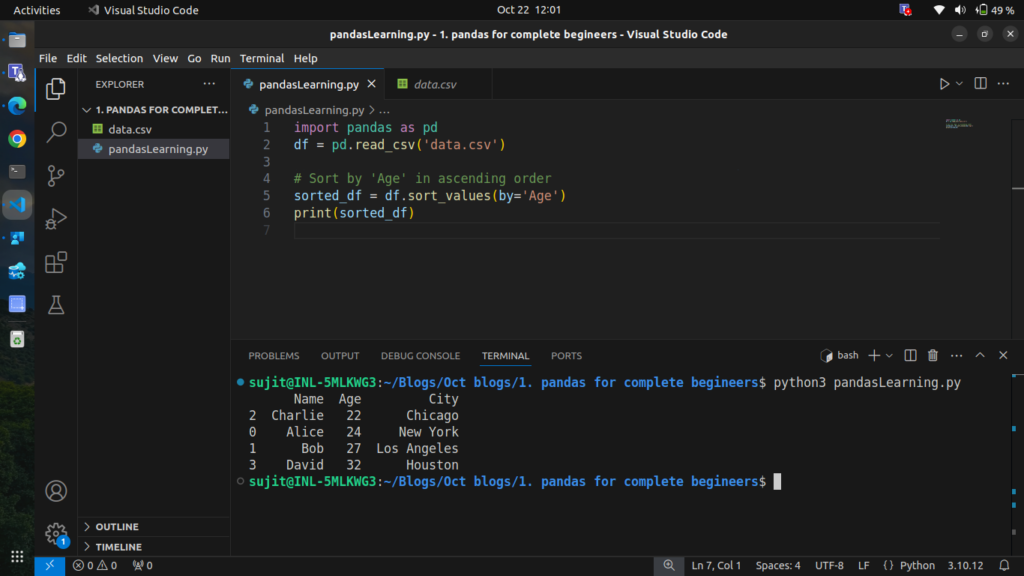
Step 10: Sorting Data
You can sort the DataFrame by a specific column.
# Sort by 'Age' in ascending order
sorted_df = df.sort_values(by='Age')
print(sorted_df)
Step 11: Saving Data to a File
Once you have processed your data, you can save it back to a file.
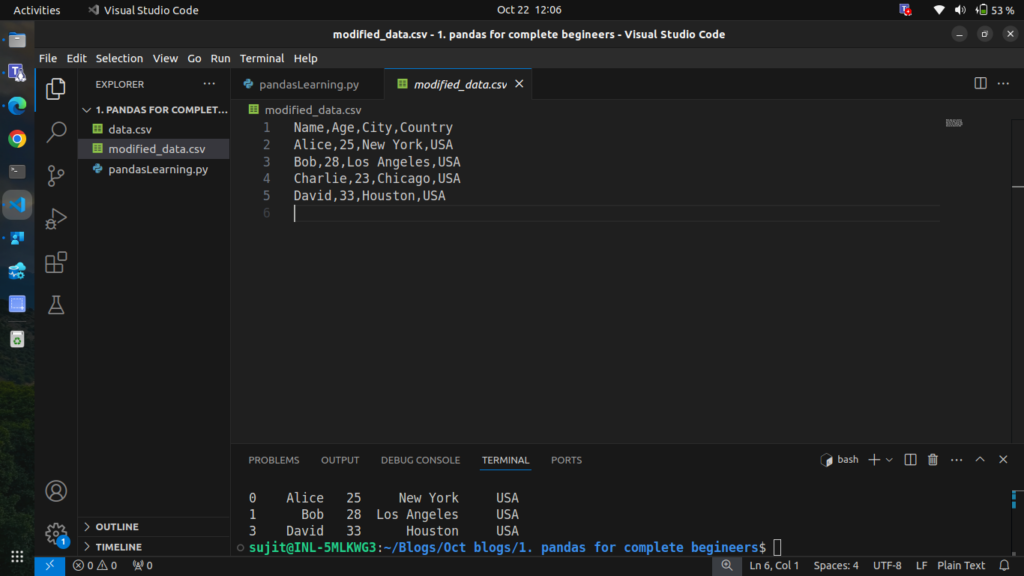
Saving to a CSV File
df.to_csv('modified_data.csv', index=False)this will create new file named “modified_data.csv” with modified or processed data
Conclusion
In this beginner-friendly guide, we covered the essential features of Pandas, such as creating a DataFrame, reading data from files, filtering, modifying, and analyzing data. Pandas is a powerful library and mastering it will allow you to handle and analyze large datasets with ease, we will gonna explore advanced features like merging DataFrames, pivot tables, and more in the upcoming blogs.