


What is Performance Testing?
Performance Testing is a category of Software Testing aimed at assessing the effectiveness of an application when subjected to anticipated workloads. It concentrates on elements of the software, including: Getting Started with Apache JMeter: A Beginner’s Guide.
- Scalability: Checks whether the application can maintain performance levels under varying load conditions.
- Stability: Checks if the application remains stable when subjected to varying loads.
- Speed: Evaluates how quickly the application responds.
Now, let’s dive into our JMeter Tutorial and discover some of the top tools for performance testing. (Getting Started with Apache JMeter: A Beginner’s Guide)
What is JMeter:
Apache JMeter is a widely recognized open-source tool designed to evaluate and analyze the performance of different software applications and services.
It is primarily employed to carry out performance, load, and functional tests on web applications. By simulating heavy loads, JMeter can generate a large number of virtual users to test how well a server handles concurrent requests.

Why Use JMeter:
JMeter is ideal for various testing types, such as
- Load Testing: It simulates numerous virtual users to evaluate how the system performs under stress.
- Performance Testing: Measures key performance indicators like response time and throughput.
- Stress Testing: Evaluates the system by exceeding its capacity to uncover its breaking point.
- Regression Testing: Verifies whether recent changes have negatively impacted performance.
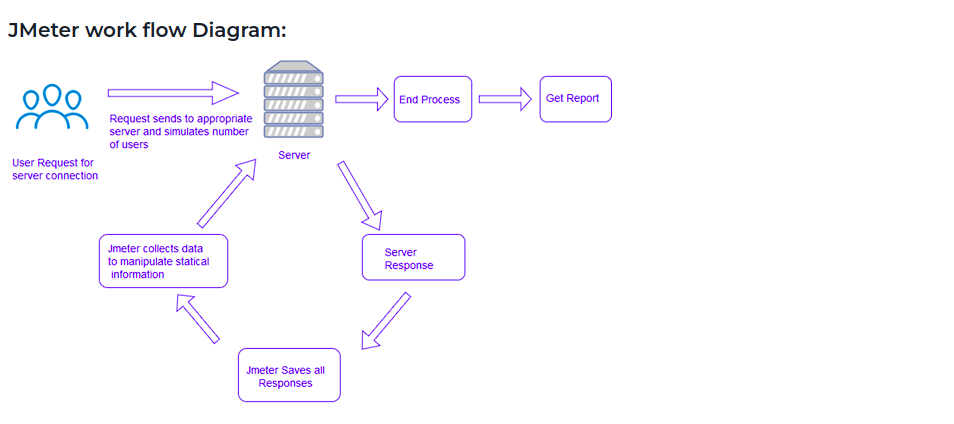
How Does JMeter Perform Testing?
Here are the main steps JMeter follows during performance testing.
- It generates a request and transmits it to the server.
- It receives the server’s response, collects the data, and presents it in graphical formats like charts or graphs.
- It processes the response data from the server.
- It generates the test results in various formats such as Text, XML, or JSON, which helps testers analyze the data efficiently.
Now, let’s continue with the Getting Started with Apache JMeter: A Beginner’s Guide and find out what makes JMeter one of the most preferred tools for performance testing.
Advantages of JMeter:
- Open-source: Being free and open-source, JMeter allows developers to download, modify, and customize the tool as needed.
- User-friendly: JMeter features an easy-to-use graphical interface, allowing users to effortlessly design and set up test plans.
- Wide Support: Though primarily designed for performance testing, JMeter can also support other types of tests such as stress, distribution and web service testing.
- Comprehensive Documentation: JMeter’s thorough documentation ensures that users can easily follow along with each step of the testing process from installation to reporting.
- Recording Capability: JMeter allows users to record HTTP/HTTPS requests and automatically generate test plans using a proxy server.
- Reporting: JMeter generates detailed dashboard reports to help users analyze the results of performance tests.
Pre – Requisites of JMeter
Java Version: JMeter requires Java version 8.0 or higher to function properly.
JMeter Version: Use the latest stable release, such as version 5.6.3.
Key Elements in JMeter
In JMeter, various components are used to build and configure your test plan. Getting Started with Apache JMeter: A Beginner’s GuideThese include:
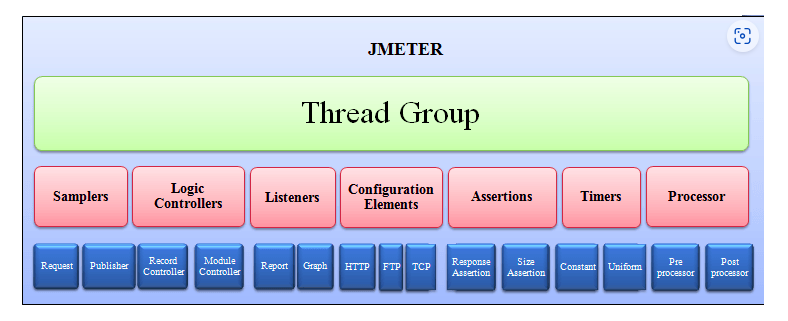
- Test Plan: The primary container that holds all the components and configurations for the testing process.
- Thread Group: Specifies the number of virtual users and the duration of the test.
Samplers: These represent the actual requests sent to the server (e.g., HTTP, FTP, JDBC).
Listeners: Listeners gather and present test results in different formats, including graphs and tables.
Timers: Manage the intervals between requests to mimic the actions of real users.
Pre-Processors and Post-Processors: Perform actions before or after sending requests, such as modifying request parameters or extracting data from responses.
Assertions: Validate that the server’s response meets certain conditions (e.g., status codes or content).
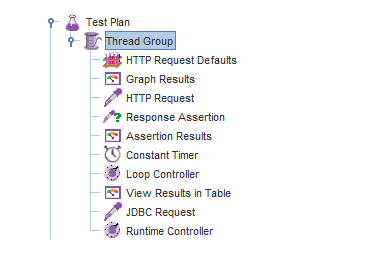
JMeter Test Plan:
A Test Plan in JMeter is a structured configuration that outlines all the steps involved in the testing process. It includes elements like thread groups, samplers, listeners, and more, organized in a logical sequence for execution. Getting Started with Apache JMeter: A Beginner’s Guide
How to Add Elements into JMeter Test Plan:
Adding elements is a crucial part of building a functional test plan in JMeter. To accomplish this in JMeter: Getting Started with Apache JMeter: A Beginner’s Guide
- To start building your test plan, perform a right-click on the Test Plan element in the JMeter interface.
- Choose Add to insert new components such as thread groups, listeners, samplers, and more.
For instance:
After right-clicking on the Test Plan, select Add > Config Element > Java Request Defaults. This configuration element allows you to define default parameters for Java requests in the test plan.
Create a Test Plan:
Follow these steps to create a basic test plan in JMeter.
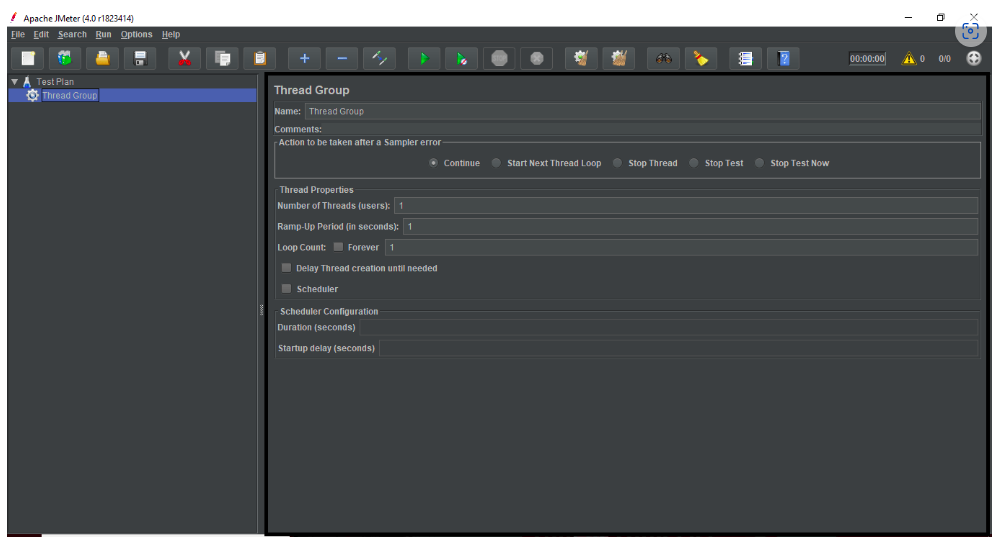
Step 1: To create a Test Plan in JMeter:
Open JMeter and perform a right-click on the Test Plan section.
Add > Threads (Users) > Thread Group
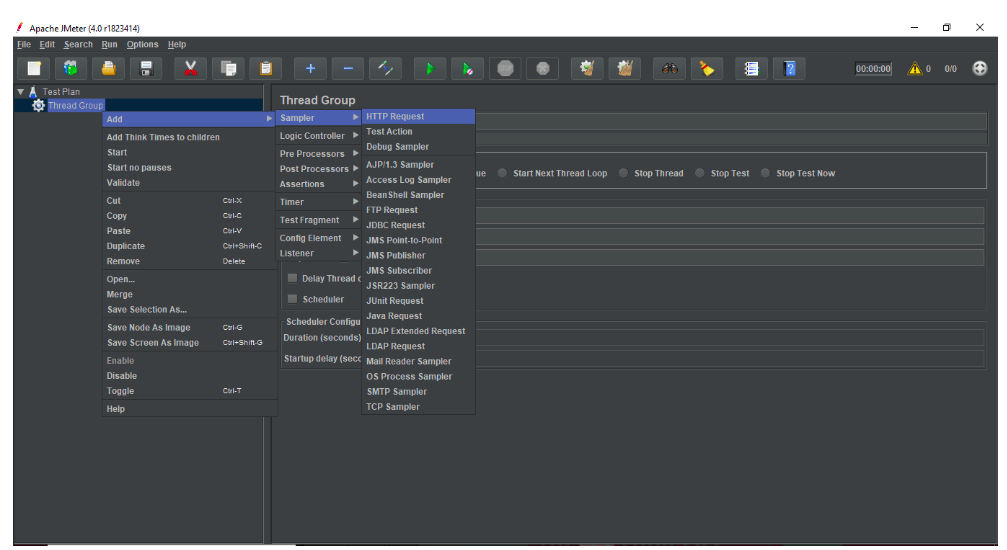
Step 2: Add a Sampler:
Next, right-click on the Thread Group and choose Add > Sampler > HTTP Request.
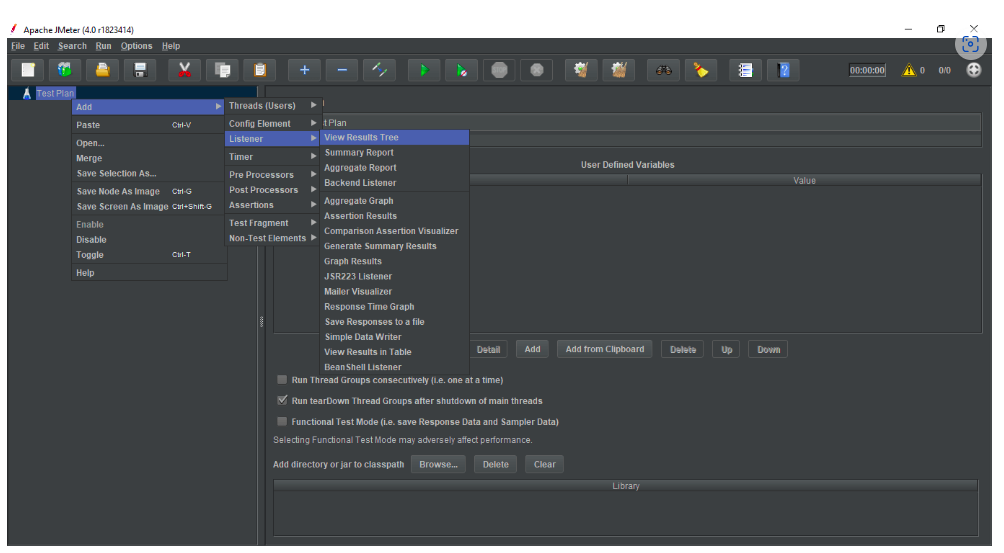
Step 3: Add a Listener:
Right-click on the Thread Group and select Add > Listener > View Results Tree to include it.
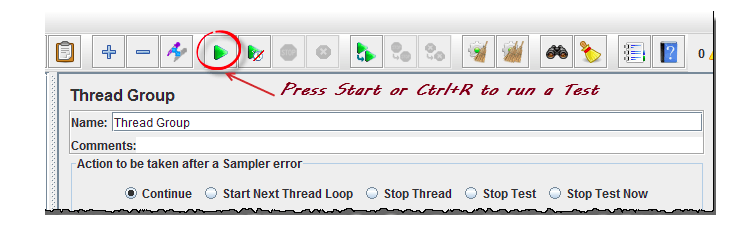
Step 4: Start the Test:
Select the green Start button to begin the test execution.
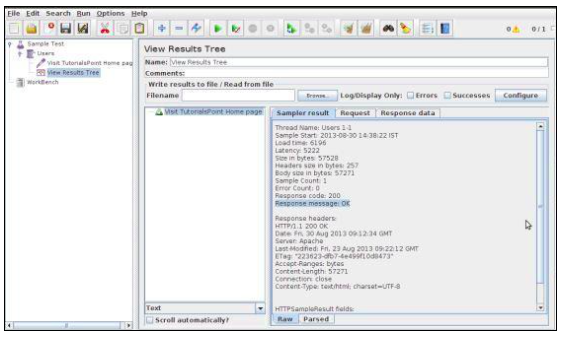
Step 5: Analyzing Results:
JMeter offers several types of listeners to assess and analyze the test’s performance.
1. View Results Tree: Displays the details of each request, including the response data response time, and status.
2. Graph Results: Shows a graph with response times, helping to visualize the performance of your system.
3. Summary Report: Provides aggregated statistics like average response time, throughput, and error percentage.
Conclusion:
Apache JMeter is an incredibly powerful and versatile tool for performance testing. Whether you’re conducting load, stress, or functional testing, JMeter offers a simple yet effective way to simulate user behavior, measure performance, and analyze test results. With its intuitive interface and ability to handle large-scale tests, JMeter has become a go-to solution for software testers worldwide.
you can begin creating your own test plans and conducting performance tests on your applications. As you grow more comfortable with JMeter, you’ll uncover more advanced features like distributed testing and scripting for complex scenarios.
References :