


In today’s data-driven world, businesses need real-time insights to make informed decisions. Traditional batch processing is often insufficient for such demands, and real-time analytics pipelines have emerged as a solution. Confluent Kafka, an enterprise-ready version of Apache Kafka, provides robust tools to build these pipelines efficiently. In this blog, we’ll explore how to build a real-time analytics pipeline with Confluent Kafka, complete with code examples.
Understanding Real-Time Analytics Pipelines
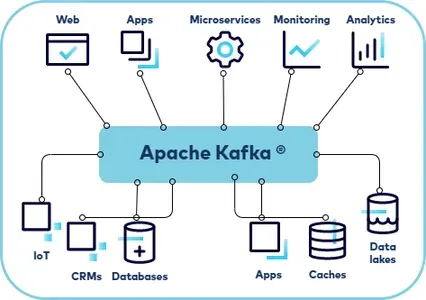
A real-time analytics pipeline ingests, processes, and analyzes data as it’s generated. Key components include:
- Data Ingestion: Capturing data from various sources like IoT devices, databases, or logs.
- Stream Processing: Transforming or aggregating the data in motion.
- Data Storage: Storing the processed data for visualization or further analysis.
- Visualization: Displaying insights through dashboards or reports.
Why Confluent Kafka?
Confluent Kafka enhances Apache Kafka with features such as:
- Schema Registry: Ensures data consistency using schemas.
- Kafka Connect: Simplifies integration with various systems.
- ksqlDB: Enables SQL-like stream processing.
- Enterprise-grade security: Offers encryption, authentication, and authorization.
Setting Up Confluent Kafka
Before building the pipeline, set up a Confluent Kafka environment.
- Install Confluent Platform Download and install the Confluent Platform from Confluent’s website.
- Start Confluent Kafka
confluent local services startThis starts all the necessary services, including Kafka brokers, Schema Registry, and ksqlDB. - Verify Installation Check the status of services:
confluent local services status
Building the Pipeline
Let’s build a pipeline that ingests sensor data, processes it to calculate averages, and visualizes the results.
Step 1: Data Ingestion
Create a Kafka topic to hold raw sensor data.
kafka-topics --create \
  --topic sensor-data \
  --bootstrap-server localhost:9092 \
  --partitions 3 \
  --replication-factor 1
Use a Kafka producer to send sensor data.
from confluent_kafka import Producer
import json
import time

producer = Producer({'bootstrap.servers': 'localhost:9092'})

def delivery_report(err, msg):
    if err:
        print(f"Delivery failed: {err}")
    else:
        print(f"Message delivered to {msg.topic()} [{msg.partition()}]")

# Simulate sensor data
while True:
    data = {
        "sensor_id": "sensor_1",
        "timestamp": int(time.time()),
        "temperature": 25 + (5 * time.time() % 5)
    }
    producer.produce(
        'sensor-data',
        key=data['sensor_id'],
        value=json.dumps(data),
        callback=delivery_report
    )
    producer.flush()
    time.sleep(1)
Step 2: Stream Processing
Use ksqlDB to process the stream. Start the ksqlDB CLI:
ksql http://localhost:8088
Create a ksqlDB stream to consume raw data.
CREATE STREAM raw_sensor_data (
    sensor_id VARCHAR,
    timestamp BIGINT,
    temperature DOUBLE
) WITH (
    KAFKA_TOPIC='sensor-data',
    VALUE_FORMAT='JSON');
Aggregate data to calculate the average temperature.
CREATE TABLE avg_temperature AS
SELECT
    sensor_id,
    AVG(temperature) AS avg_temp
FROM raw_sensor_data
WINDOW TUMBLING (SIZE 1 MINUTE)
GROUP BY sensor_id;
Step 3: Data Storage
Store the processed data in a sink like Elasticsearch. Use Kafka Connect to set up the sink.
- Install Kafka Connect Elasticsearch Plugin
confluent-hub install confluentinc/kafka-connect-elasticsearch:latest - Configure the Connector Create a configuration file
elasticsearch-sink.properties:name=elasticsearch-sink connector.class=io.confluent.connect.elasticsearch.ElasticsearchSinkConnector topics=avg_temperature connection.url=http://localhost:9200 type.name=kafka-connect key.ignore=true schema.ignore=true - Start the Connector
connect-standalone /path/to/connect-standalone.properties elasticsearch-sink.properties
Step 4: Visualization
Use Kibana or Grafana to visualize the data stored in Elasticsearch. For example, in Kibana:
- Add the Elasticsearch index.
- Create visualizations like line charts or heatmaps to monitor temperature trends.
Monitoring and Scaling
Use Confluent Control Center to monitor your Kafka cluster and pipelines. It provides metrics on topic throughput, consumer lag, and more.
Code Repository
You can find the complete code and configuration files in this GitHub repository.
Conclusion
Building a real-time analytics pipeline with Confluent Kafka is a powerful way to process and analyze data as it’s generated. By leveraging tools like ksqlDB and Kafka Connect, you can simplify complex workflows and focus on deriving actionable insights. Start experimenting with Confluent Kafka today and unlock the potential of real-time data.
That’s it for now. I hope this blog gave you some useful insights. Please feel free to post a comment, question or suggestion.