


Graphana is an open source tool . It allows users to see their data in the dashboard in the form of charts and graphs to Grafana Setup Guide. This helps end user to analyse their report easily. Setting up a Grafana dashboard for Appium test results can be a valuable way to visualize and monitor the performance and health of your mobile app testing. Grafana is an open-source tool used for monitoring and analyzing data, while Appium is an open-source automation tool used for mobile app testing. By integrating the two, you can easily track and visualize your test results. Here’s a step-by-step guide to help you set it up Grafana Setup Guide
1: Install and configure Grafana:
- Download Grafana from the official website: https://grafana.com/get for Grafana Setup Guide
- Install Grafana by running the following commands:
wget -q -O - https://packages.grafana.com/gpg.key | sudo apt-key add -
sudo apt update
sudo apt install grafana - Start the Grafana server:
sudo systemctl start grafana-server - Grafana server status command:
sudo systemctl status grafana-server - Enable Grafana to start on boot:
sudo systemctl enable grafana-server - Access the Grafana dashboard by opening your web browser and navigating to http://localhost:3000 (or the custom port you set during installation).
- Log in to Grafana using the default credentials (username: admin, password: admin). We can change the password after login.
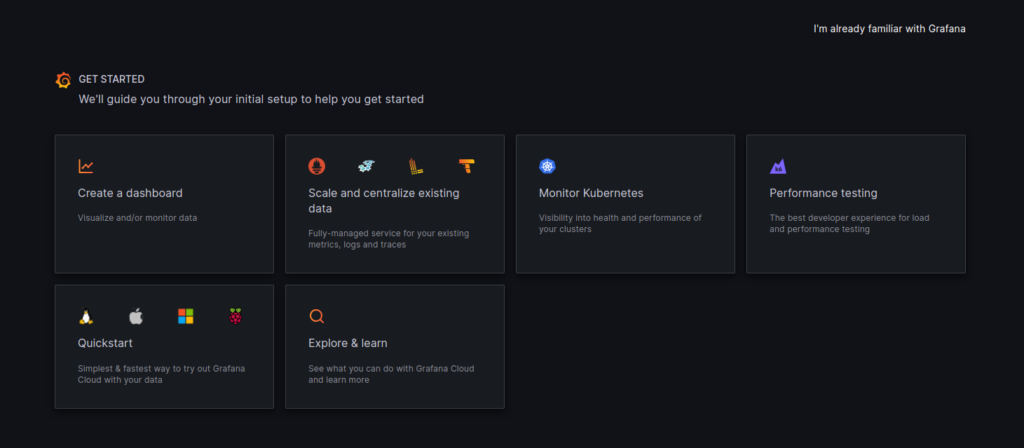
This is how your dashboard should look like
2: Set up a data source:
- Click on “Configuration” then select “Data Sources.”
- In the Configuration menu, select “Data Sources” under the “Configuration” section.
- Click on “Add data source” button to add a new data source.
- Choose the appropriate data source type from the list of available options. Grafana supports various data sources such as Graphite, Prometheus, InfluxDB, Elasticsearch, and more.
- Following are the steps to install InfluxDB
- wget qO https://repos.influxdata.com/influxdb… | sudo apt-key add –
- source /etc/lsb-release
- echo “deb https://repos.influxdata.com/debian $(lsb_release -cs) stable” | sudo tee /etc/apt/sources.list.d/influxdb.list
- sudo apt-get update && sudo apt-get install influxdb
- sudo systemctl unmask influxdb.service
- sudo systemctl start influxdb
- influxd -config /etc/influxdb/influxdb.conf
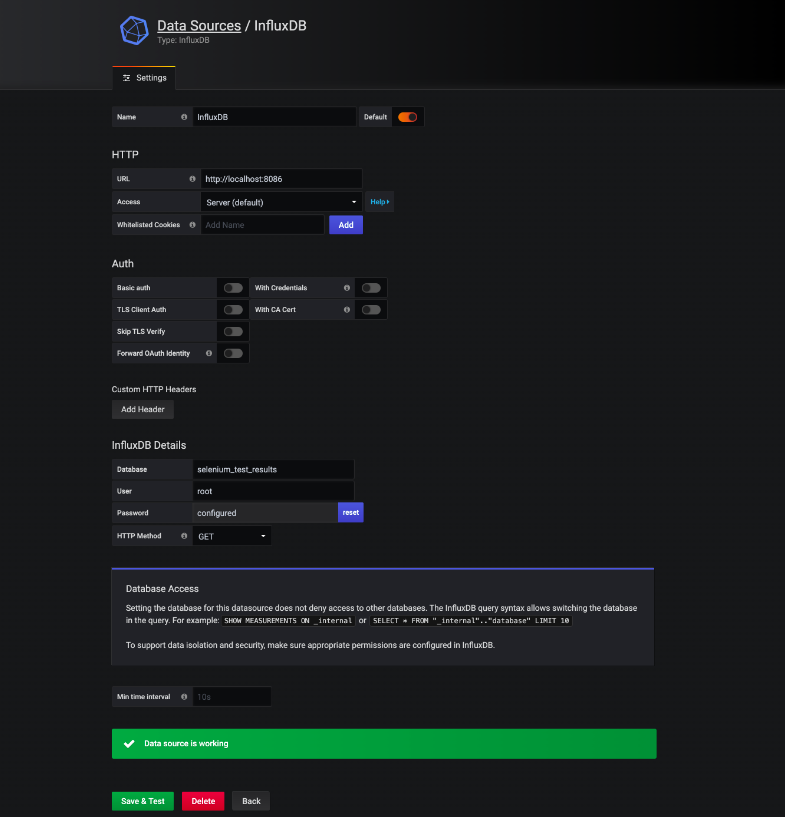
- Configure the data source and add name, URL, access, and authentication settings specific to the selected data source type. The configuration options may vary depending on the data source type chosen.
- Test the connection to the data source by clicking on the “Save & Test” button. Grafana will attempt to connect to the data source using the provided settings and display a success or failure message.
- If the connection is successful, click on the “Save & Test” button again to save the data source configuration
3: Prepare the data for visualization:
- Make sure your Appium test results are being recorded and stored in the selected data source. If they are not already being collected, you can set up your test scripts to send results to the data source.
- Add influxDB java client library in pom.xml
<dependency>
            <groupId>org.influxdb</groupId>
            <artifactId>influxdb-java</artifactId>
            <version>2.23</version>
 </dependency>
- Use the InfluxDB java client to write to InfluxDB
import org.influxdb.InfluxDB;
import org.influxdb.InfluxDBFactory;
import org.influxdb.dto.Point;
public class AppiumTestMetrics {
private static final String INFLUX_DB_URL = "http://localhost:3000";
private static final String INFLUX_DB_USERNAME = "influxdbusername";
private static final String INFLUX_DB_PASSWORD = "influxdbpassword";
private static final String INFLUX_DB_DATABASE = "nfluxdbdatabase";
public static void main(String[] args) {
    InfluxDB influxDB = InfluxDBFactory.connect(INFLUX_DB_URL, INFLUX_DB_USERNAME, INFLUX_DB_PASSWORD);
    influxDB.setDatabase(INFLUX_DB_DATABASE);
    String testName = "test1";
    String testStatus = "pass";

    Point datapoint = Point.measurement("test_results")
            .tag("test_name", testName)
            .addField("test_status", testStatus)
            .addField("test_duration", testDuration)
            .build();
    influxDB.write(point);
    influxDB.close();
}
}
4: Create a Grafana dashboard:
- To create a new Grafana dashboard, click on the “+” icon in the left sidebar, then select “Dashboard” -> “New.”
- Choose “Add Panel” and select the visualization type (e.g., graph, table, singlestat) that suits your needs.
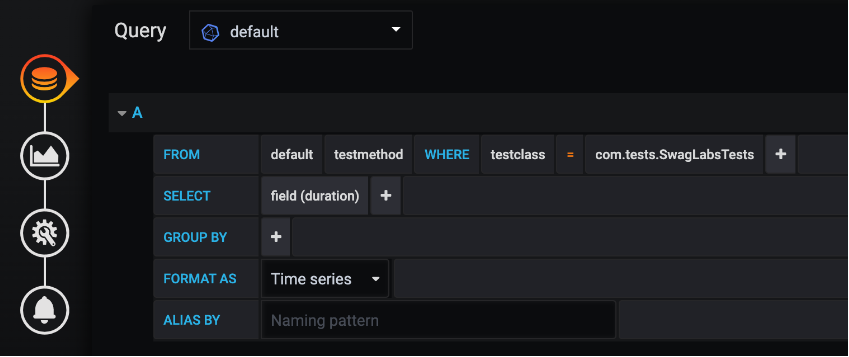
- Configure the panel settings and select the appropriate data source you set up earlier.
- Customize the queries and visualizations according to the data you want to display. For example, you can create a graph to visualize test execution times over time or a table to display the latest test results.
- Continue adding more panels as needed to create a comprehensive dashboard.
5: Organize your dashboard:
- Arrange the panels as needed to create a well-organized dashboard layout. You can drag and drop the panels to rearrange them.
- Use folders to organize multiple dashboards related to different aspects of your testing, such as regression testing, performance testing, or different test environments.
6: Share and collaborate:
- Once you’ve set up your Grafana dashboard for Appium test results, you can share it with your team members to promote collaboration and keep everyone informed about the testing progress.
- Grafana provides options to create shareable links, embed the dashboard in other applications, or export it in PDF format.
That’s it! You now have a functional Grafana dashboard to visualize and monitor your Appium test results. You can further customize and refine the dashboard based on your specific requirements and needs. Remember to keep your Grafana server secure and regularly maintain it to ensure smooth performance and data accuracy.Graphana is an open source tool and can be used easily.
References
https://grafana.com/docs/grafana/latest/administration/data-source-management/