


In this tutorial, we will walk through building an AWS-based CI/CD pipeline from scratch. You’ll learn how to provision AWS infrastructure using Terraform, set up Jenkins, and implement CI/CD pipelines for a Microservices Application (MSA) running on EKS. Finally, we will monitor the system using Prometheus and Grafana.
In this part, we focus on setting up the infrastructure, installing Jenkins, and creating CI jobs for the frontend and backend.
1. Set Up AWS Infrastructure with Terraform
We will deploy AWS infrastructure using Terraform via this repository: sd5976_aws_infrastructure
First, we will create an IAM User. In this example, I will create an IAM user named sd5976.
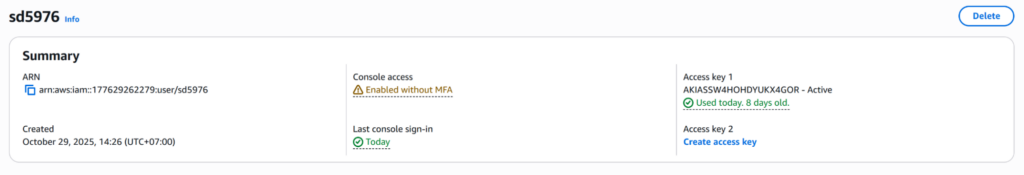
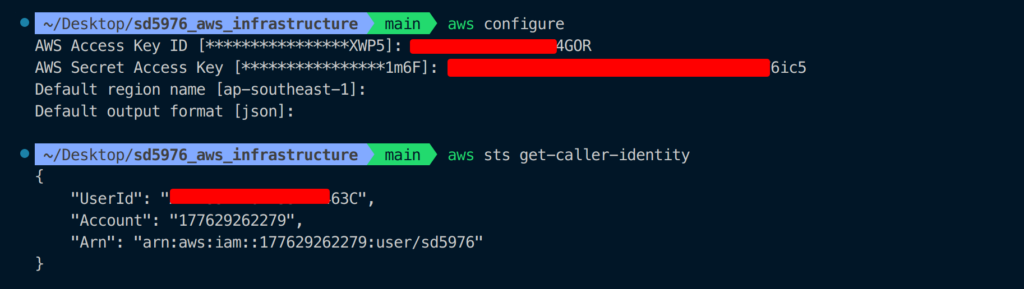
Configure the user locally via AWS CLI using Access Key and Secret Access Key.
Go to sd5976_aws_infrastructure/terraform, run terraform init to initialize the infrastructure.
cd sd5976_aws_infrastructure/terraform
terraform init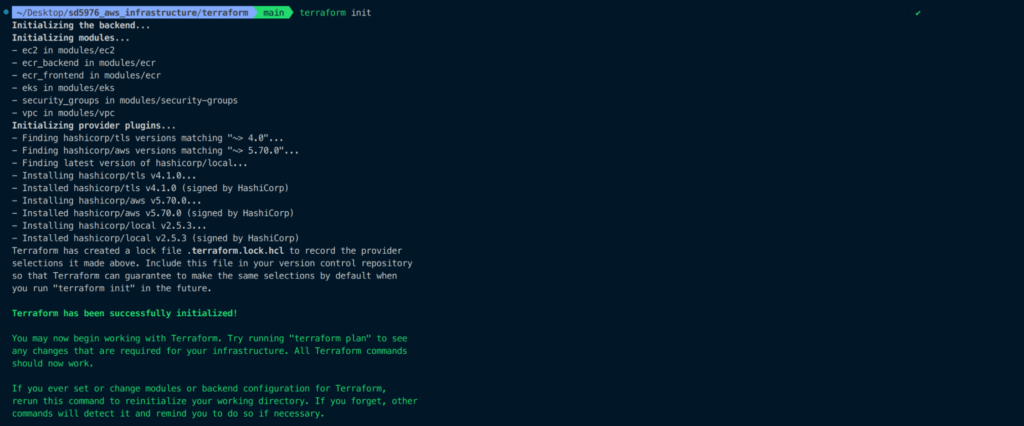
Use terraform fmt and terraform validate to format and check your code.
terraform fmt
terraform validate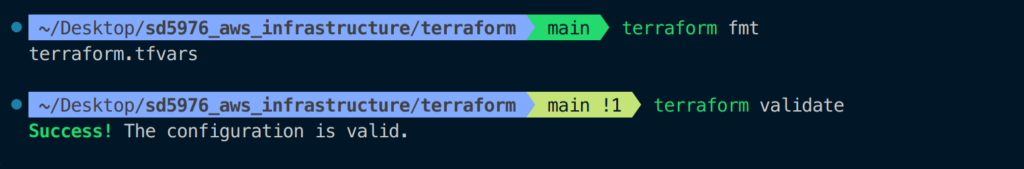
Run terraform plan to preview resources that will be created.
terraform plan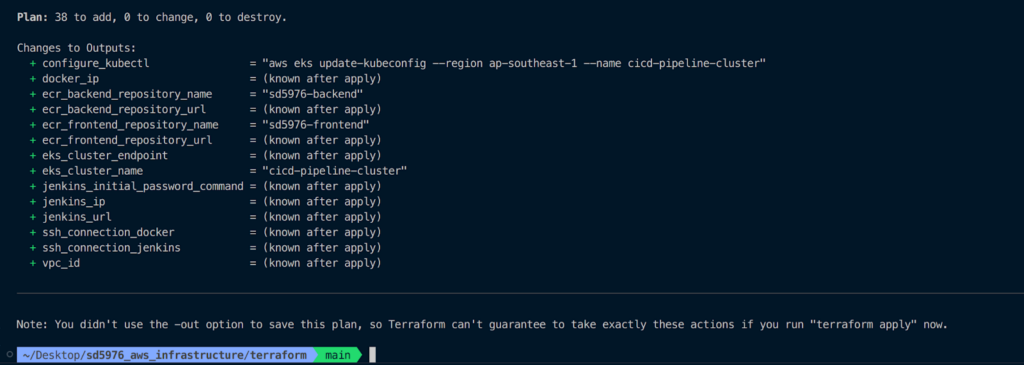
Execute terraform apply to deploy the resources.
terraform applyType yes to confirm.
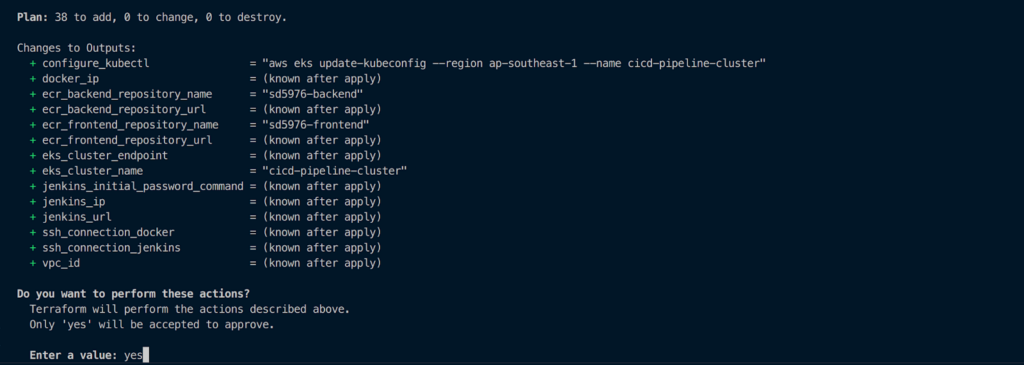
Resource creation may take around 20 minutes or more.
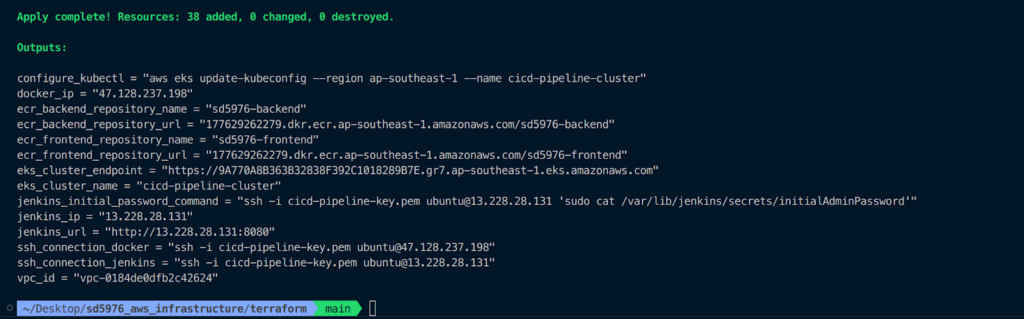
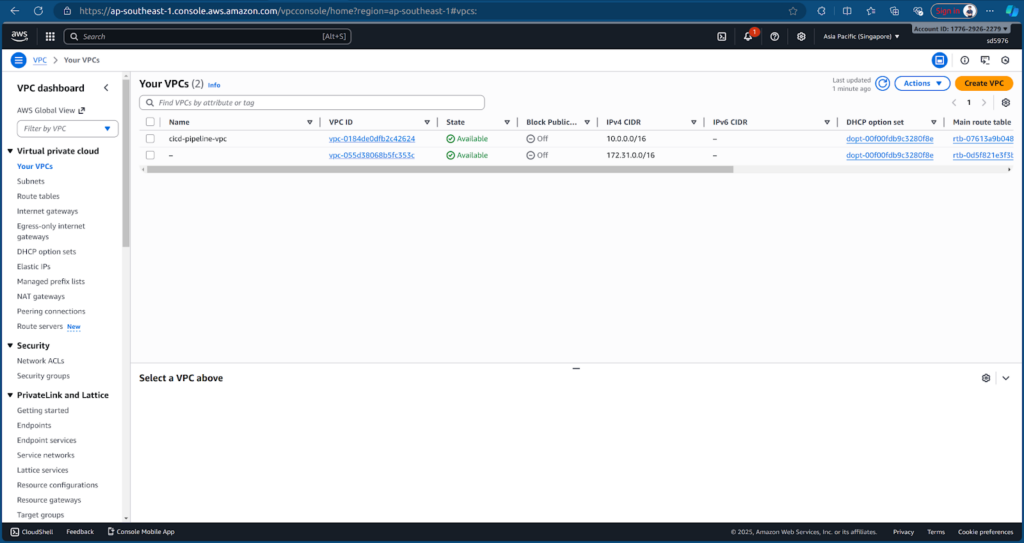
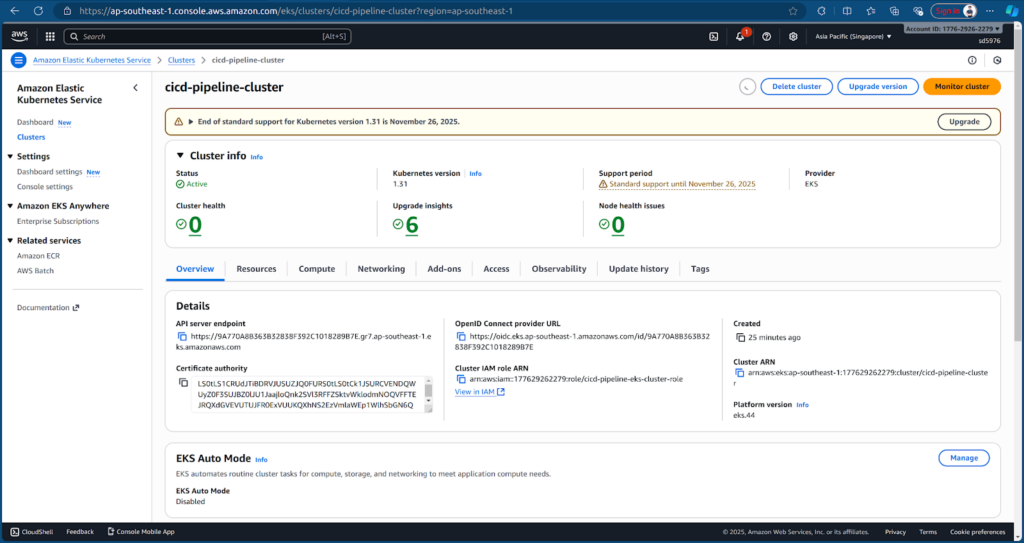
After applying, you can see the following resources on AWS:
VPC
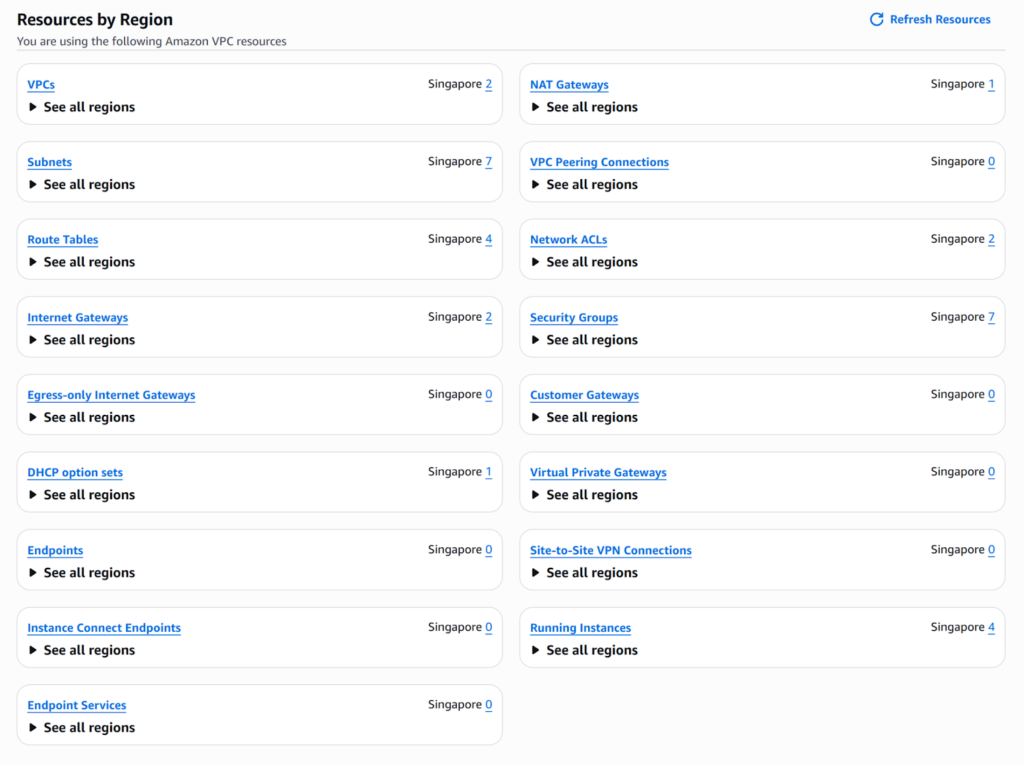
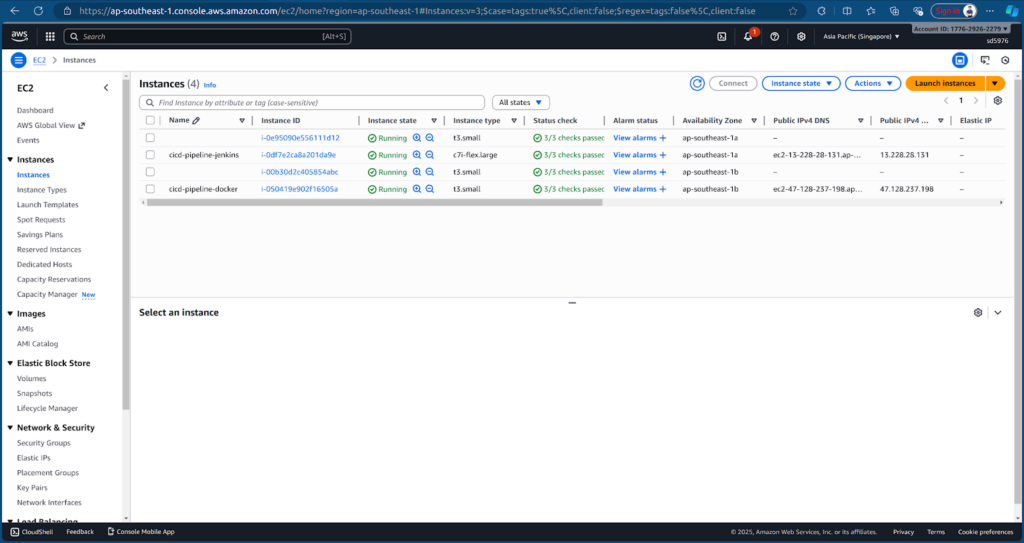
EC2
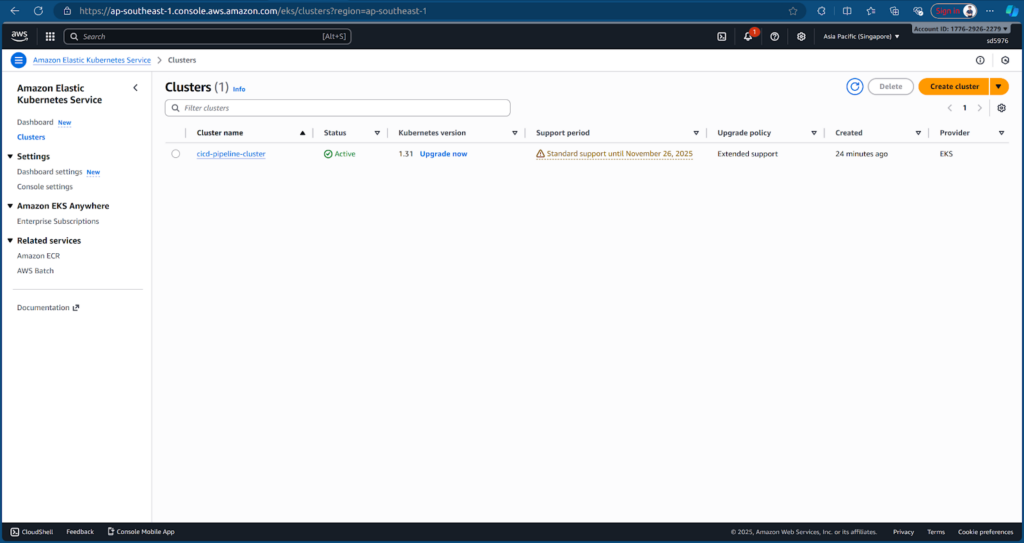
EKS
2. Access Jenkins
Terraform has already created an EC2 instance with Jenkins installed. Access Jenkins at: http://13.228.28.131:8080/
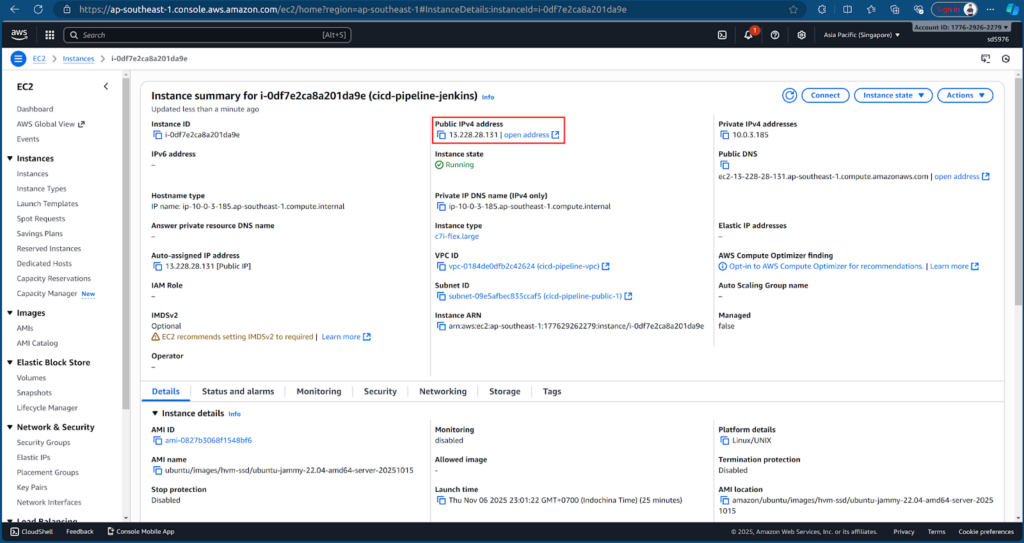

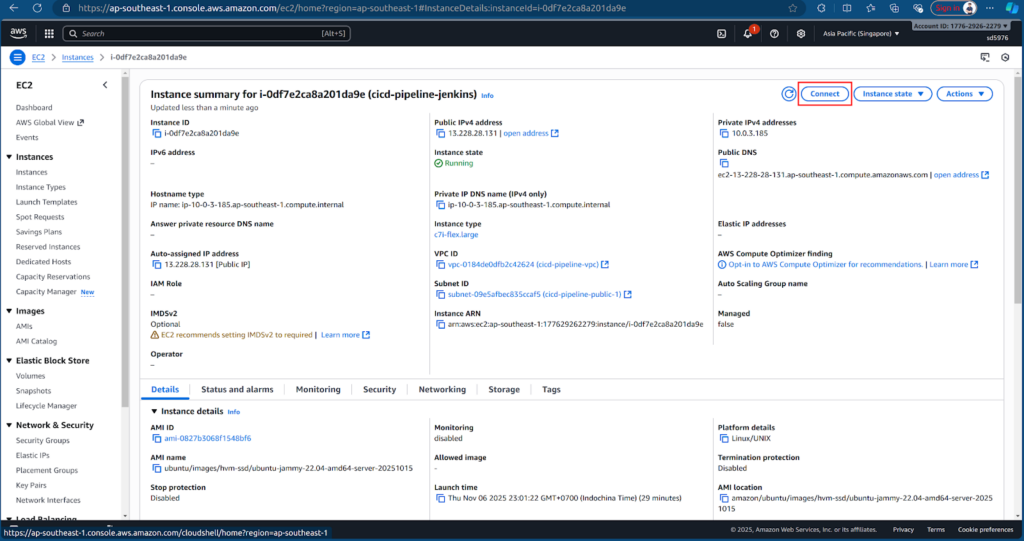
To get the Initial Admin Password, we need to connect to the EC2 instance cicd-pipeline-jenkins.
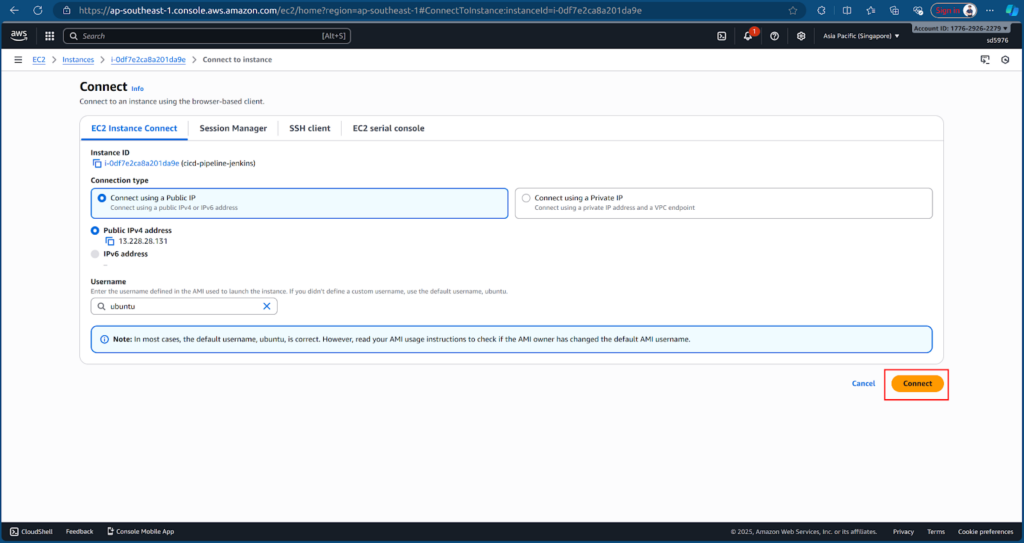
Retrieve the initial admin password:
sudo cat /var/lib/jenkins/secrets/initialAdminPassword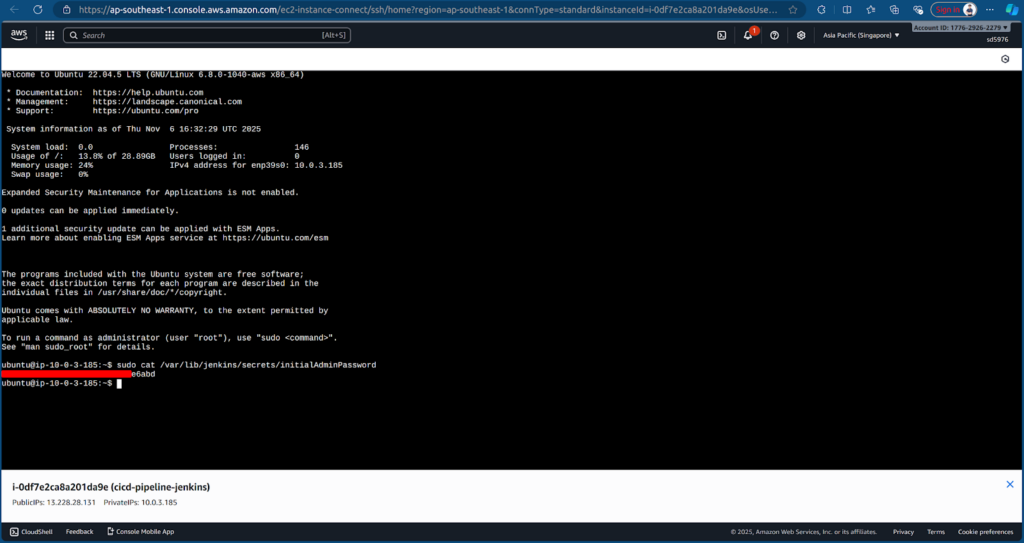
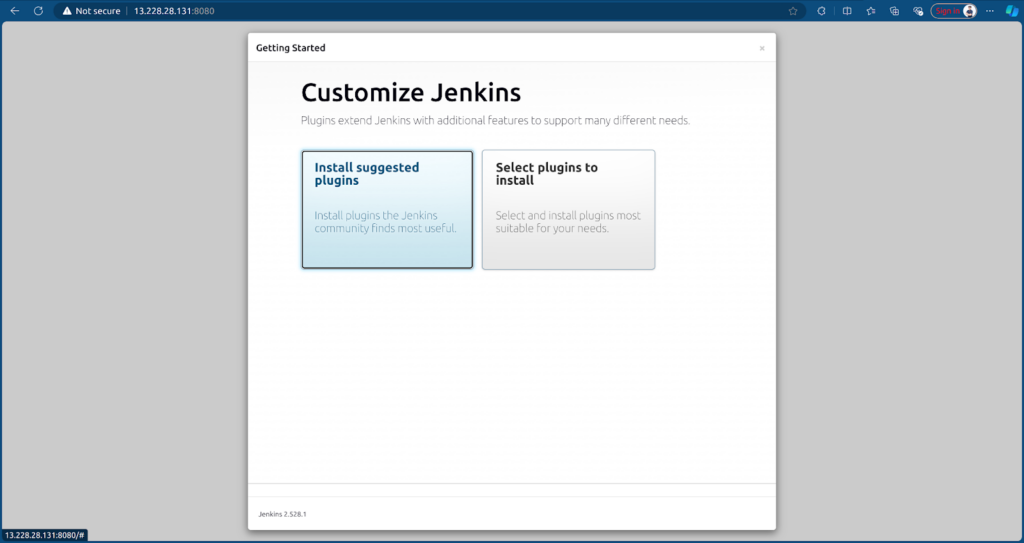
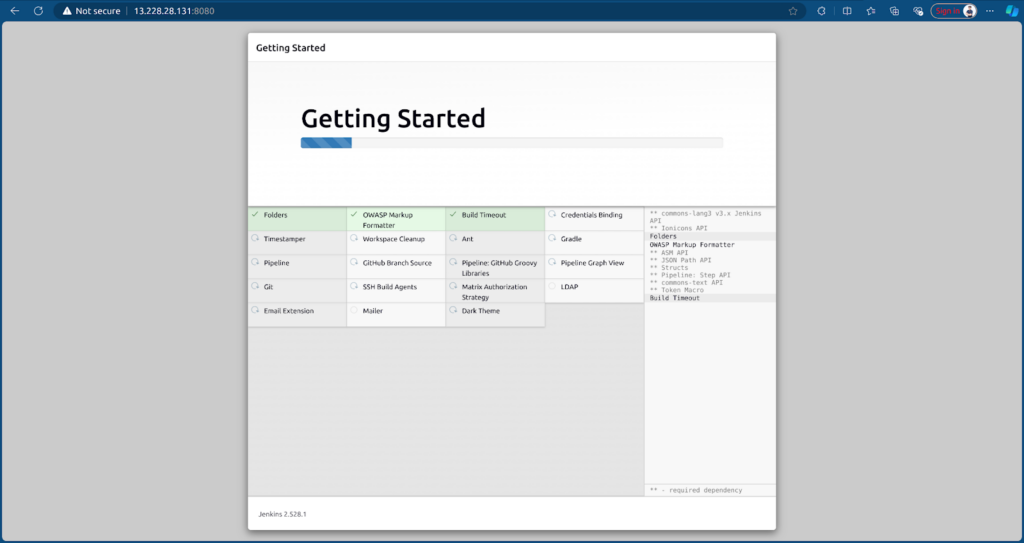
Copy the password, paste it into Jenkins UI, and select Install suggested plugins.
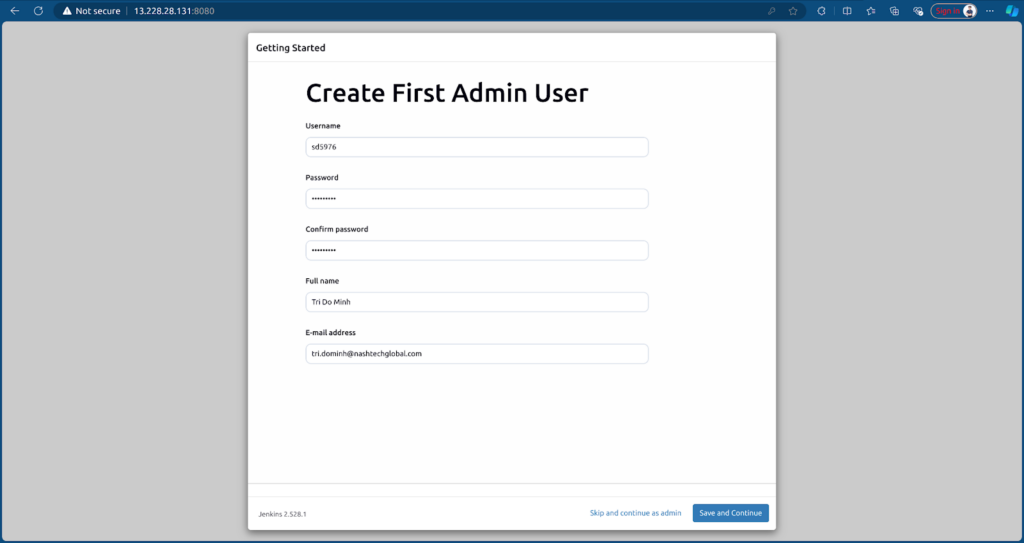
After installation, create an Admin User to log in to the dashboard.
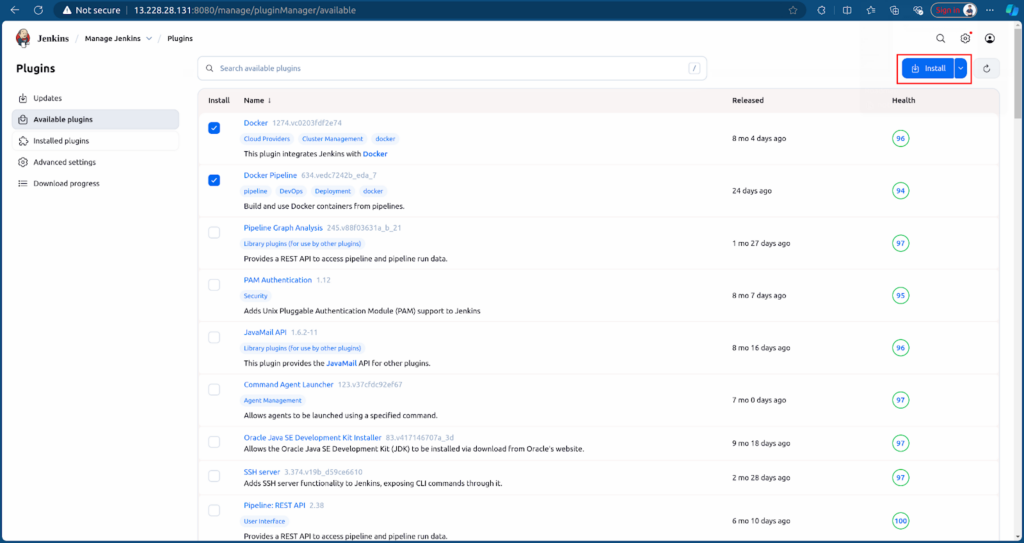
To run CI/CD, we need to install some plugins:
- Docker
- Docker Pipeline
- Pipeline: AWS Steps
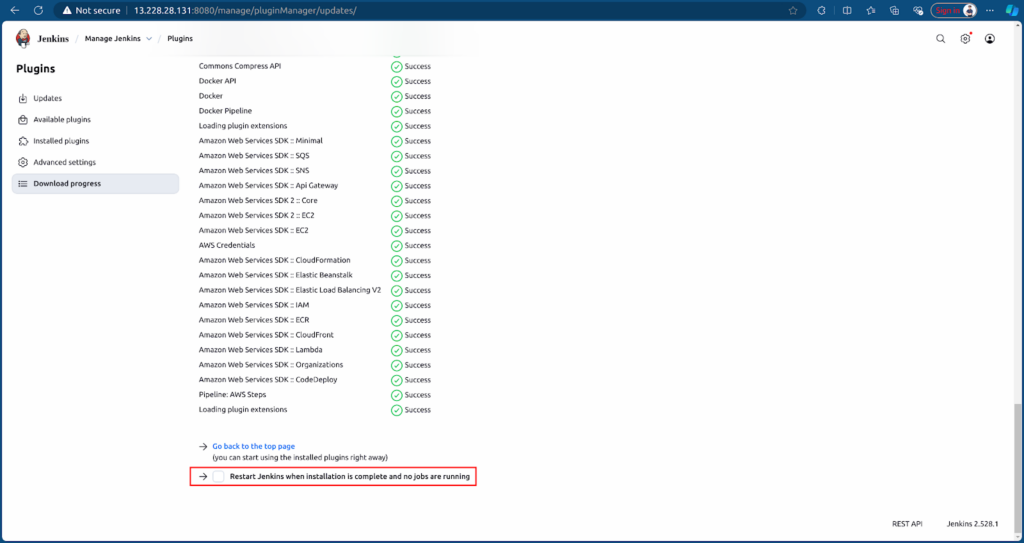
Go to Manage Jenkins → Plugins → Available plugins tab.
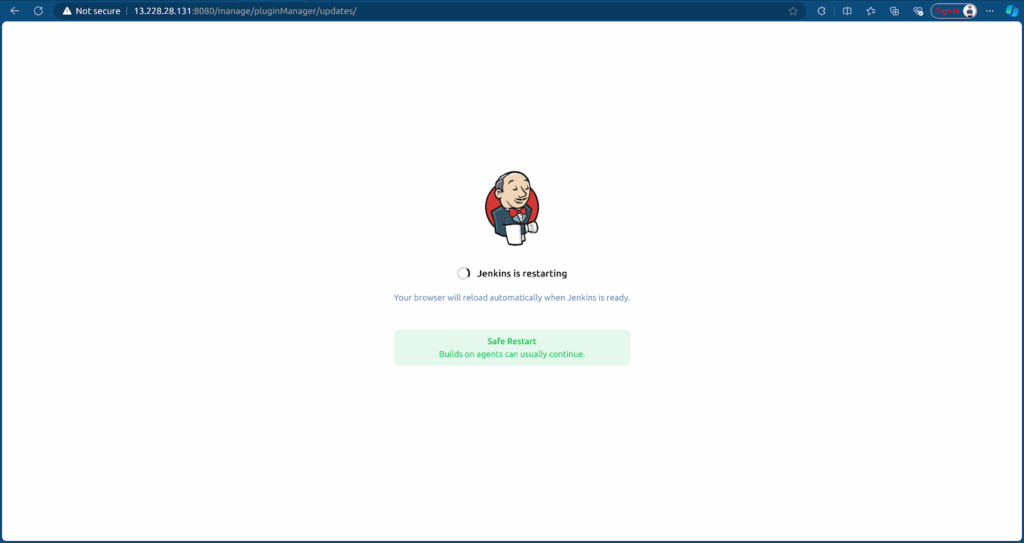
Restart Jenkins after plugin installation.
3. Configuring Jenkins for Frontend and Backend CI
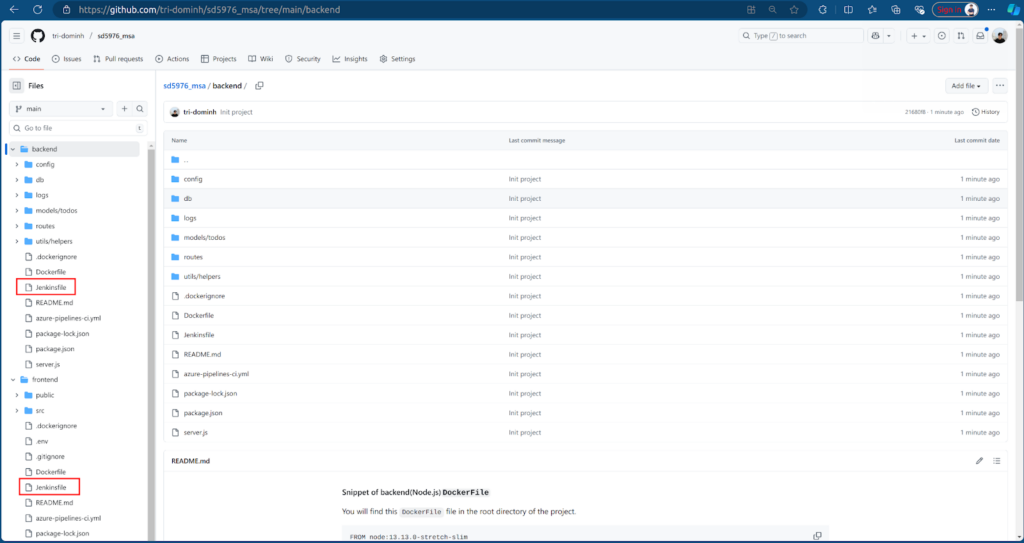
Prepare the MSA repository containing Frontend and Backend: sd5976_msa
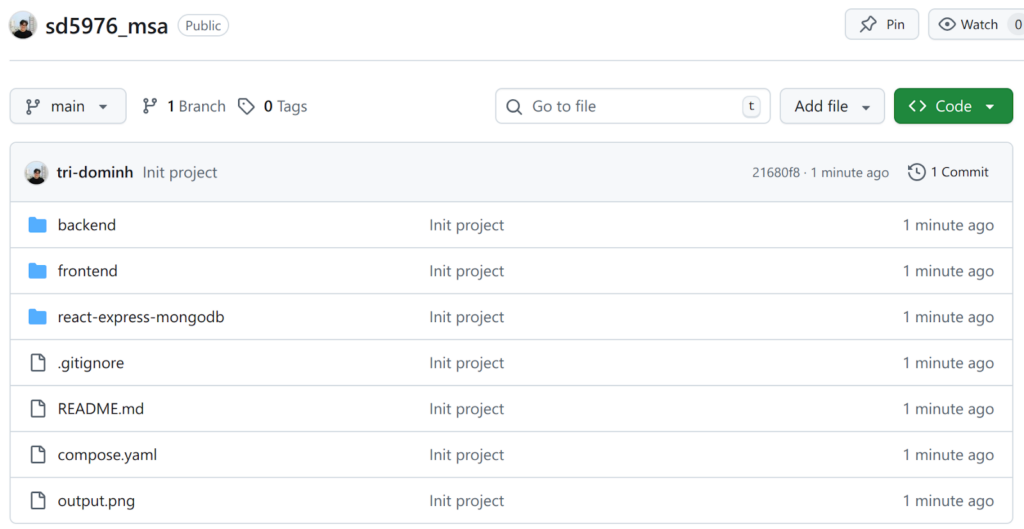
Each source (frontend/backend) should have a Jenkinsfile defining agent and stages: install, build, validate, test, and push to ECR.
- Backend Jenkinsfile: backend/Jenkinsfile
- Frontend Jenkinsfile: frontend/Jenkinsfile
Next, we need to configure Jenkins to access GitHub and AWS resources.
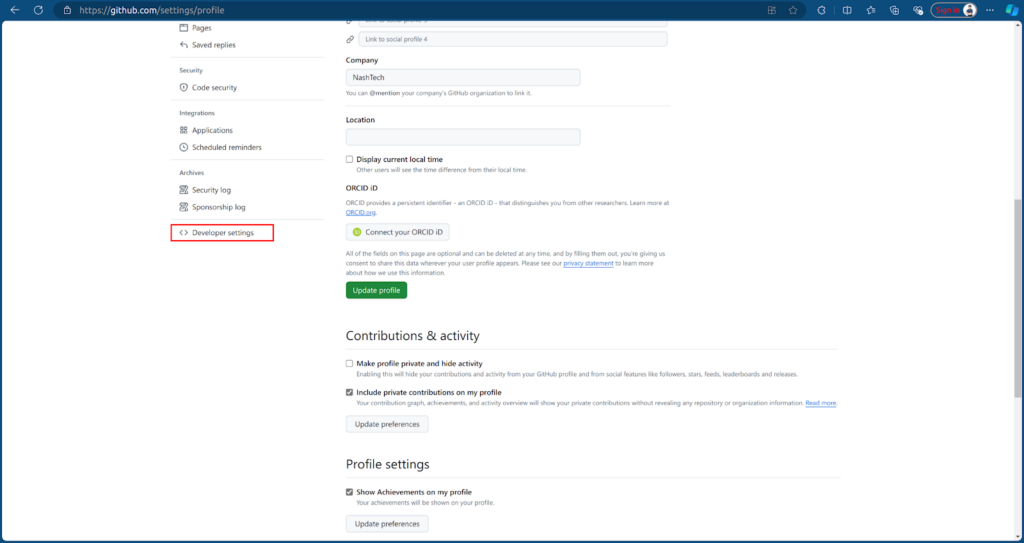
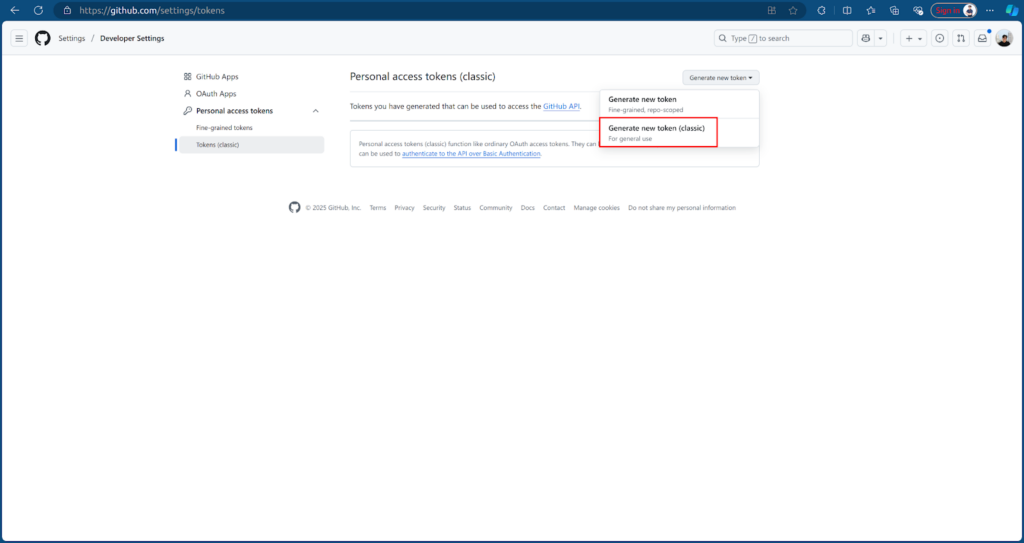
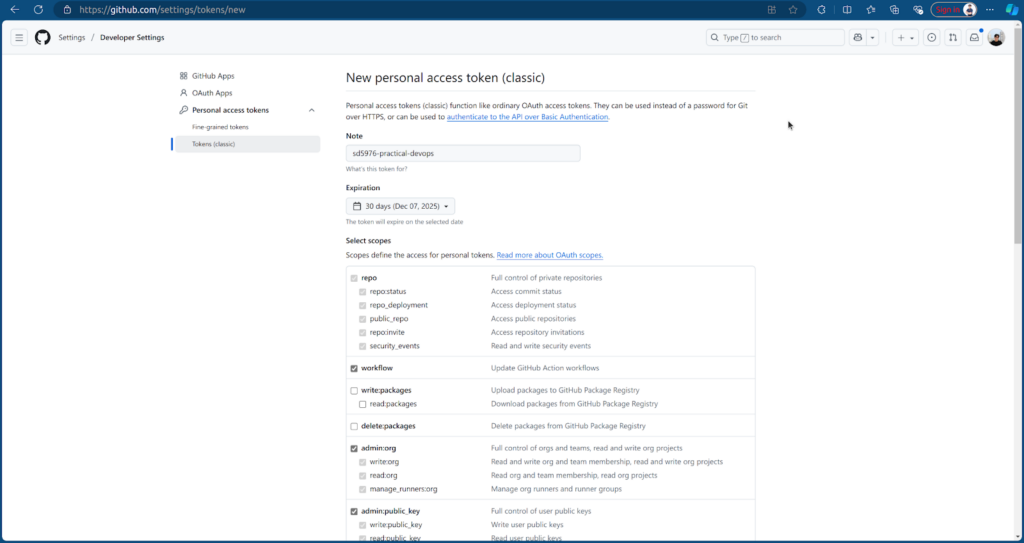
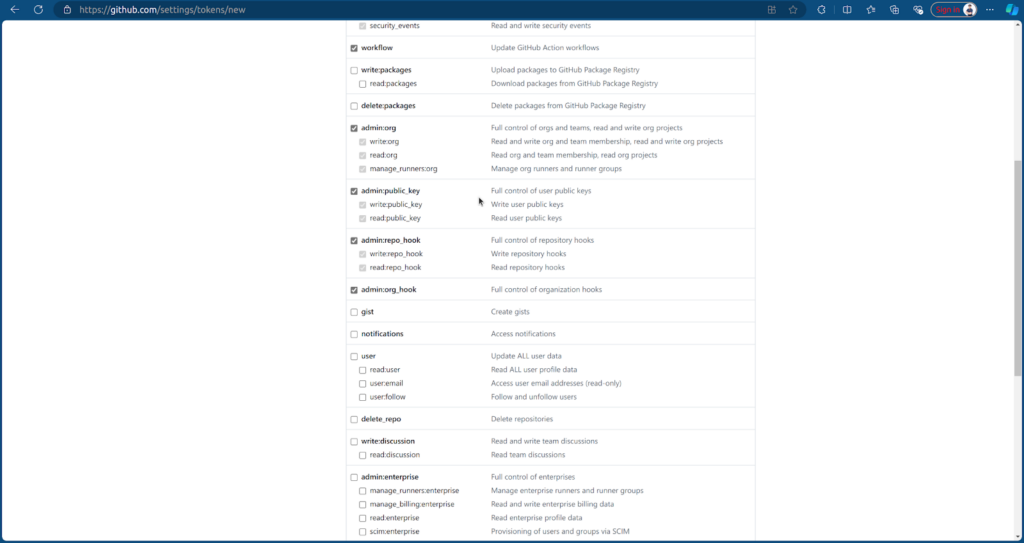
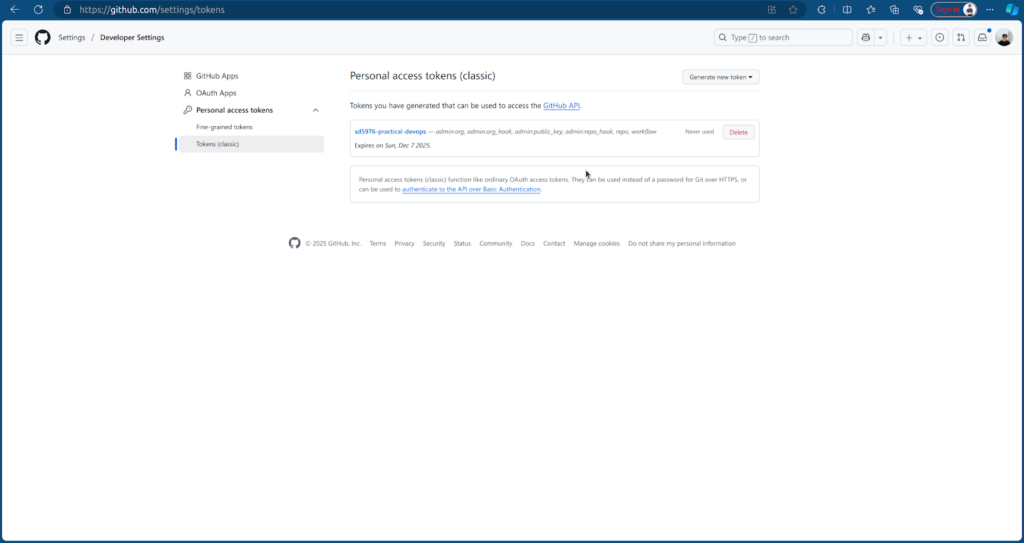
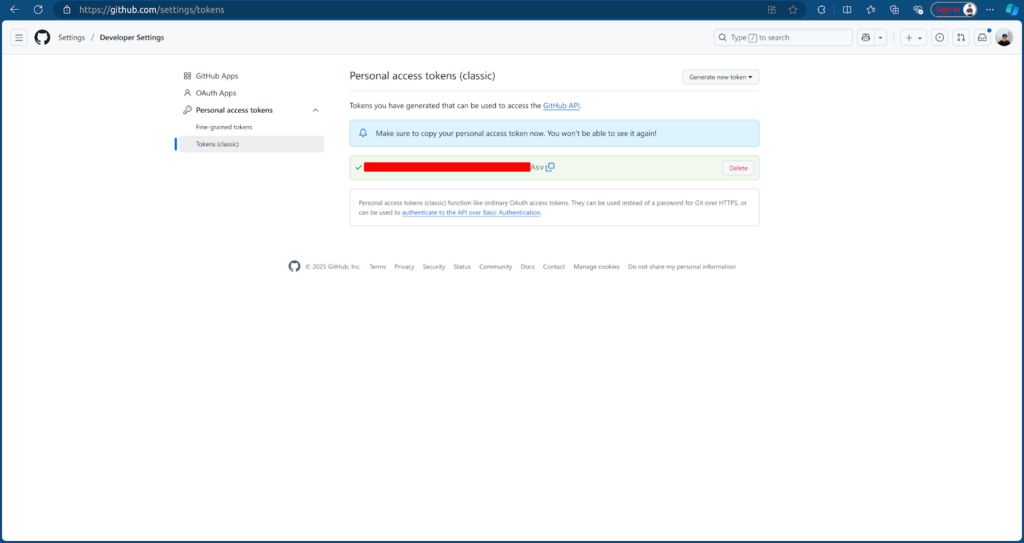
Create a GitHub Access Token for Jenkins to access the MSA repository. Go to Settings → Developer settings → Personal access tokens → Tokens (classic) → Generate new token (classic) → Enter token name and select scopes to allow Jenkins access to GitHub → Create.
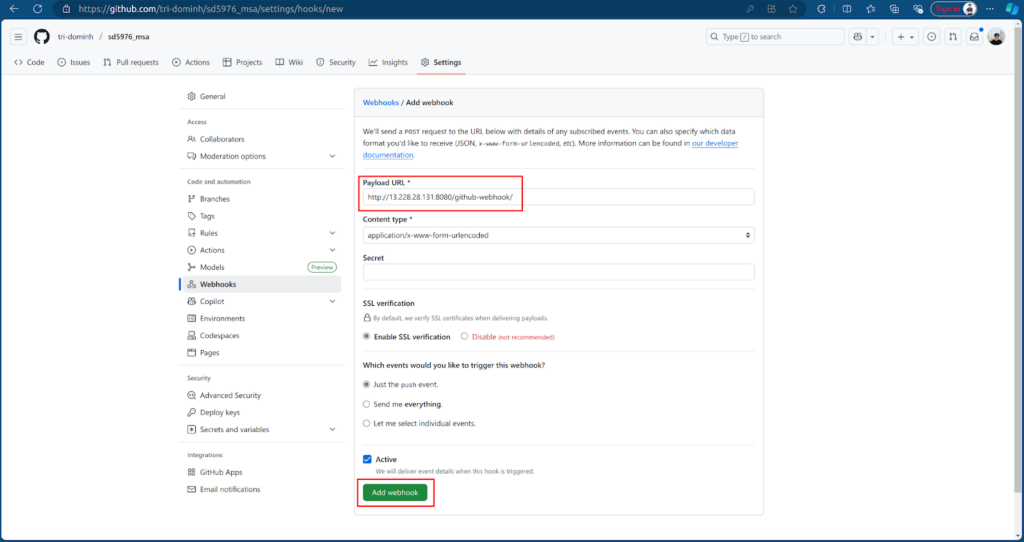
Then, we create a Github webhook to trigger Jenkins whenever we push new code. In the sd5976-msa repo, go to Settings → Webhooks → Add webhook, enter the Jenkins URL with /github-webhook/
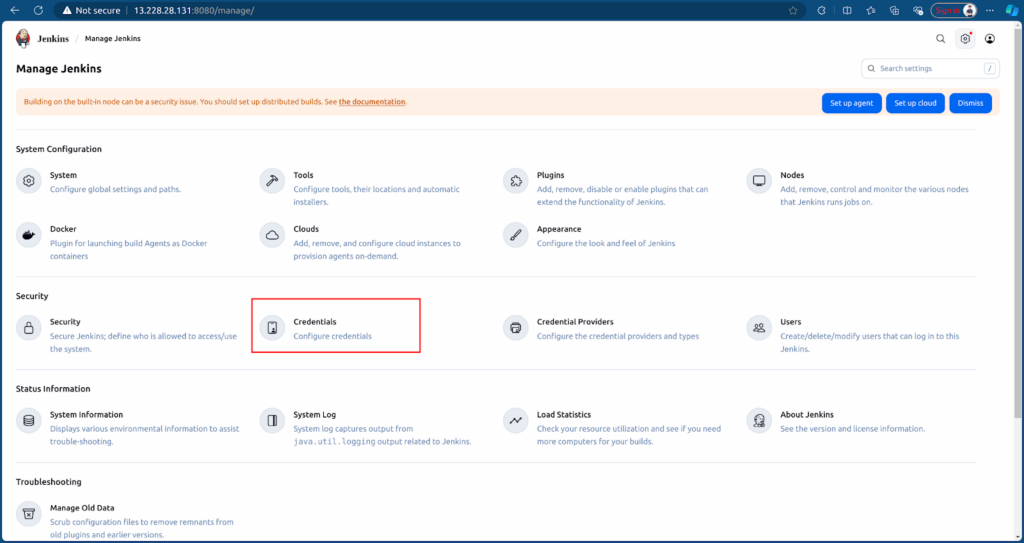
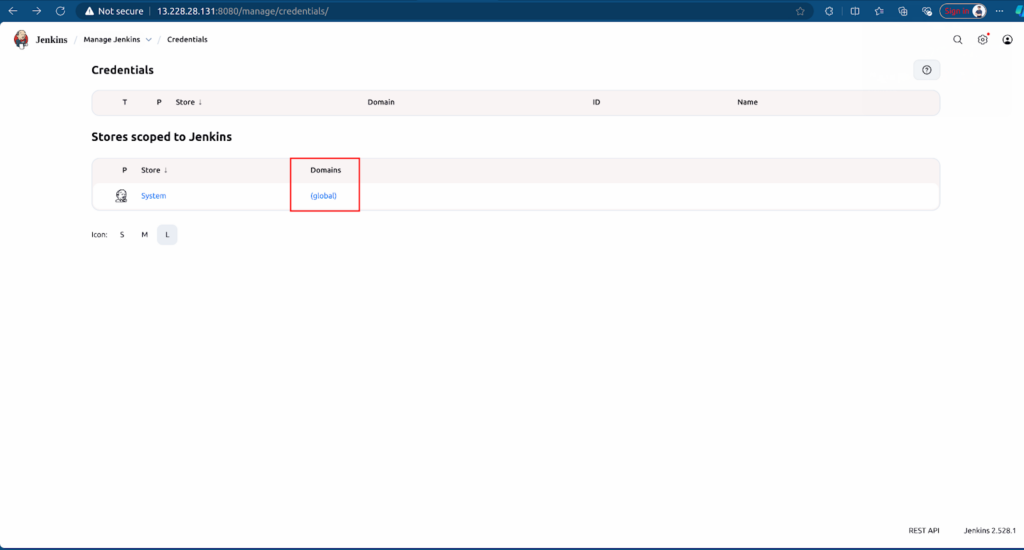
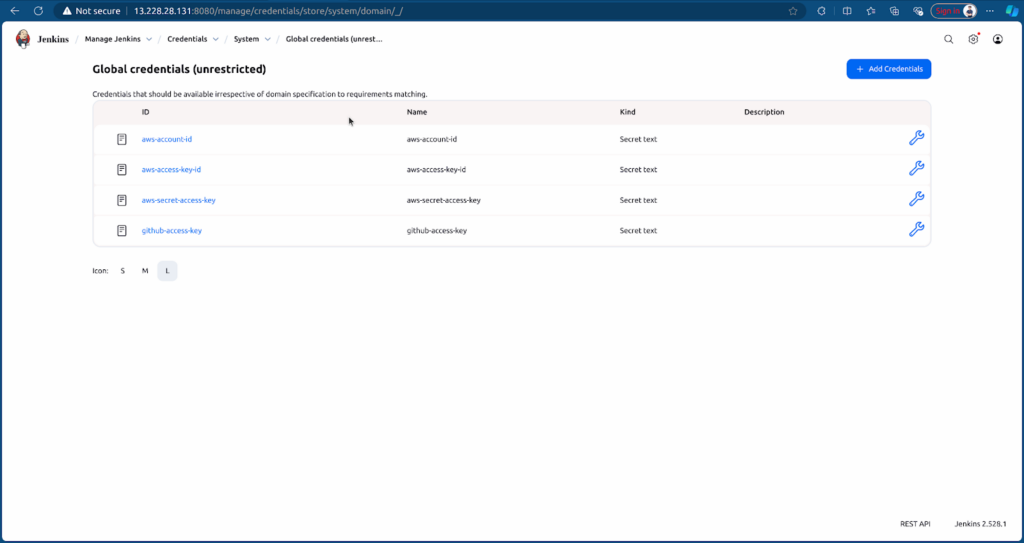
After that, we create the credentials in Jenkins which allow Jenkins access to Resources. Go to Jenkins Credentials → Click on (global) → Add Credentials (Secret text kind).
- AWS Account ID
- AWS Access Key ID & Secret Access Key
- GitHub Token
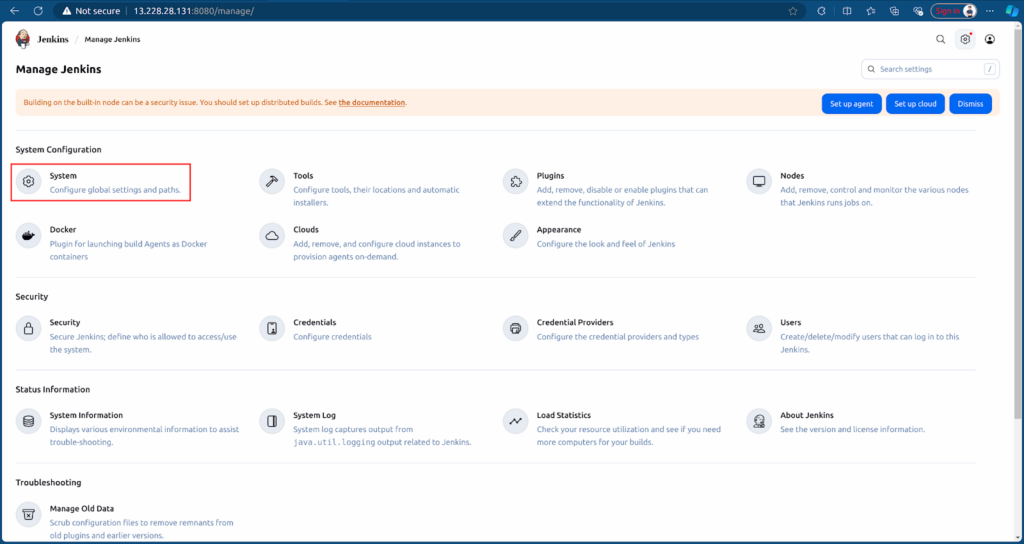
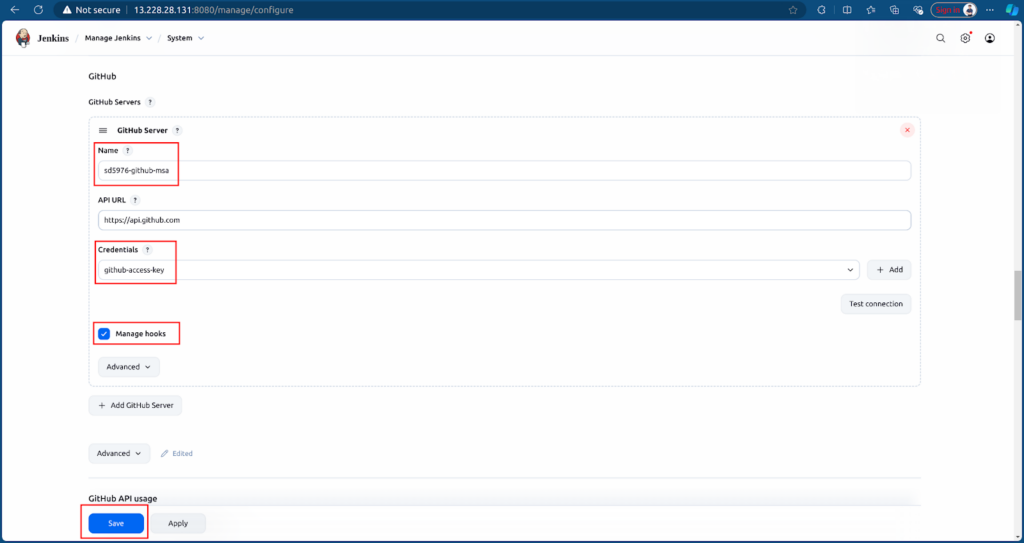
Add GitHub Server for Jenkins, go to Settings → System → In GitHub section → Add GitHub Server → Enter name, select credentials github-access-key and tick Manage hooks → Save.
4. Create CI Jobs for the MSA Application
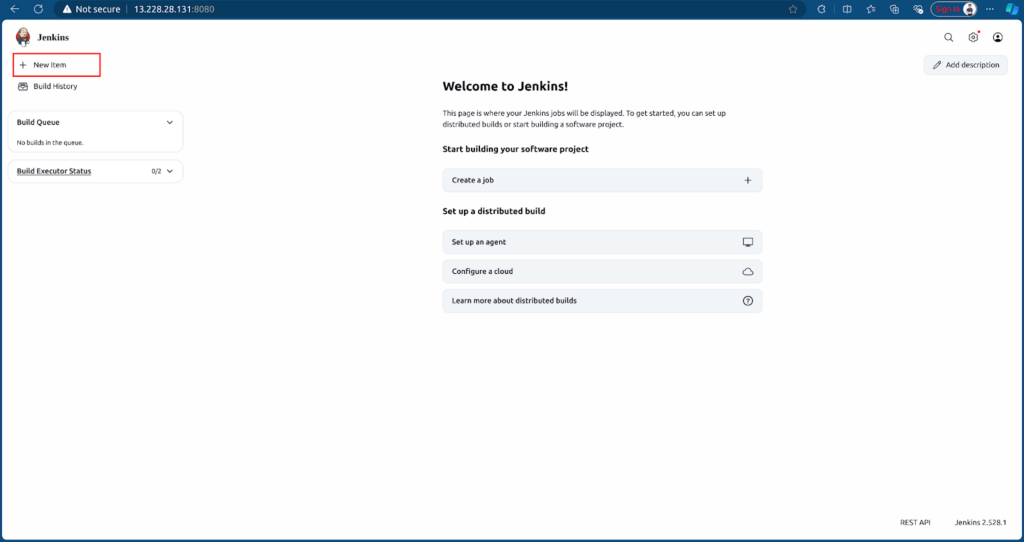
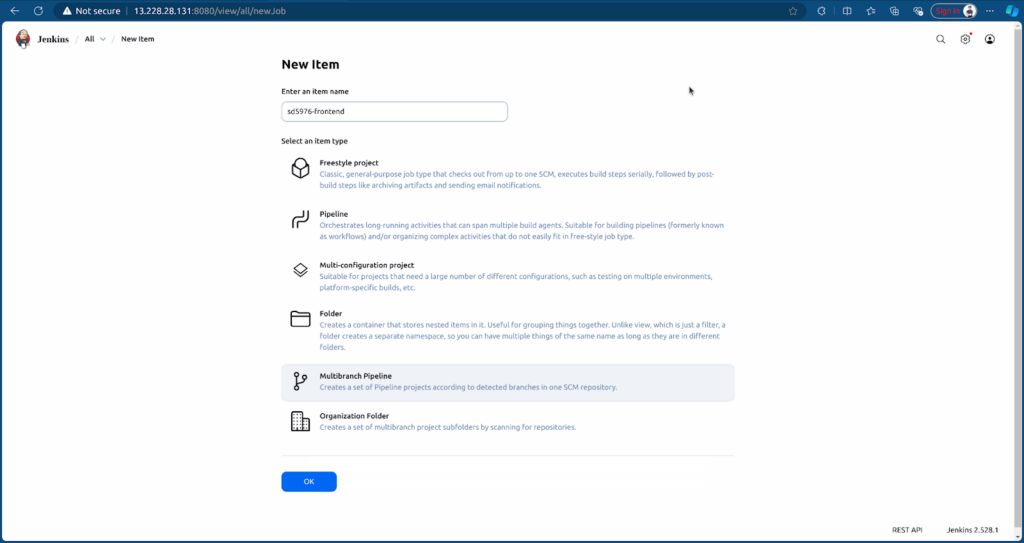
First, we build a job for the Frontend, click New item → Enter name and select Multibranch pipeline job.
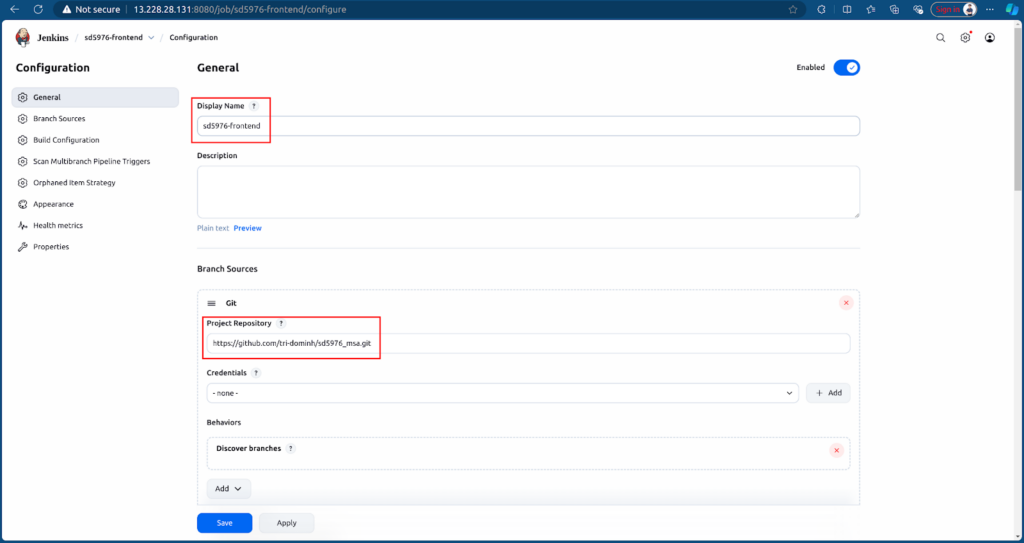
Configure Jenkins job to point to the Frontend branch and Jenkinsfile of Frontend.
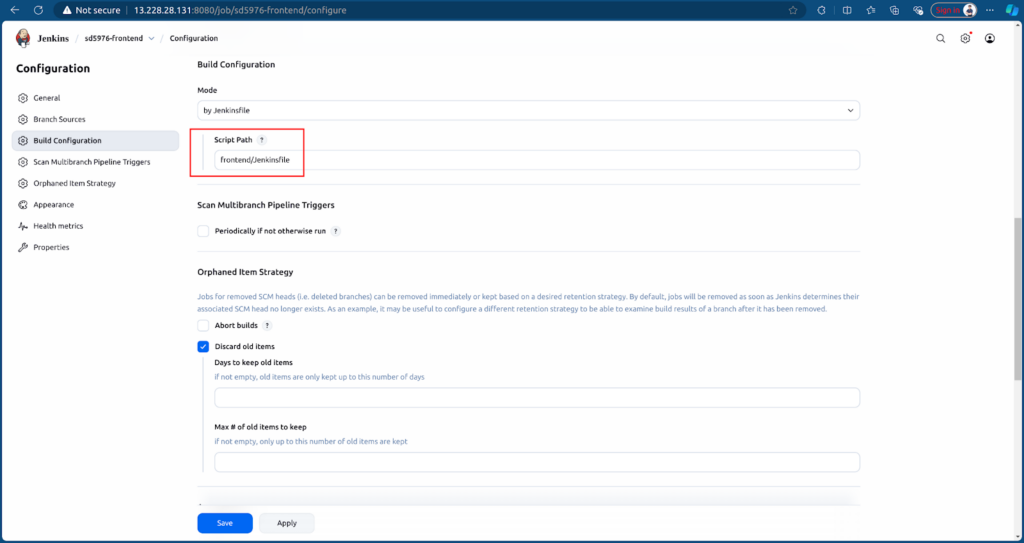
After creating, the job will run Jenkins based on the Jenkinsfile and source.
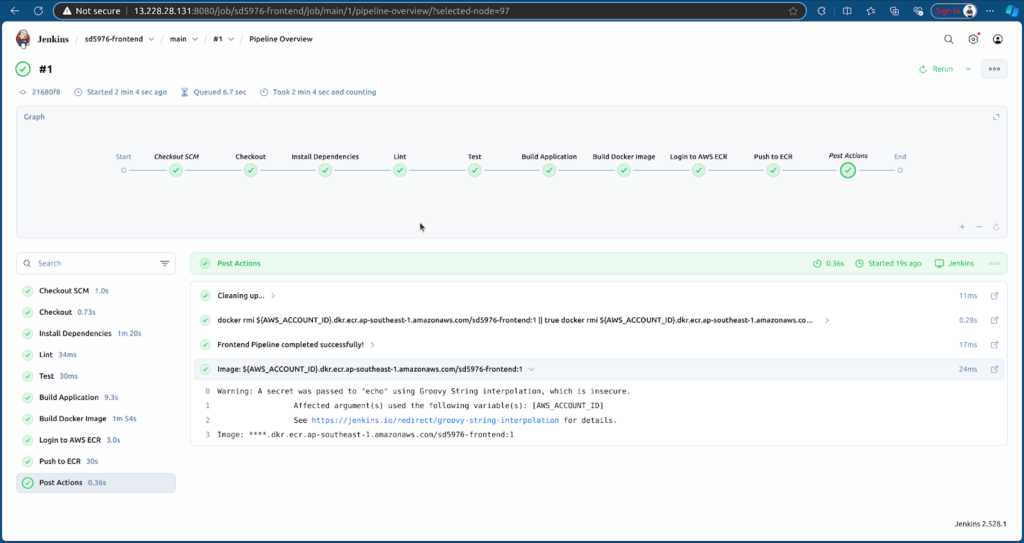
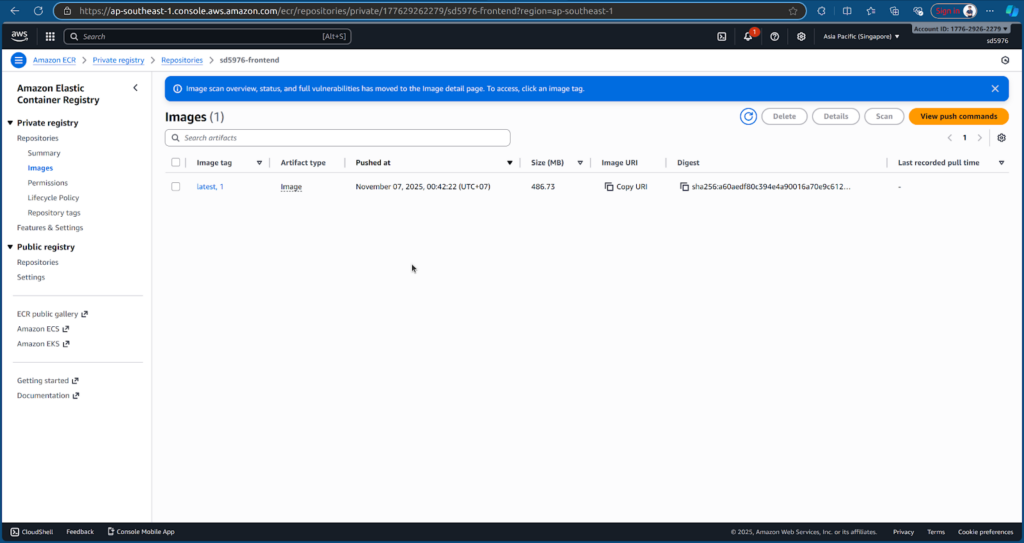
CI will run and push the Frontend image to ECR.
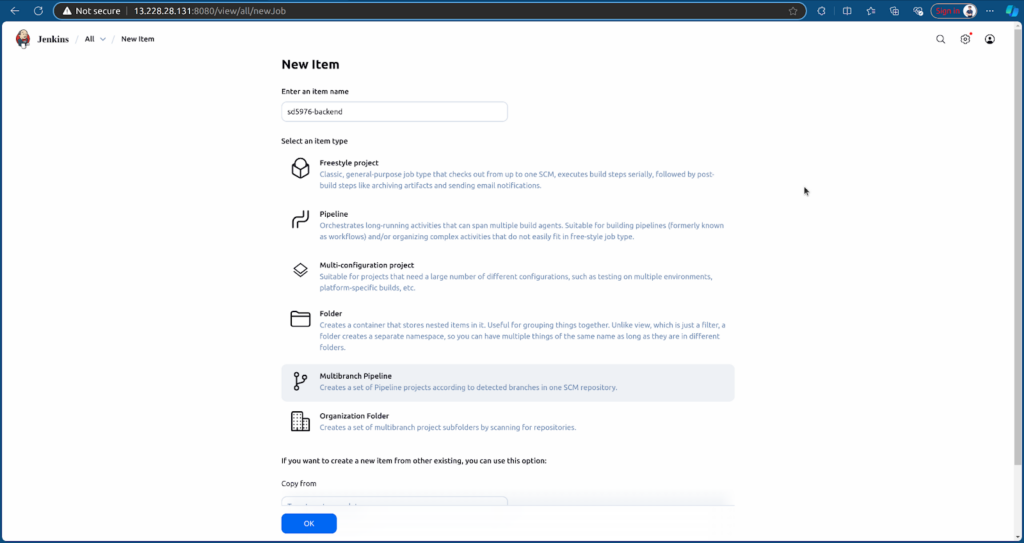
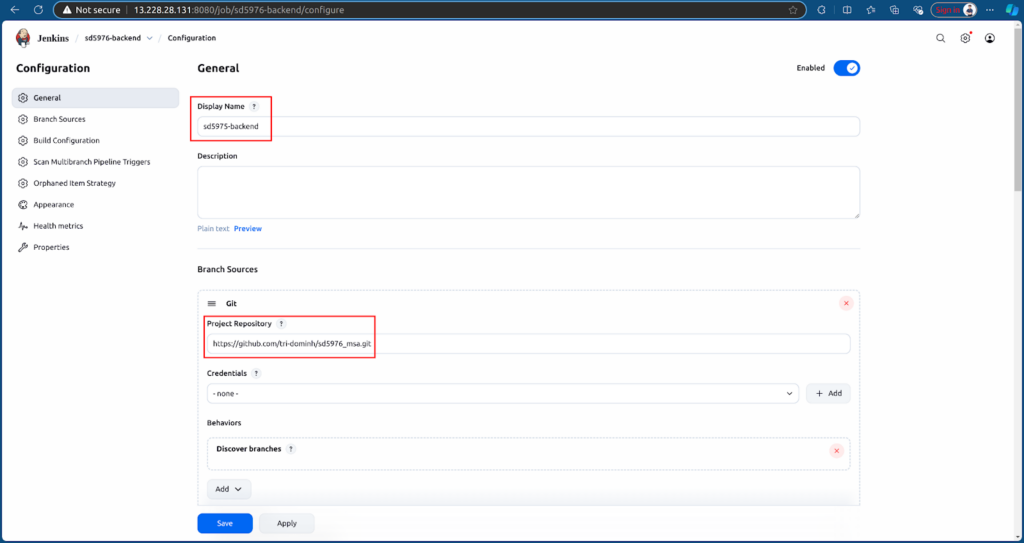
Next, we will create a similar job for the Backend, click New item → Enter name and select Multibranch pipeline job.
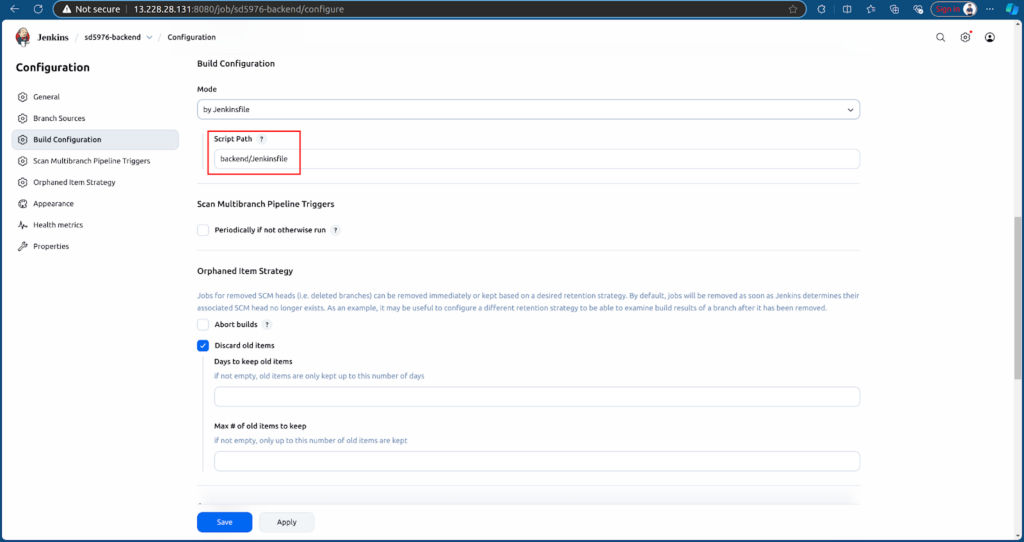
Configure Jenkins job to point to Backend branch and Jenkinsfile of Backend.
After creating, the job will run Jenkins based on the Jenkinsfile and source.
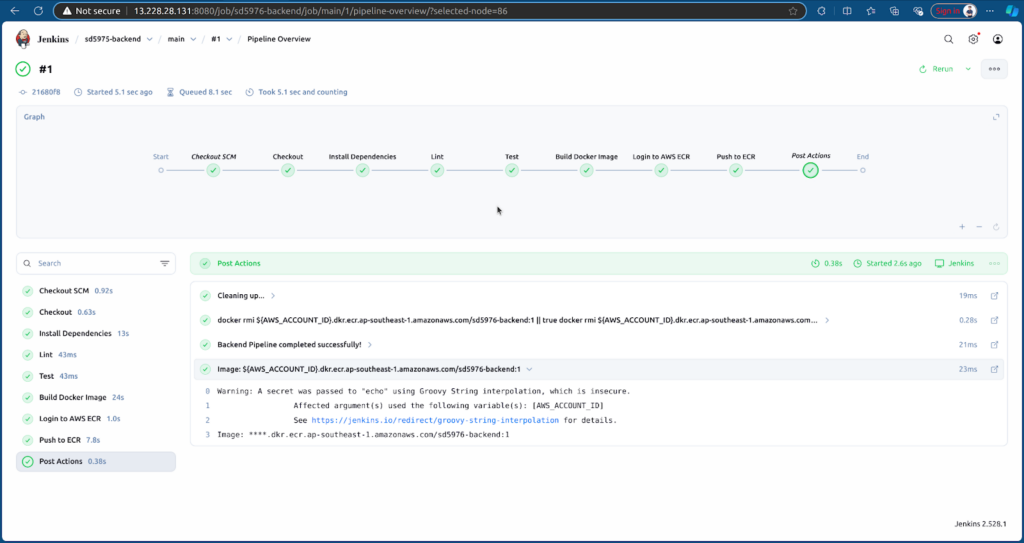
CI will run and push the Backend image to ECR.
5. What’s Next: Deployment to EKS and Monitoring
In the next part, we will deploy both the Frontend and Backend services to the EKS cluster and configure monitoring using Prometheus and Grafana.