


In Part 1 of this series, we provisioned AWS infrastructure using Terraform, set up Jenkins, and created CI jobs for both the Frontend and Backend of our Microservices Application (MSA). In this part, we will take the next step by deploying these services to the Amazon EKS cluster and setting up monitoring with Prometheus and Grafana.
1. Deploying MSA Application to EKS
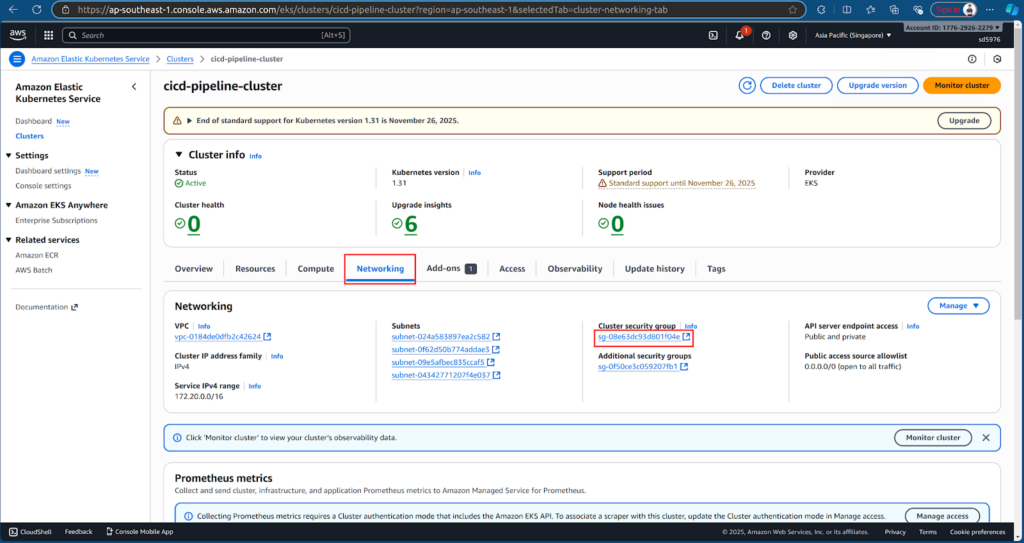
Before Jenkins can deploy to EKS, we need to allow traffic from the Jenkins EC2 instance. Go to cicd-pipeline-cluster → Networking → Click on the security group → Edit Inbound rules.
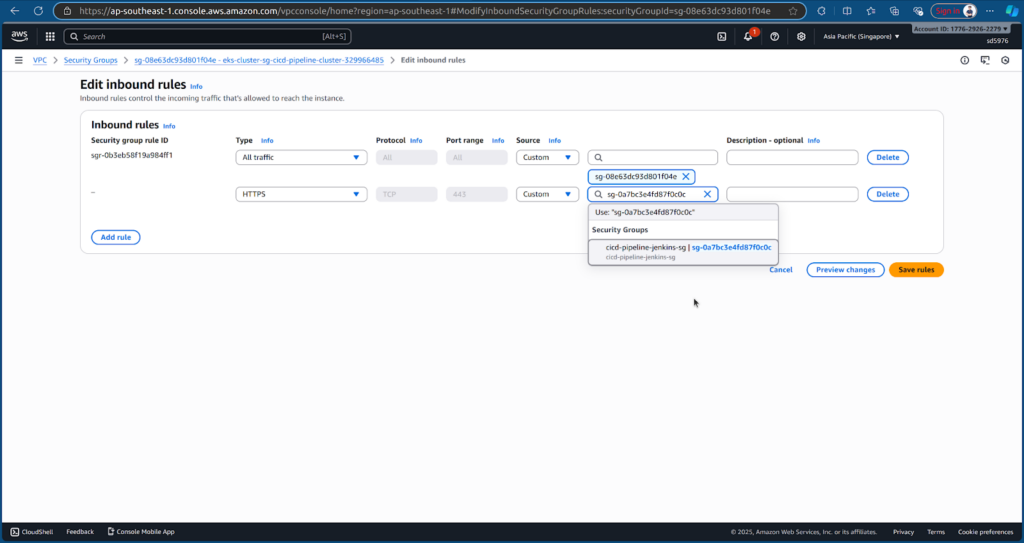
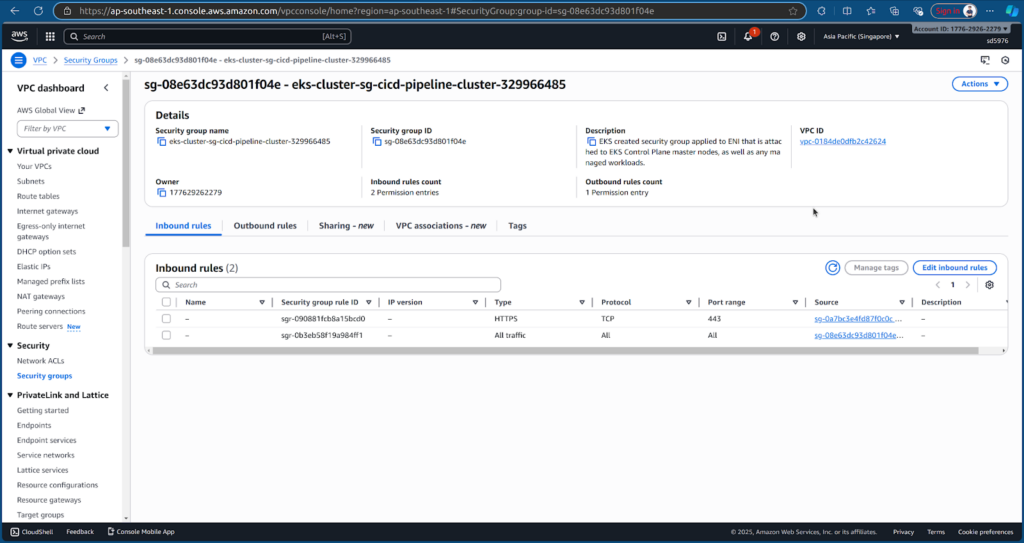
Add an HTTPS inbound rule from Jenkins EC2 instance’s security group cicd-pipeline-jenkins-sg and save the rules.
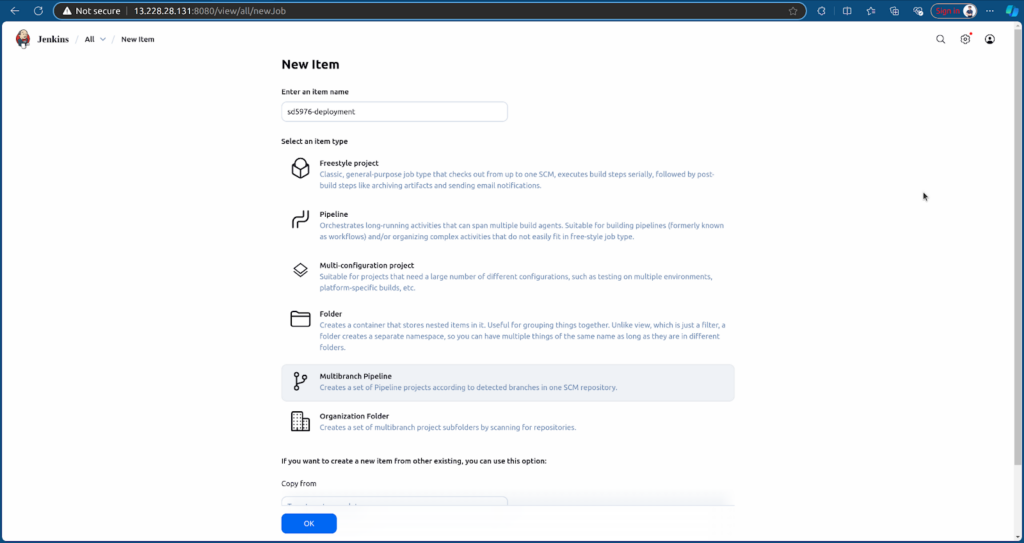
Next, we create a new Multibranch Pipeline job in Jenkins to deploy the application. Refer the deployment repository: sd5976_devops_cicd_deployment/deployment
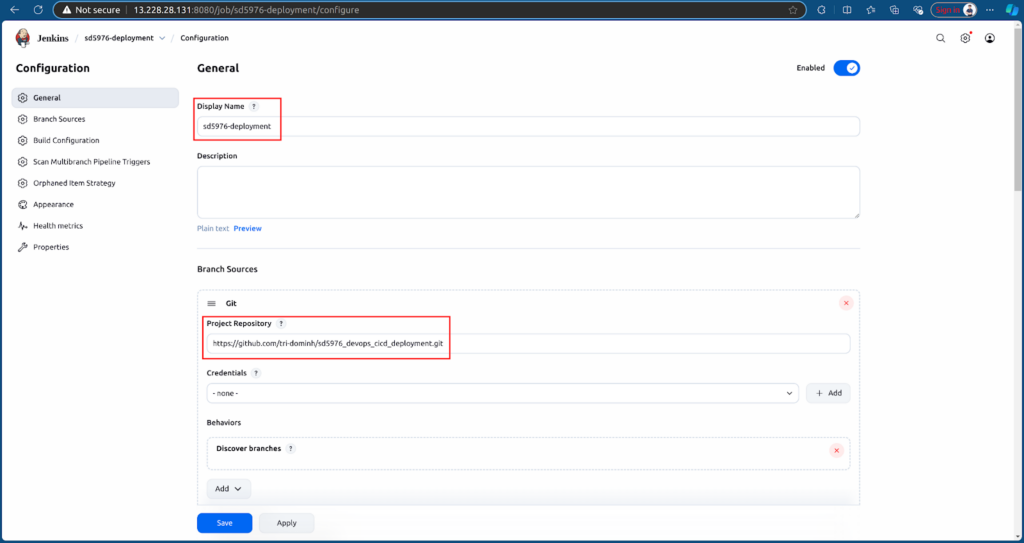
Configure the job to point to the Deployment repository.
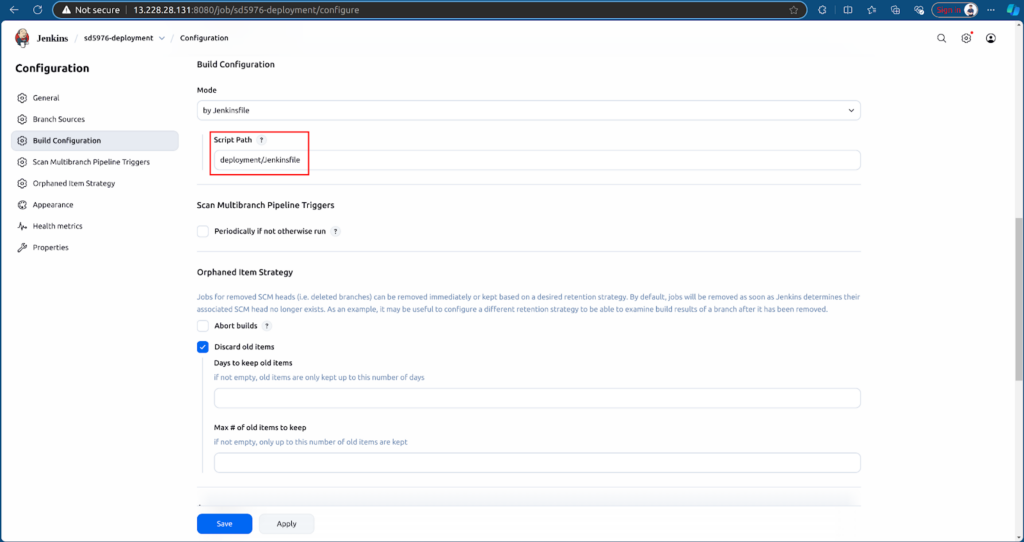
After creating, Jenkins will automatically run the pipeline based on the Jenkinsfile.
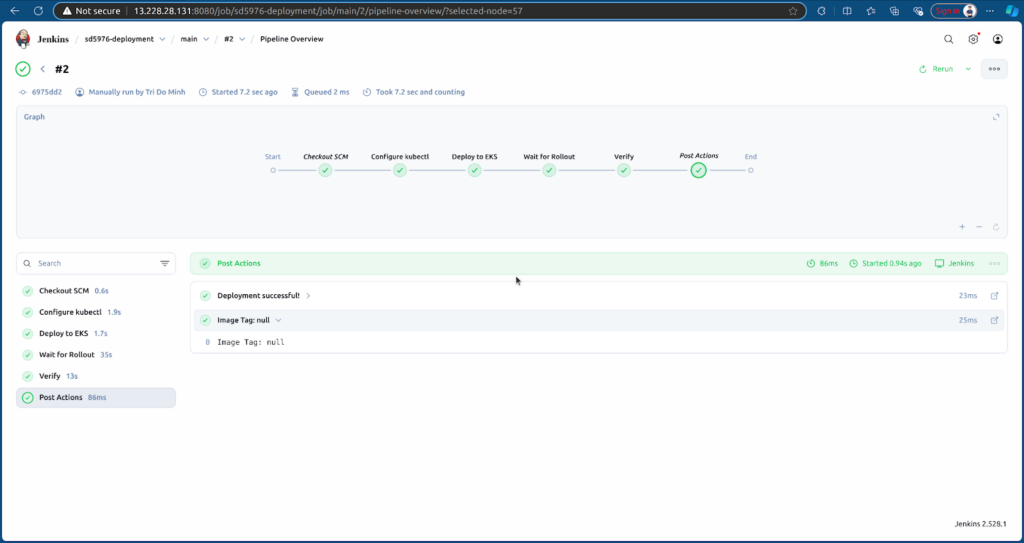
Once the job runs, Jenkins will:
- Pull Docker images from ECR.
- Deploy Frontend and Backend services to the EKS cluster in the namespace sd5976-msa.
Check the deployment status with:
kubectl get pods -n sd5976-msa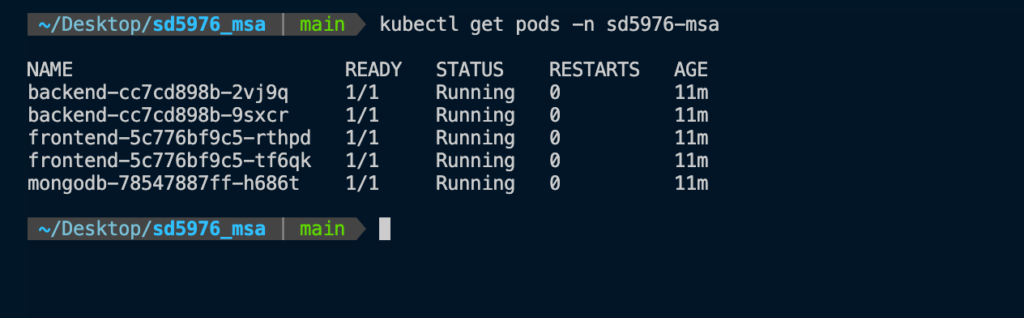
Retrieve the Frontend service URL from EKS:
kubectl get svc frontend -n sd5976-msa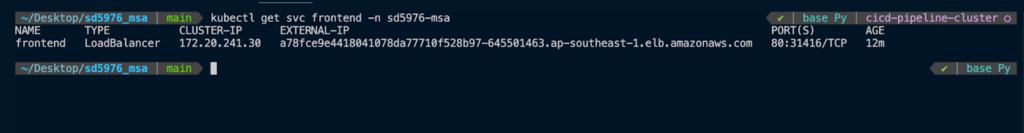
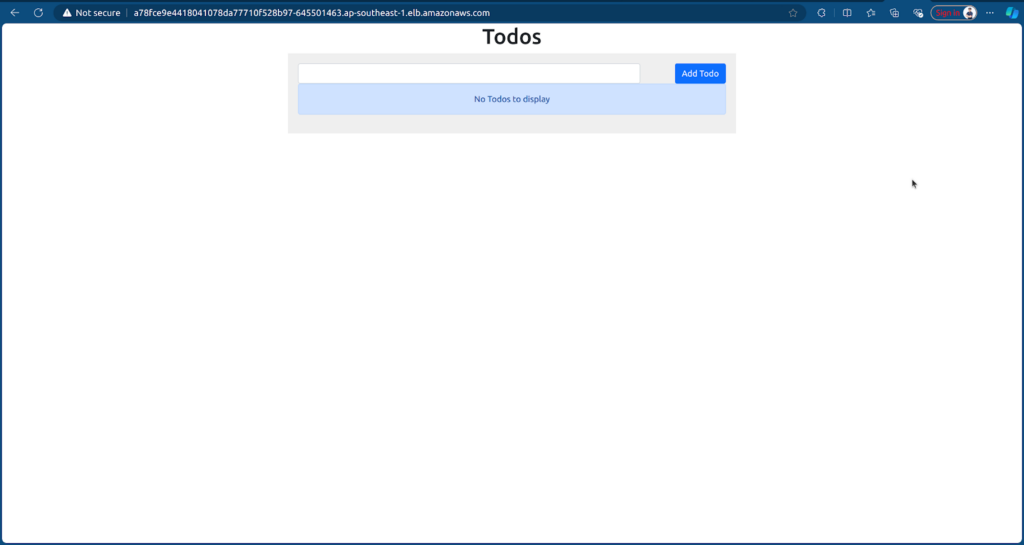
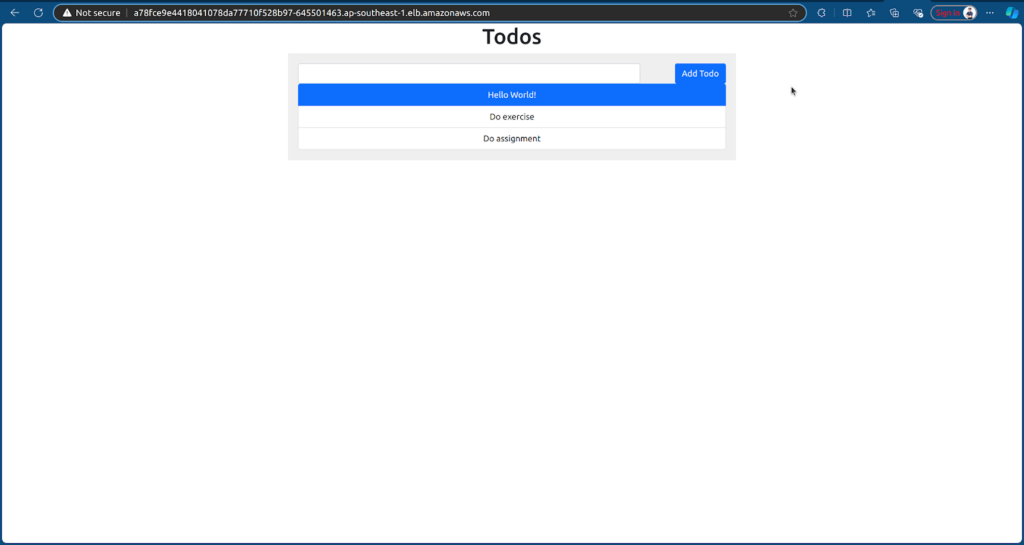
Open the URL in your browser to access the application.
2. Monitoring with Prometheus and Grafana
2.1. Deploy Prometheus and Grafana
Define .yaml file to deploy Prometheus and Grafana in sd5976_aws_infrastructure: sd5976_aws_infrastructure/monitoring
First, we deploy metrics-server to collect cluster metrics.
kubectl apply -f https://github.com/kubernetes-sigs/metrics-server/releases/latest/download/components.yaml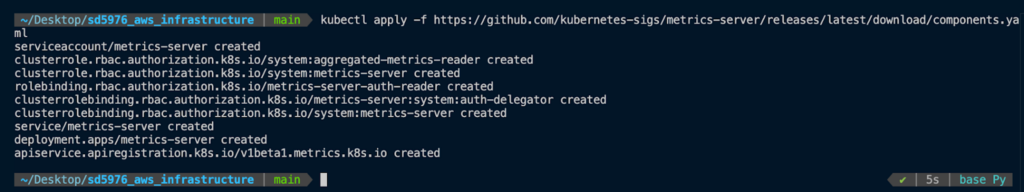
Then, we apply the monitoring manifests from your repository to deploy Prometheus and Grafana:
kubectl apply -f monitoring/prometheus.yaml
kubectl apply -f monitoring/grafana.yaml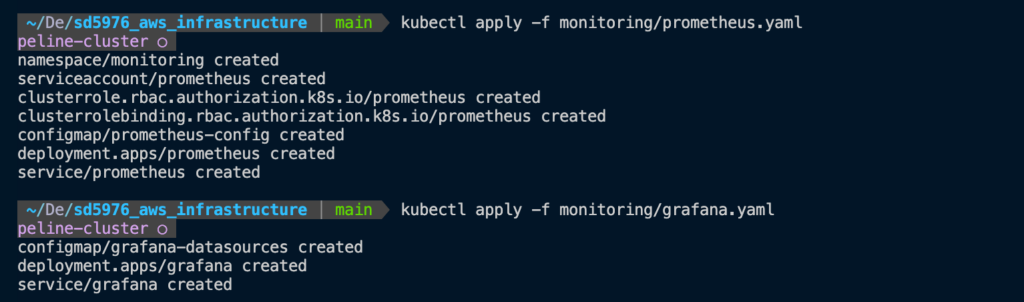
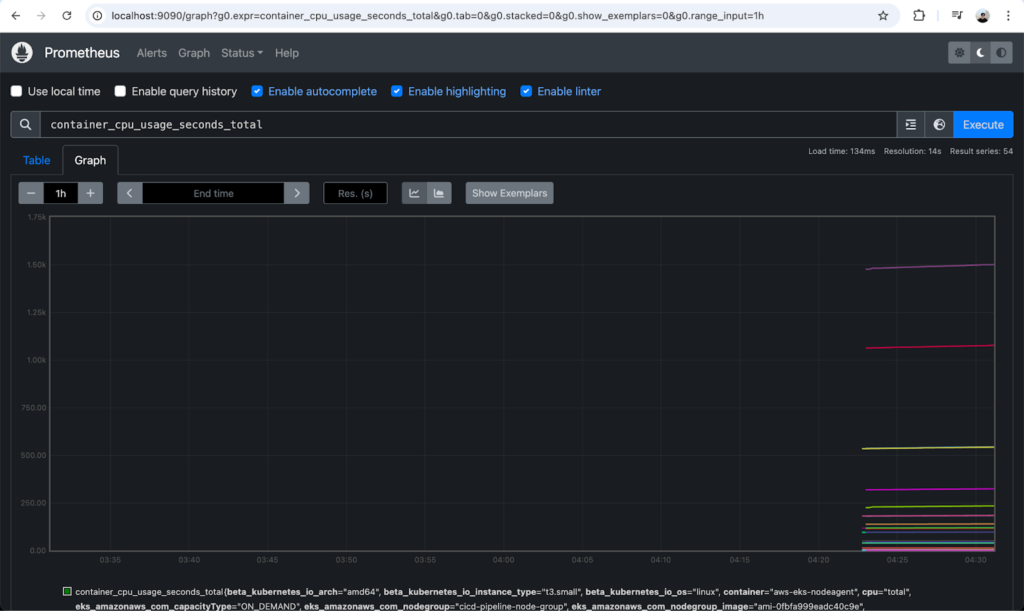
2.2. Access Prometheus
Forward the Prometheus port from EKS to your local machine:
kubectl port-forward -n monitoring svc/prometheus 9090:9090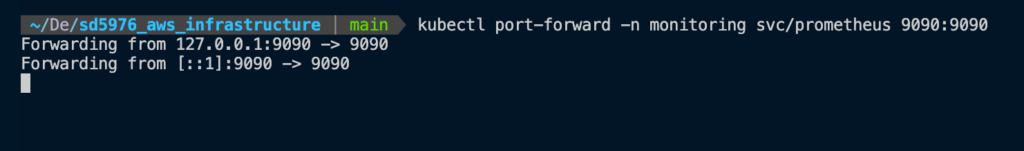
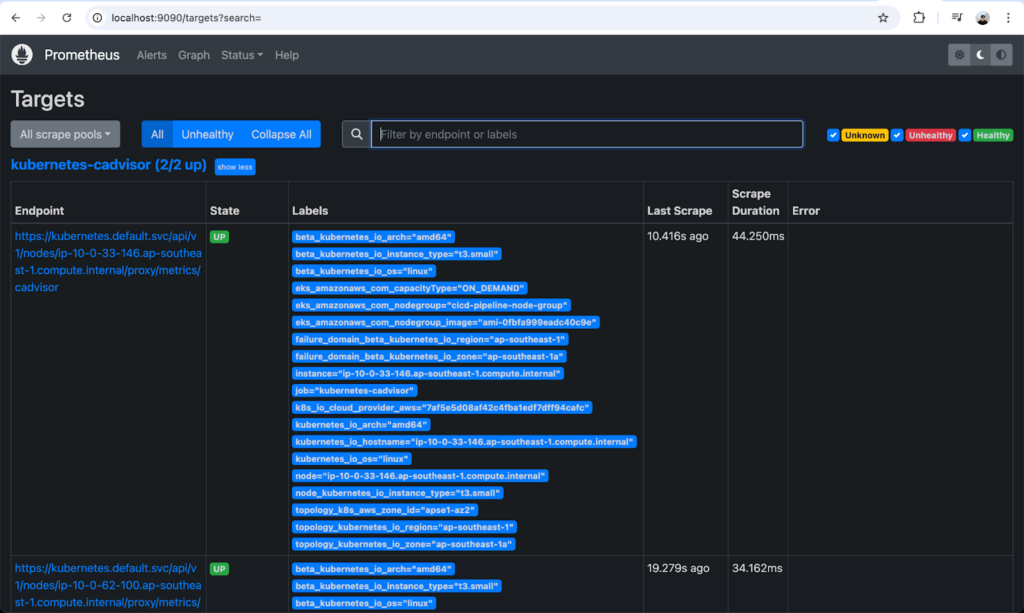
We can monitor Prometheus via http://localhost:9090.
2.3. Access Grafana
Forward the Grafana port from EKS to your local machine:
kubectl port-forward -n monitoring svc/grafana 3000:3000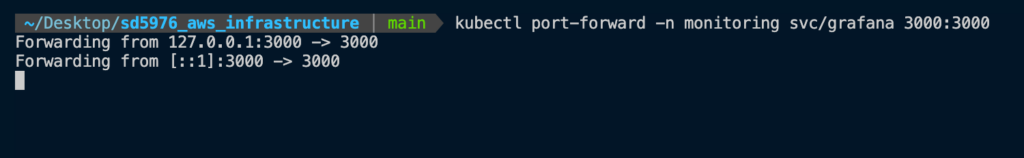
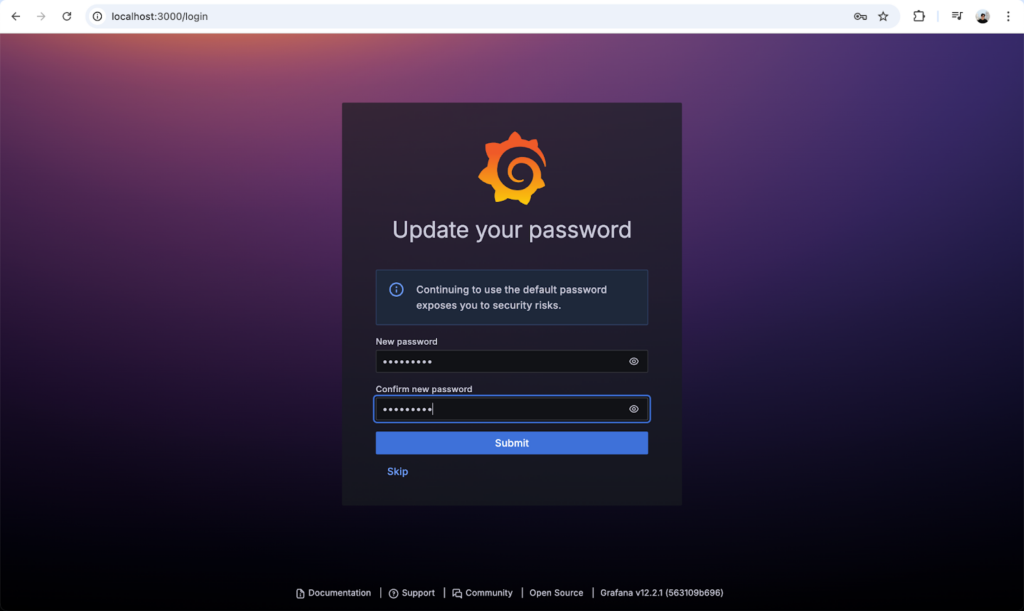
We can access Grafana via http://localhost:3000/login. Login with:
- Username: admin
- Password: admin
Update the password after first login.
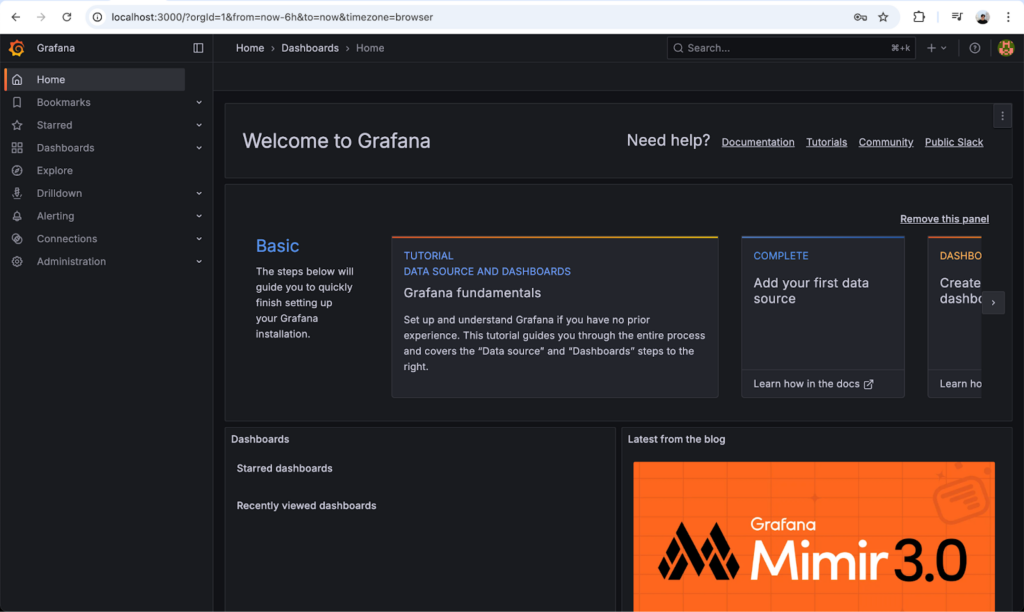
Logged in the Grafana successfully.
2.4. Create a Dashboard in Grafana
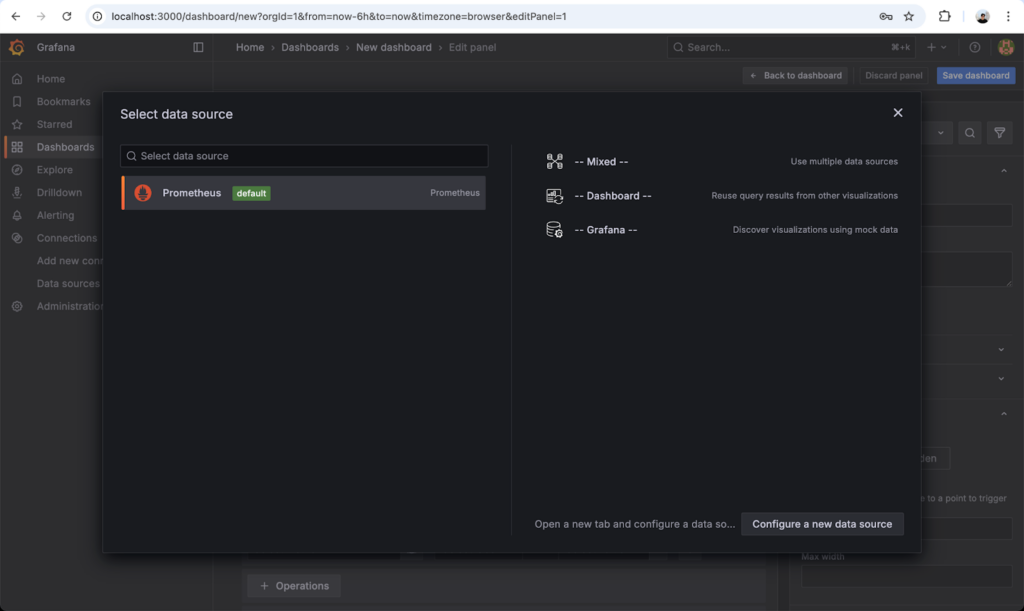
Go to Dashboard → Create dashboard → Add visualization → Select Prometheus (default) as the data source.
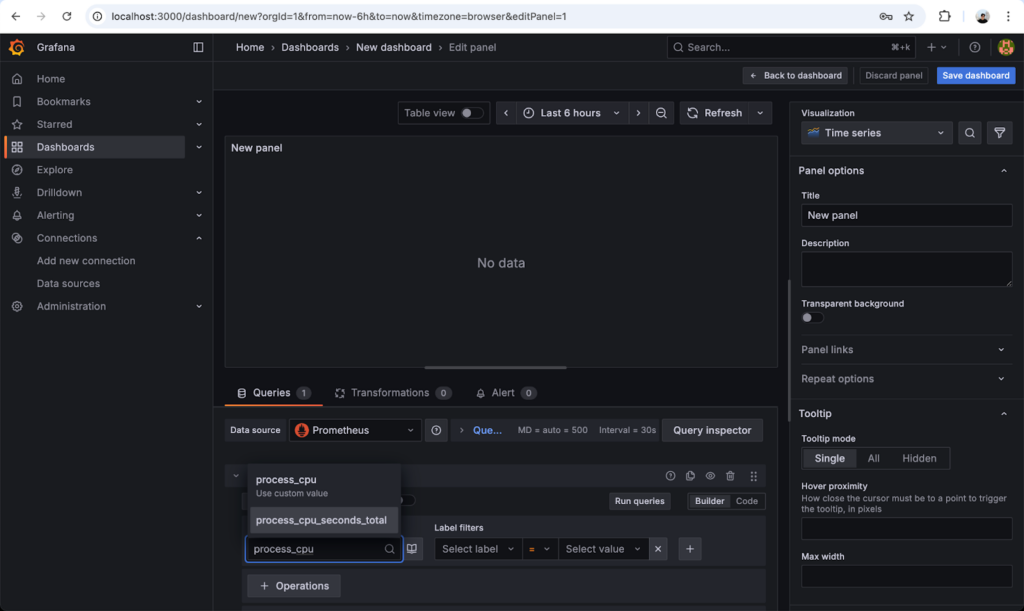
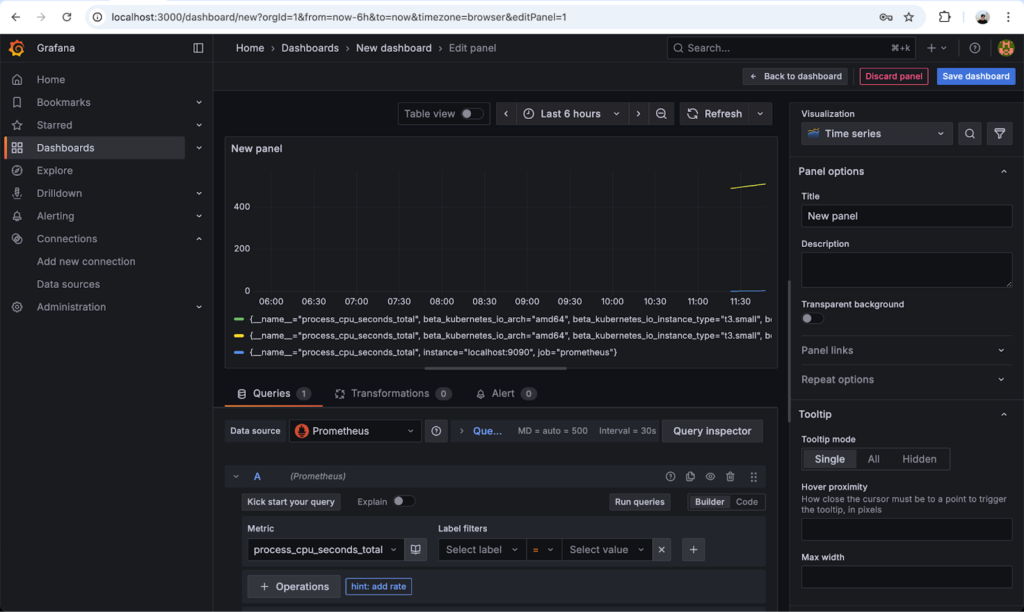
Search for metrics, for example: process_cpu_seconds_total and run the query.
After showing on the panel, click Save dashboard.
You can now monitor your microservices and cluster metrics in real-time with Grafana.
3. What’s Next: GitOps Deployment with ArgoCD
In this part, we successfully deployed our Frontend and Backend microservices to the EKS cluster and set up monitoring with Prometheus and Grafana. In the next part of this series, we will take our deployment workflow a step further by implementing GitOps using ArgoCD.