I. Introduction
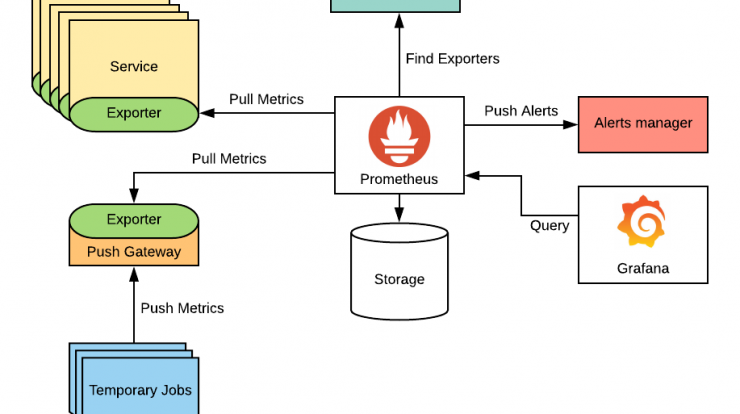
Prometheus is an open-source monitoring and alerting system that collects metrics from configured targets, stores them, and provides a web interface for visualization and analysis. It is widely used in IT infrastructure monitoring, DevOps, and cloud-native environments. which offers a range of features, including:
- Multi-dimensional data model
- Powerful query language (PromQL)
- Flexible alerting with alert manager
- Exporters for integrating with various systems
- Rich set of client libraries for instrumentation
II. Setting up Prometheus
To set up Prometheus, follow these steps:
- Download the latest version of same from the official website.
- Extract the downloaded archive to a directory of your choice.
- Navigate to the Prometheus directory and run the same binary.
- This is now running on http://localhost:9090.
III. Implementing Metrics and Reporting in Prometheus
Metrics are quantitative measurements that help you understand the performance and behavior of your system. To implement metrics in your system using this, follow these steps:
- Choose the metrics you want to collect and define them in your application code.
- Use a Prometheus client library to instrument your code and expose the metrics.
- Configure Prometheus to scrape the metrics from your application endpoints.
- Visualize the collected metrics using Grafana or other tools.
IV. Email Alerts via Prometheus
Alerting is a critical component of any monitoring system. Prometheus Alertmanager provides a flexible and powerful alerting system that can send alerts via email, Slack, PagerDuty, and other channels. To set up and configure email alerts using Alertmanager, follow these steps:
- Configure Prometheus to send alerts to Alertmanager.
- Configure Alertmanager to send email alerts using an SMTP server.
- Define alert rules in this using PromQL expressions.
- Test the alerting system by triggering alerts and verifying that they are received.
V. Code and Configurations
Prometheus is highly configurable and can be customized to fit the needs of your system. To configure server, you need to understand its configuration files and their structure. Here are some tips for writing efficient and effective configuration files:
- Define scrape targets and their associated labels.
- Use relabeling to modify labels and filter targets.
- Configure retention and storage options for metrics.
- Use federation to aggregate metrics from multiple server instances.
VI. Conclusion
Prometheus is a powerful monitoring and alerting system that offers a range of features for IT infrastructure monitoring, DevOps, and cloud-native environments. By following the steps outlined in this guide, you can set up and configure this to collect metrics, send alerts, and visualize data. With its flexible query language and powerful alerting system, This is a valuable tool for any organization that wants to monitor and optimize its systems. check out the official documentation and community forums.
For more, you can refer to the Prometheus documentation.
For a more technical blog, you can refer to the Nashtech blog: https://blog.nashtechglobal.com/


