


Introduction
A database is an organized systematic collection of data that allows for its efficient storage, retrieval, and management. Databases are essential components in modern applications. Two primary types of databases – SQL (Structured Query Language) databases and NoSQL (Not Only SQL) databases – serve different data and use case needs.
SQL Databases
SQL databases, or relational databases, store data in structured tables with predefined schemas.
Key Characteristics:
- Schema-Based: A fixed schema defines tables, columns, data types, and relationships.
- ACID Compliance: Ensures data consistency through Atomicity, Consistency, Isolation, and Durability.
- Structured Query Language (SQL): Used for querying, inserting, updating, and deleting data.
Examples:
- PostgreSQL
- MySQL
- Microsoft SQL Server
- Oracle Database
Use Cases:
- Banking and finance systems
- Inventory management
- Enterprise resource planning (ERP)
- Applications requiring complex queries and transactions
SQL Databases Are Needed When:
- Data integrity and complex transactions are required.
- Relationships between entities need strong enforcement.
- Structured data is handled with predictable schemas.
NoSQL Databases
NoSQL databases store and retrieve data that may not fit into tables, supporting flexible schemas and handling unstructured or semi-structured data.
Key Types:
- Document-Oriented: JSON-like documents (e.g., MongoDB)
- Key-Value Stores: Key-value pairs (e.g., Redis, DynamoDB)
- Wide-Column Stores: Tables with dynamic columns (e.g., Cassandra)
- Graph Databases: Nodes and edges (e.g., Neo4j)
Key Characteristics:
- Schema-Less or Dynamic Schema: Data structures can vary across entries.
- High Scalability: Supports horizontal scaling across distributed systems.
- Eventual Consistency: Prioritizes availability and partition tolerance.
Use Cases:
- Real-time analytics
- IoT applications
- Content management systems
- Social networks
- Big data and distributed systems
NoSQL Databases Are Needed When:
- Applications require fast development with flexible data models.
- Scalability and availability are more important than immediate consistency.
- Large volumes of varied or unstructured data are processed.
Database Load Testing
Database load testing evaluates how a database performs under a specific user-generated load by simulating virtual users performing operations like INSERT, SELECT, UPDATE, and DELETE. The goal is to measure response time, throughput, concurrency, resource usage, and stability.
Tools like JMeter, k6, LoadRunner, and Gatling simulate different load levels (baseline, expected, peak) to observe system behaviour.
Why is Database Load Testing Required?
- Performance Validation
Verifies optimal performance under expected user load. - Scalability Assessment
Determines whether the database can scale with increased load. - Bottleneck Identification
Identifies issues like slow queries, deadlocks, memory leaks, connection pool exhaustion. - Infrastructure Planning
Supports informed decisions about hardware, indexing, and caching strategies. - Reliability and Stability
Validates robustness through sustained load testing. - Optimization and Tuning
Guides query optimization, schema refactoring, and system tuning.
Database load testing ensures the system is robust and performs reliably under real-world usage.
Database Load Testing using JMeter
JMeter simulates virtual users that send database requests under controlled conditions. It uses samplers like JDBC Request for SQL databases and JSR223 Sampler (Groovy) for NoSQL like MongoDB or DynamoDB. These samplers perform CRUD and aggregate queries.
A Thread Group defines users and ramp-up time. A Constant Throughput Timer maintains request rate. CSV Data Set Config allows parameterization.
Metrics such as response time, throughput, latency, and error rate are collected for different load levels: baseline, low, medium, and high.
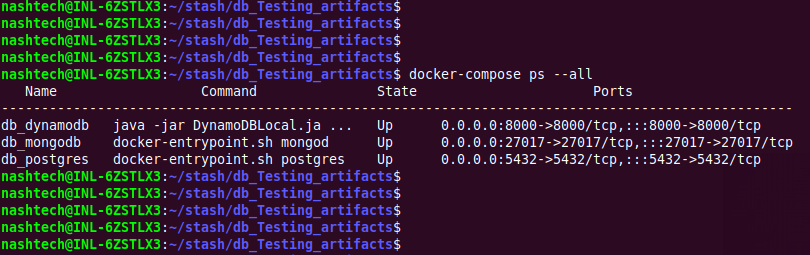
Databases are containerized using Docker for consistency and isolation.
Script used for Database Load Testing
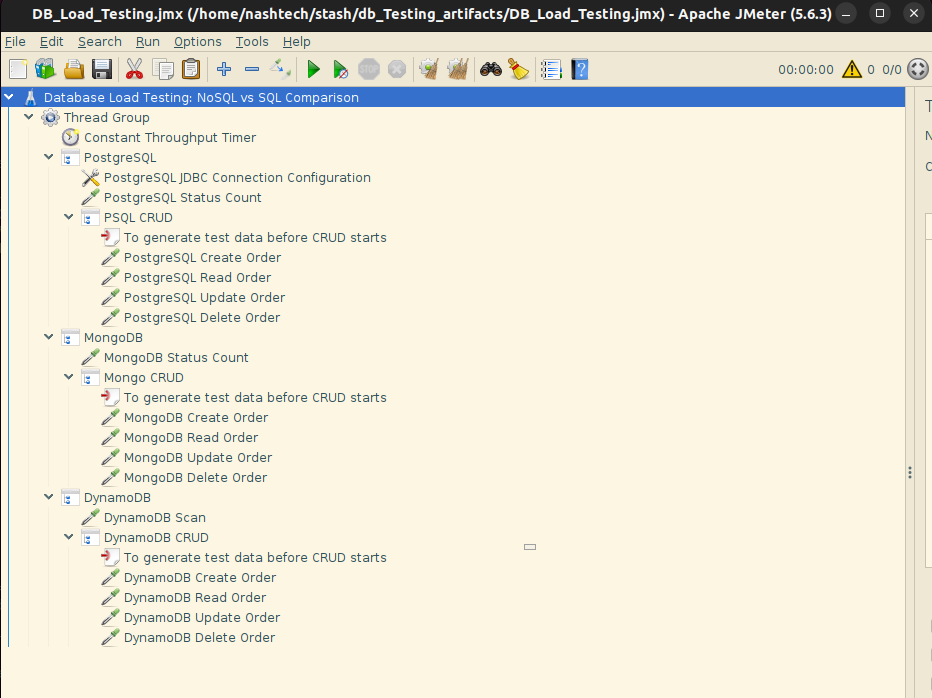
The JMeter script targets PostgreSQL (SQL), MongoDB, and DynamoDB (NoSQL). It uses three Transaction Controllers, each handling a specific database. These controllers encapsulate the operations relevant to their respective data stores, ensuring modularity and separation of concerns.
Structure
- Thread Group
- Configured with a Constant Throughput Timer set to 100 requests per minute (RPM).
- This setting ensures a controlled and uniform request rate across all test executions, providing consistent load conditions.
- Transaction Controllers (One per Database)
- PostgreSQL Controller
- Contains JDBC Samplers:
- One sampler performs aggregate queries, retrieving the count of all records grouped by their
"status"field. - Additional samplers execute CRUD operations (Create, Read, Update, Delete) to simulate typical database activity.
- MongoDB Controller
- Uses JSR223 Samplers with Groovy scripts:
- One sampler performs aggregation using the MongoDB aggregation pipeline to count documents by
"status". - Other samplers perform CRUD operations via MongoDB drivers and shell commands embedded in Groovy.
- DynamoDB Controller
- Includes JSR223 Samplers:
- One sampler performs aggregate-like functionality using DynamoDB scan and filter mechanisms to count items by
"status". - Other samplers carry out CRUD operations using the AWS SDK (through Groovy scripting).
- PostgreSQL Controller
- Timers and Configuration Elements
Purpose
The script is designed to:
- Evaluate the performance and responsiveness of SQL and NoSQL databases under a fixed load.
- Compare the efficiency of data aggregation across different storage technologies.
- Analyse how each database handles CRUD operations under uniform and sustained throughput.
- Provide insights into scalability and resource utilization by simulating realistic usage patterns.
Goal/Outcome
The execution of the script should yield:
- Response times for CRUD and aggregation queries across all databases.
- Throughput consistency, as influenced by the Constant Throughput Timer.
- Error rates, if any, indicating bottlenecks or limitations in the database configurations.
- Comparative data, useful for assessing:
- Query performance (especially aggregation)
- Latency differences
- Suitability of each database type for different application needs
This structured testing approach enables an objective analysis of PostgreSQL, MongoDB, and DynamoDB under identical simulated conditions, offering practical benchmarks for system design decisions.
Database Load Testing Report: SQL vs NoSQL Comparison
This report presents a comparative analysis of three databases-PostgreSQL (SQL), MongoDB (NoSQL), and DynamoDB (NoSQL)-under different load scenarios. The test scenarios include baseline, low-load, and high-load phases. Performance metrics such as average response time, maximum and minimum latency, percentile latencies (P90, P95, P99), throughput (requests per second), and error rates were derived using Python and the Pandas library.
Methodology
- Test Environment: Local Dockerized setup
- Load Levels: Baseline, Low, High
- Tools Used: JMeter for test execution, Python/Pandas for data analysis
- Test Types: CRUD (Create, Read, Update, Delete) operations and Aggregates
- Metrics Observed: Average, Median, P90, P95, and P99 response times, Throughput (RPS), Error rate
Summary of Findings
1. Baseline Load Analysis
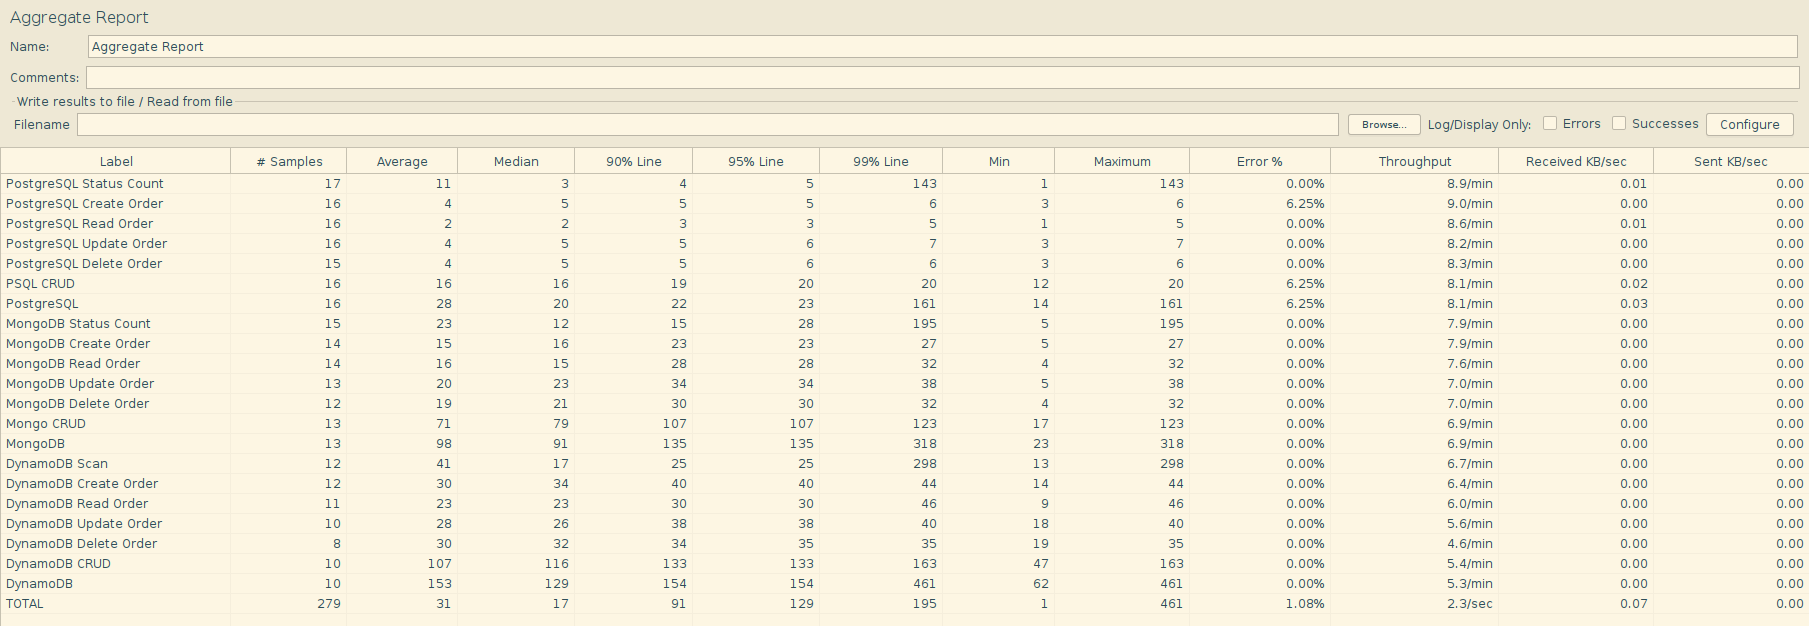
- PostgreSQL exhibited the fastest performance, especially for individual CRUD operations, with read times as low as 2.4ms.
- MongoDB maintained moderate response times, averaging around 75ms overall. The CRUD operations ranged from 12–18ms.
- DynamoDB showed the highest variability, with some operations (like Scan) reaching up to 309ms, while CRUD remained around 108ms.
Throughput Observations:
| Database | Avg. Throughput (rps) | Max Response Time (ms) |
|---|---|---|
| PostgreSQL | ~0.13 | 148 |
| MongoDB | ~0.12 | 391 |
| DynamoDB | ~0.11 | 496 |
2. Low Load Analysis
- PostgreSQL continued to outperform others, keeping CRUD operations under 5ms, even during low-load tests.
- MongoDB showed consistent behavior with slight increase in response time, yet stable throughput.
- DynamoDB‘s Scan and overall response time increased noticeably, with maximum times up to 514ms, indicating overhead during less frequent but varied access patterns.
3. High Load Analysis
- PostgreSQL showed exceptional stability, handling 100+ requests per minute with minimal increase in latency.
- Read and Update operations stayed under 5ms on average.
- MongoDB performance degraded moderately due to the increase in average response time of CRUD operation to 66ms.
- DynamoDB experienced the most significant impact under high load.
- Average response time spiked to 186ms.
- Peak response times remained at 500ms, particularly affecting scan and update operations.
Error Rates
All databases maintained zero error rates throughout all load scenarios, highlighting their reliability under the tested conditions.
Summary and Conclusion
| Metric | PostgreSQL | MongoDB | DynamoDB |
|---|---|---|---|
| Best Avg. Latency | ✅ (2.4–19 ms) | ❌ (12–80 ms) | ❌ (21–186 ms) |
| Best Throughput | ✅ (0.84 rps) | ⚠️ (0.20 rps) | ❌ (0.02–0.11 rps) |
| Stability Under Load | ✅ Excellent | ⚠️ Mid | ❌ Unstable |
| Error Rate | 0% | 0% | 0% |
Key Takeaway
PostgreSQL consistently outperformed both NoSQL counterparts across all load levels in terms of latency, throughput, and stability. MongoDB performed reasonably well but exhibited higher response time variance. DynamoDB showed the most performance degradation under load, although it maintained zero error rates throughout.
Conclusion
- PostgreSQL consistently delivered the best performance across all test phases, with minimal latency and stable throughput. It is optimal for latency-sensitive applications.
- MongoDB demonstrated balanced performance, making it suitable for use cases requiring flexible schema with moderate throughput needs.
- DynamoDB, although highly scalable in cloud-native architectures, underperformed in local setups—particularly in scan-heavy and high-load scenarios—indicating potential optimization needs in local or hybrid environments.
References
- Giuseppe DeCandia et al. (2007). Dynamo: Amazon’s Highly Available Key-value Store. ACM SIGOPS Operating Systems Review. https://www.allthingsdistributed.com/files/amazon-dynamo-sosp2007.pdf
- Chang et al. (2006). Bigtable: A Distributed Storage System for Structured Data. Google Inc., OSDI. https://static.googleusercontent.com/media/research.google.com/en//archive/bigtable-osdi06.pdf
- Apache JMeter (n.d.). Apache JMeter User Manual for Database Test Plan. https://jmeter.apache.org/usermanual/build-db-test-plan.html
- Nimrod Karmer (2024). Database Load Testing with JMeter: Step-by-Step Guide. https://daily.dev/blog/database-load-testing-with-jmeter-step-by-step-guide
- Grady Anderson (2025). How to Perform Load Testing on NoSQL Databases: A Comprehensive Step-by-Step Guide https://moldstud.com/articles/p-how-to-perform-load-testing-on-nosql-databases-a-comprehensive-step-by-step-guide
- Feli (2024). Git Repository of Docker-Compose PostgreSQL. https://github.com/felipewom/docker-compose-postgres
- Vladimir Koltunov (2020). How to persist data in a dockerized DynamoDB using volumes. https://stackoverflow.com/questions/52852473/how-to-persist-data-in-a-dockerized-dynamodb-using-volumes