


If you’ve ever tried Distributed Load Testing for WebSocket and Streaming APIs, you’ll know it’s a whole different beast compared to traditional REST API testing. I found this out the hard way when a real-time dashboard I worked on started to choke with just a handful of users. That experience sent me down the rabbit hole of real-time performance testing – and this blog is the map I wish I had.
In this post, I’ll walk you through how I built a distributed load testing setup using JMeter and k6, all running locally in Docker containers. I used a WebSocket Echo Server and a Server-Sent Events (SSE) server as test targets, stored the results in InfluxDB, and visualised everything using Grafana across four detailed dashboards. Alongside setup details, we’ll also break down a comparative analysis of performance between JMeter and k6.
Why Load Test WebSocket and Streaming APIs?
Let me start with a question: Have you ever seen your real-time app slow down dramatically when just a few users joined? That’s exactly the kind of issue load testing can help predict and prevent. WebSockets and Server-Sent Events (SSE) are common in chat apps, dashboards, games, and notification systems – anywhere real-time communication matters. Ensuring they scale well is not optional.
My Setup (And Why I Kept It Local)
Everything I ran was on my local system using Docker. Why?
- Control: I could simulate resource constraints and fine-tune containers.
- Cost-effective: No cloud bills.
- Speed: Quick iterations.
Components:
- WebSocket Echo Server (Docker)
- SSE Server (Docker)
- JMeter + Plugin Manager for WebSocket support
- k6 CLI
- InfluxDB: Stores metrics
- Grafana: Visualises test results
Distributed Load Testing? On Localhost?
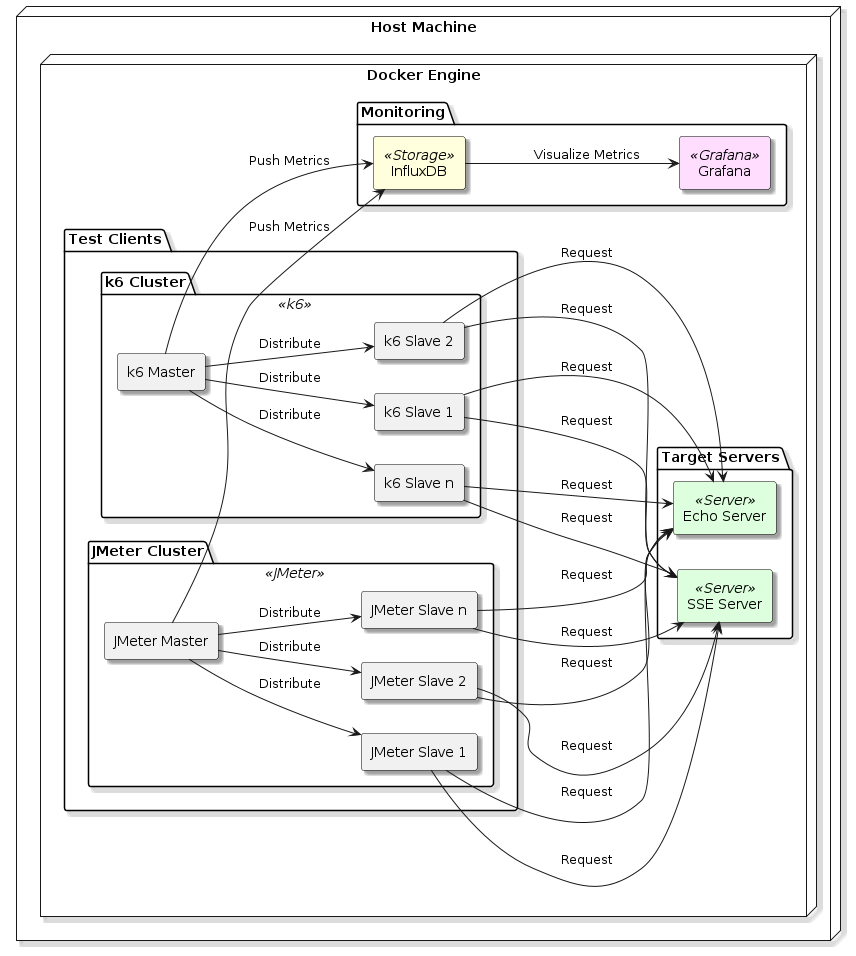
Yes. I spun up multiple Docker containers simulating virtual users from different isolated networks. While not “cloud distributed,” it helped model distributed behaviour on a single machine. Think of it as a rehearsal before a big stage performance.
JMeter: WebSocket + Streaming API
Challenges Faced:
- Plugin support: Out-of-the-box JMeter doesn’t support WebSocket, so I had to use the JMeter WebSocket Sampler plugin.
- Streaming (SSE): I used HTTP Samplers but tuned timeout and reconnection logic carefully.
Lessons Learnt:
- WebSocket connections aren’t “fire and forget.” Each virtual user keeps a connection alive.
- For SSE, buffer overflows and timeout disconnects were frequent under high load.
Distributed Load Testing Execution:
- Used containers as remote JMeter engines.
- CSV data files were mounted as Docker volumes.
- InfluxDB backend listener captured metrics.
k6: WebSocket + Streaming API
k6 was surprisingly elegant here.
Highlights:
- Built-in WebSocket support.
- Easy scripting with JS.
- Native support for streaming with timeout configs.
SSE with k6:
- Used HTTP
getwithAccept: text/event-streamheader. - Custom checks parsed streaming chunks.
Distributed Load Testing Execution:
- Each container ran
k6 runwith shared config from Docker Compose. --out influxdb=http://...directly piped metrics into InfluxDB.
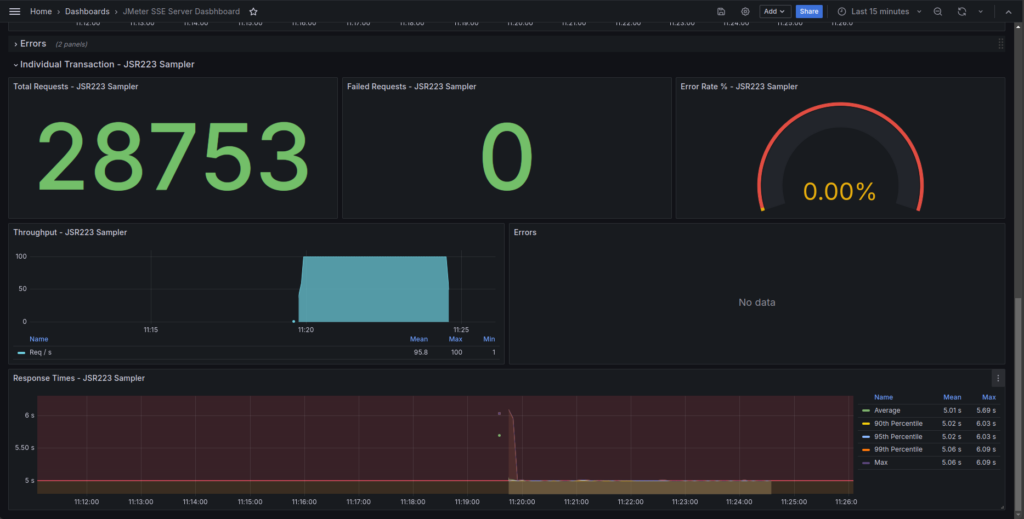
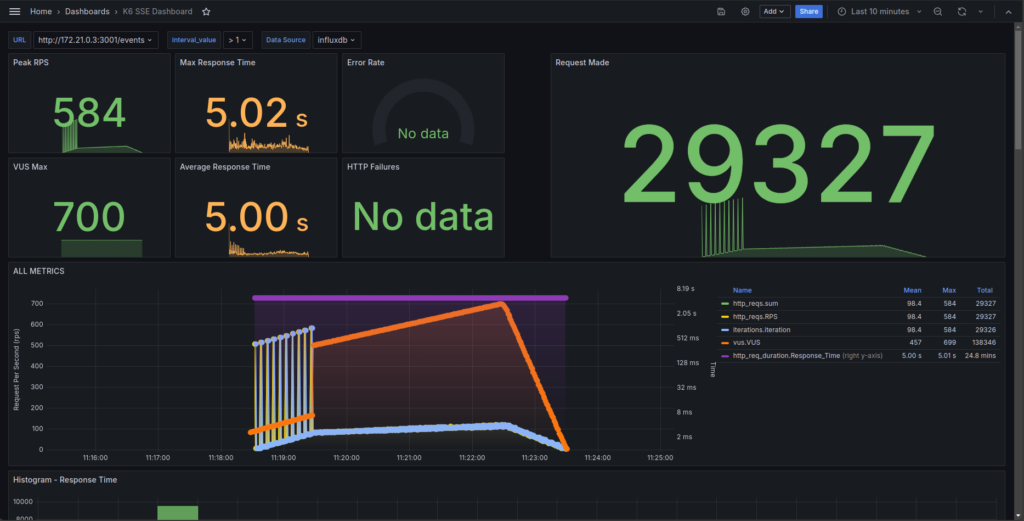
SSE Load Test Results: JMeter vs k6
| Metric | JMeter (JSR223 Sampler) | k6 (SSE test) |
|---|---|---|
| Total Requests | 28,753 | 29,327 |
| Peak Throughput (RPS) | 100 | 584 |
| Average RPS | ~95.8 | ~98.4 |
| Response Time (Avg) | 5.01 s | 5.00 s |
| Response Time (P99) | 5.06 s | 5.01 s |
| Max Response Time | 6.09 s | 5.02 s |
| Errors | 0 | 0 |
Comparative Insights
Throughput: k6 scales better under load with a higher peak RPS (584 vs. 100). However, average throughput remains close due to pacing logic.
Response Time: Both tools measure similar average latencies. JMeter has slightly higher outliers.
Errors: 0% errors across the board.
Dashboard Observability: k6 offers better granularity and visualisations in Grafana.
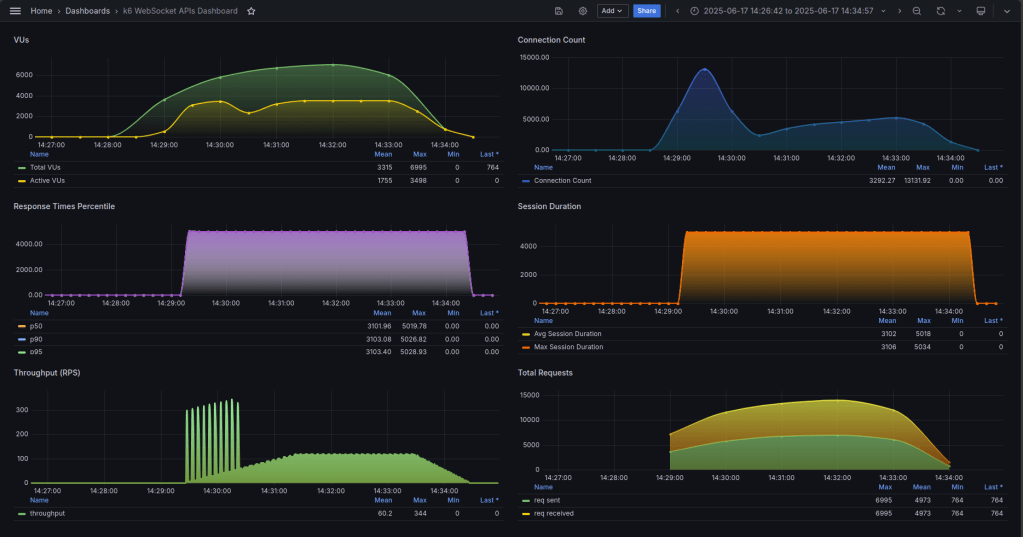
WebSocket Load Test Results: JMeter vs k6
| Metric | JMeter | k6 |
| Total Requests | 6,505 | 6,995 |
| Failed Requests | 0 | 0 |
| Peak Throughput (RPS) | ~1,060 | ~344 |
| Average Throughput (RPS) | ~651 | ~60.2 |
| Avg Response Time | 252 ms | ~3,102 ms |
| P90 Response Time | 538 ms | 3,103 ms |
| P95 Response Time | 640 ms | 3,103 ms |
| P99 Response Time | 744 ms | 3,103 ms |
| Max Response Time | 973 ms | 5,028 ms |

Comparative Insights
Throughput: JMeter delivered higher burst throughput (~1,060 RPS), ideal for short stress tests. k6 provided sustained, realistic load.
Latency: JMeter outperformed k6 in response times. k6 had consistent but higher latency due to test design (long-lived sessions).
Error Handling: Both tools recorded zero errors.
Setup Ease: JMeter remains simpler for quick validations, thanks to its GUI.
Summary Recommendations
| Aspect | Tool | Reason |
| Total Requests | k6 | Slightly more handled |
| Throughput | JMeter | Higher RPS in burst mode |
| Latency | JMeter | Faster average and p99 values |
| Load Realism | k6 | Realistic VU ramping and session control |
| Observability | k6 | More detailed Grafana visualisation |
| Ease of Setup | JMeter | GUI helps beginners |
Final Thoughts and Key Takeaways
These tests confirm that no single tool is universally best – it depends on your testing goals.
- If you need quick functional validations or simulate short bursts of traffic, JMeter is still highly effective. It’s straightforward to set up, especially for teams already using it for HTTP/API tests.
- On the other hand, if your priority is to test realistic, high-scale scenarios with gradual VU ramping, detailed observability, and clean time-series metrics, k6 provides a more modern and production-aligned experience.
Despite k6’s higher latencies in WebSocket tests, its consistency and rich visibility make it ideal for continuous performance monitoring and CI/CD integration.
The takeaway? Use both tools strategically:
- Start with JMeter for prototyping and low-volume checks.
- Scale up with k6 when preparing for production-grade loads or when metrics depth matters.
This hybrid approach gives you flexibility, speed, and confidence in your real-time systems.
If you’re testing WebSocket or SSE in your stack and you’re tackling similar challenges – Feel free to reach out. I’d love to offer help where I can.
References
- Comparing k6 and JMeter for load testing – Grafana Labs overview comparing features, workflows, and scalability https://grafana.com/blog/2021/01/27/k6-vs-jmeter-comparison/
- Performance Testing WebSockets with JMeter – OctoPerf guide on setting up WebSocket tests using JMeter plugins https://blog.octoperf.com/performance-testing-web-sockets-with-jmeter/
- k6 vs JMeter: A Modern Approach to Load Testing – Frugal Testing comparison of developer workflows, protocol support, and CI/CD integration https://www.frugaltesting.com/blog/k6-vs-jmeter-a-modern-approach-to-load-testing
- Distributed Load Testing With K6 – Distributed k6 tests are streamlined via Kubernetes operator workflows, as shown in Empathy.co’s practical example https://engineering.empathy.co/distributed-load-testing-with-k6/?utm_source=chatgpt.com