


In the fast-paced world of cloud-native development, effective logging and observability have become critical for maintaining robust, scalable applications. As .NET developers, we’re fortunate to have powerful tools at our disposal: Serilog and OpenTelemetry. These technologies, when combined, offer a comprehensive solution for monitoring and troubleshooting complex, distributed systems. In this blog post, we’ll dive deep into the world of Serilog and OpenTelemetry, exploring their individual strengths and the synergies they create when used together. Whether you’re building microservices, serverless functions, or traditional web applications, understanding these tools will empower you to create more resilient and maintainable .NET applications in cloud-native environments.
What is Serilog?
Serilog stands out as a versatile and powerful logging framework for .NET applications. Developed with modern software architectures in mind, Serilog offers structured logging capabilities that go beyond traditional text-based logs. At its core, Serilog allows developers to create rich, semantic logs that are both human-readable and machine-parseable.
Unlike conventional logging frameworks, Serilog treats log events as structured data rather than plain text. This approach enables developers to include complex objects and additional context in their logs, making it easier to search, filter, and analyze log data later. Moreover, Serilog’s flexible architecture supports various “sinks” – output destinations for log data – ranging from simple console output to sophisticated cloud-based logging services.
What are the advantages of using Serilog?
Serilog offers numerous benefits that make it a top choice for many .NET developers. First and foremost, its structured logging approach provides unparalleled flexibility in capturing and storing log data. This feature allows developers to include rich, contextual information in their logs, making troubleshooting and analysis significantly more efficient.
Additionally, Serilog boasts excellent performance, ensuring that logging doesn’t become a bottleneck in your application. It achieves this through clever use of buffering and asynchronous processing, minimizing the impact on your application’s main thread.
Furthermore, Serilog’s extensive ecosystem of sinks and enrichers allows for easy integration with various logging backends and services. Whether you need to log to a file, a database, or a cloud-based service, Serilog likely has a sink for it. This flexibility makes it easy to adapt your logging strategy as your application evolves.
Lastly, Serilog’s simple yet powerful API makes it easy to get started while still providing advanced features for more complex logging scenarios. Its fluent configuration allows developers to set up logging with just a few lines of code, while still offering fine-grained control over log formatting and routing.
Cloud Native Initiatives
Cloud Native initiatives for observability have become increasingly crucial as organizations embrace distributed systems and microservices architectures. These initiatives aim to provide comprehensive visibility into complex, dynamic environments, enabling teams to monitor, troubleshoot, and optimize their applications effectively.
However, the observability landscape remained fragmented, with different tools and standards for metrics, logs, and traces. This fragmentation led to challenges in correlating data across these different domains and increased the complexity of implementing comprehensive observability solutions.
Enter OpenTelemetry, a CNCF project that aims to unify observability practices and standards. OpenTelemetry’s role in cloud native observability initiatives is multifaceted and transformative:
- Standardization: OpenTelemetry provides a single, vendor-neutral standard for instrumenting, generating, collecting, and exporting telemetry data. This standardization simplifies the observability landscape, reducing the need for multiple, specialized tools and libraries.
- Cross-language support: With support for multiple programming languages, OpenTelemetry enables consistent observability practices across polyglot microservices architectures, which are common in cloud native environments.
- Correlation of telemetry data: OpenTelemetry allows for the correlation of metrics, logs, and traces, providing a more holistic view of application performance and behavior. This correlation is crucial for effective troubleshooting in complex, distributed systems.
- Ecosystem integration: OpenTelemetry integrates with a wide range of observability backends and tools, including popular cloud native projects like Prometheus and Jaeger. This integration facilitates easier adoption and migration paths for organizations already invested in specific observability tools.
- Reduced vendor lock-in: OpenTelemetry’s vendor-neutral approach allows organizations to switch between different observability backends without changing their instrumentation code, aligning with cloud native principles of portability and flexibility.
- Cloud provider support: Major cloud providers have embraced OpenTelemetry, offering native support and integration with their observability services. This support simplifies the implementation of observability in multi-cloud and hybrid cloud environments.
- Community-driven development: As a CNCF project, OpenTelemetry benefits from a vibrant, diverse community of contributors. This community-driven approach ensures that the project evolves to meet the changing needs of cloud native observability.
What is the benefit of OpenTelemetry with Serilog?
Combining OpenTelemetry with Serilog creates a powerful synergy that enhances the observability of your .NET applications. While Serilog excels at structured logging, OpenTelemetry brings standardized instrumentation and data collection for metrics and traces. By using these tools together, developers can create a comprehensive observability solution that covers all aspects of application telemetry.
One of the primary benefits of this combination is the ability to correlate logs with traces and metrics. This correlation provides a holistic view of your application’s behavior, making it easier to diagnose issues and understand performance bottlenecks. For instance, you can trace a request through your system while simultaneously examining logs and metrics at each step of the process.
Furthermore, using OpenTelemetry with Serilog future-proofs your observability strategy. As OpenTelemetry becomes more widely adopted, you’ll be able to easily switch between different observability backends without changing your instrumentation code. This flexibility can be particularly valuable in cloud native environments where requirements may change rapidly.
Serilog.Sinks.OpenTelemetry vs OpenTelemetry.Exporter.OpenTelemetryProtocol
When integrating OpenTelemetry, developers have two main options: Serilog.Sinks.OpenTelemetry and OpenTelemetry.Exporter.OpenTelemetryProtocol. While both achieve similar goals, they approach the integration from different angles.
- Serilog.Sinks.OpenTelemetry is a Serilog sink that sends log events directly to OpenTelemetry. This approach allows you to use Serilog’s powerful logging capabilities while still benefiting from OpenTelemetry’s standardized data model and export capabilities. It’s a great choice if you’re already using Serilog and want to add OpenTelemetry support with minimal changes to your existing logging setup.
- On the other hand, OpenTelemetry.Exporter.OpenTelemetryProtocol is part of the OpenTelemetry SDK. It provides a more direct integration with OpenTelemetry, allowing you to send telemetry data using the OpenTelemetry Protocol (OTLP). This approach gives you more control over the OpenTelemetry pipeline and is ideal if you’re building a new application or are willing to refactor your logging code to fully embrace OpenTelemetry.
The choice between these two options largely depends on your specific requirements and existing architecture. If you’re heavily invested in Serilog and want to add OpenTelemetry support gradually, Serilog.Sinks.OpenTelemetry might be the better choice. However, if you’re starting fresh or want to fully leverage OpenTelemetry’s capabilities, OpenTelemetry.Exporter.OpenTelemetryProtocol could be more suitable.
Steps to use Serilog with OpenTelemetry
- Install library Serilog.Sinks.OpenTelemetry using following command:
dotnet add package Serilog.Sinks.OpenTelemetry
If you are not using Serilog then install Serilog.Extensions.Logging as well.dotnet add package Serilog.Extensions.Logging - We are going to use grafana/otel-lgtm image along with Aspire to view these logs in Grafana and Loki. Add following code to AppHost project
We defined our container with name for and image to use. Using WithHttpEndpoint(), it exposes these ports to our local machine. - Add the following code in Function App to configure Serilog which will export logs to specified endpoint

Here, we configured Serilog OpenTelemetry sink and also created ActivityListener object which is crucial for serilog to start exporting logs. - Usage of logger will remain same, no need to change anything. You can also use DI injected ILogger instance

- Finally, run the AppHost project which will run all the containers and projects mentioned.
Aspire Dashboard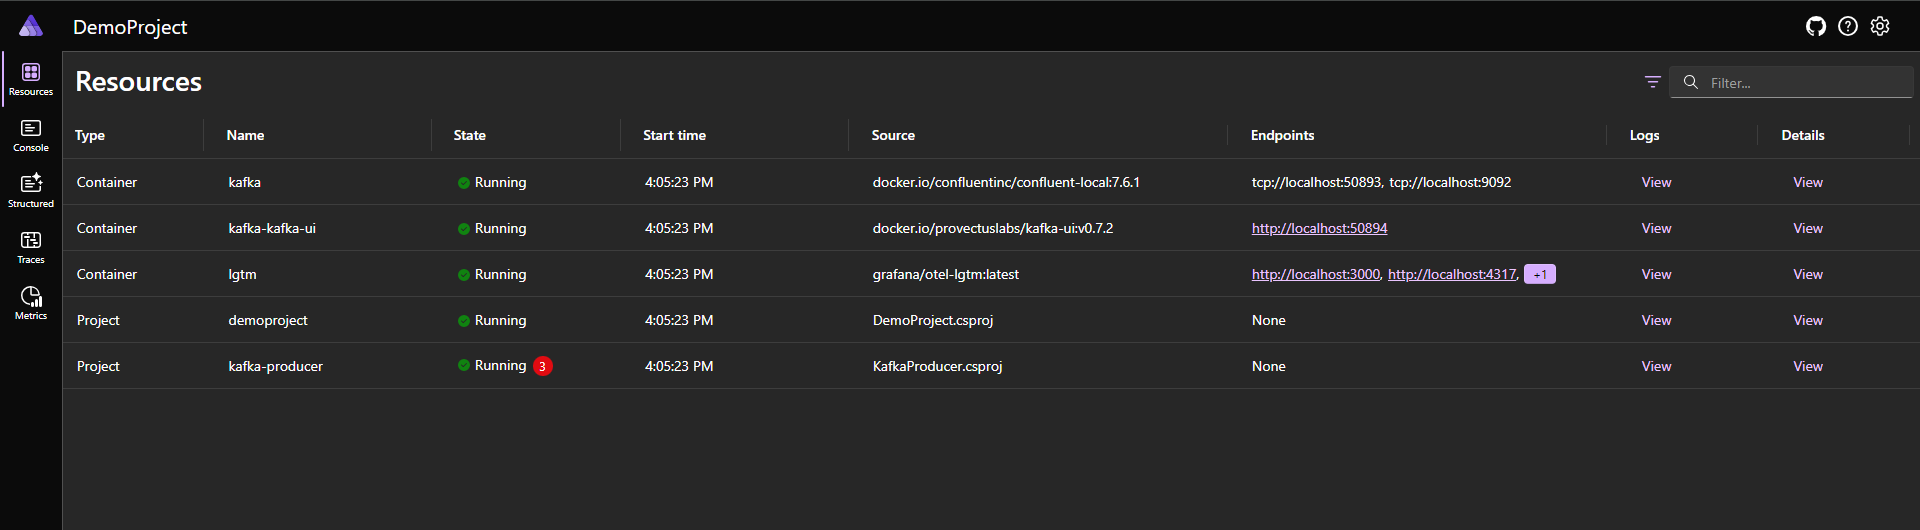
Grafana Dashboard will be available at port 3000. In there, go to Explore -> Loki -> Click on filter dropdown to select your service. You’ll find your logs are correctly being imported in there
Code snippets used:
a. Configuring Serilog: You can add this in your Program.cs or ServiceDefaults project for reuse
builder.Logging.ClearProviders();
Log.Logger = new LoggerConfiguration()
.WriteTo.OpenTelemetry(options =>
{
options.Endpoint = "http://localhost:4317";
options.Protocol = OtlpProtocol.Grpc;
options.ResourceAttributes = new Dictionary<string, object>
{
["service.name"] = "DemoProject",
["deployment.environment"] = "production"
};
})
.WriteTo.Console()
.CreateLogger();
builder.Logging.AddSerilog(Log.Logger);
using var listener = new ActivityListener();
listener.ShouldListenTo = _ => true;
listener.Sample = (ref ActivityCreationOptions<ActivityContext> _) => ActivitySamplingResult.AllData;
ActivitySource.AddActivityListener(listener);
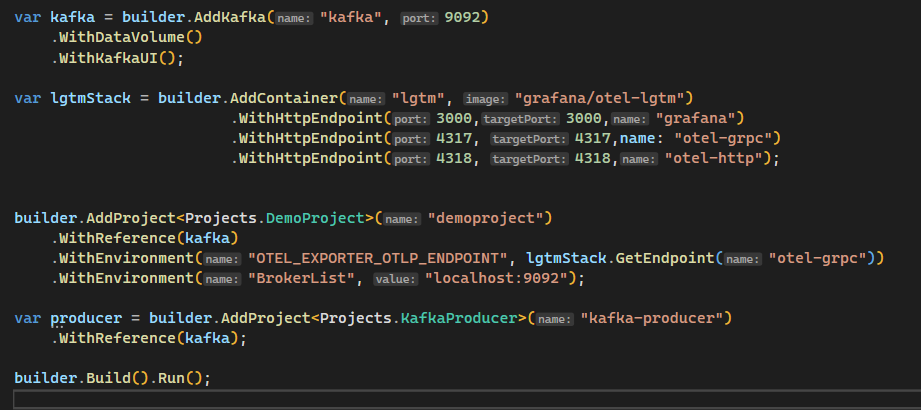
var source = new ActivitySource("test.example", "1.0.0");b. Aspire AppHost project:
var kafka = builder.AddKafka("kafka", 9092)
.WithDataVolume()
.WithKafkaUI();
var lgtmStack = builder.AddContainer("lgtm", "grafana/otel-lgtm")
.WithHttpEndpoint(3000,3000,"grafana")
.WithHttpEndpoint(4317, 4317,name: "otel-grpc")
.WithHttpEndpoint(4318, 4318,"otel-http");
builder.AddProject<Projects.DemoProject>("demoproject")
.WithReference(kafka)
.WithEnvironment("OTEL_EXPORTER_OTLP_ENDPOINT", lgtmStack.GetEndpoint("otel-grpc"))
.WithEnvironment("BrokerList", "localhost:9092");
var producer = builder.AddProject<Projects.KafkaProducer>("kafka-producer")
.WithReference(kafka);
builder.Build().Run();Conclusion
In conclusion, the integration of Serilog and OpenTelemetry represents a significant leap forward in .NET application observability, especially in cloud-native environments. By leveraging Serilog’s powerful structured logging capabilities and OpenTelemetry’s standardized approach to telemetry data, developers can create comprehensive monitoring solutions that provide deep insights into application behavior and performance.