


Grafana is one of the most popular open-source platforms for monitoring and observability. It allows you to visualize data from multiple sources, creating powerful and interactive dashboards. Whether you’re a developer, a system administrator, or a business analyst, Grafana Dashboard provides the tools you need to track performance, understand trends, and make data-driven decisions.
Why Do We Need Grafana?
In today’s fast-paced world, systems and applications generate a large amount of data. To ensure everything runs smoothly, businesses need real-time insights into their infrastructure, applications, and logs. This is where Grafana comes into play. By integrating with various data sources, Grafana helps organizations visualize, monitor, and alert on key metrics.
Grafana enables:
- Real-time Monitoring: Keep track of system performance, application health, and more in real time.
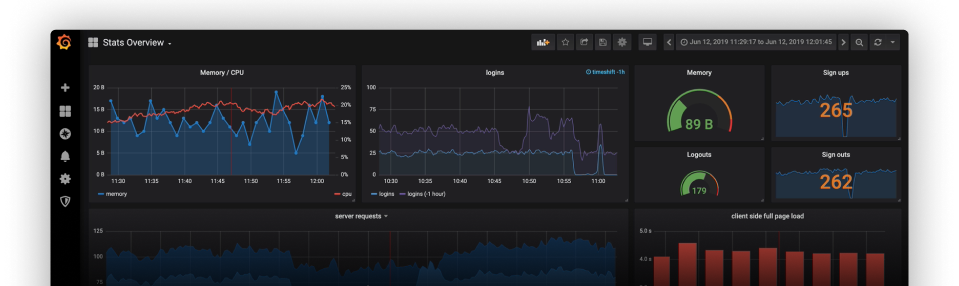
- Data Visualization: Create insightful and customized dashboards that present metrics in a meaningful way.
- Alerting: Set up alerts to receive notifications when metrics deviate from expected thresholds.
- Data Source Integration: Grafana supports numerous data sources like Prometheus, InfluxDB, Elasticsearch, MySQL, and others.
Grafana’s flexibility allows you to integrate data from multiple sources, consolidate it in one place, and analyze it with ease.
Steps to Get Started with Grafana Dashboard
Here’s a detailed guide on how to set up and use Grafana:
1. Install Grafana
Before you can start building dashboards, you need to install Grafana on your machine or server. Grafana supports various platforms including Linux, macOS, and Windows.
Linux(Ubuntu):
- Update the package repository:bashCopy code
sudo apt-get update - Install Grafana:bashCopy code
sudo apt-get install -y software-properties-common sudo add-apt-repository "deb https://packages.grafana.com/oss/deb stable main" sudo apt-get update sudo apt-get install grafana - Start the Grafana service:bashCopy code
sudo systemctl start grafana-server sudo systemctl enable grafana-server
Mac:
- Install using Homebrew:bashCopy code
brew install grafana - Start Grafana:bashCopy code
brew services start grafana
Windows:
- Download the Grafana installer from the official Grafana website.
- Follow the installation wizard to install it on your machine.
- Once installed, you can start Grafana by running it from the Start menu.
2. Access the Grafana Web Interface
Once Grafana is installed and running, you can access the Grafana dashboard through your browser. By default, Grafana runs on port 3000.
Open a web browser and navigate to:
arduinoCopy codehttp://localhost:3000
The default login credentials are:
- Username:
admin - Password:
admin
You’ll be prompted to change the password after logging in for the first time.
3. Importing Data: Adding Data Sources
Before you start creating dashboards, you need to tell Grafana Dashboard which data sources you want to use. Grafana allows you to add a variety of data sources, such as:
- Time Series Databases: Like Prometheus, InfluxDB.
- Logging and Document Databases: Like Elasticsearch, Loki.
- Distributed Tracing: For monitoring distributed applications.
- SQL Databases: Such as MySQL, PostgreSQL.
- Cloud Providers: Integrating data from platforms like AWS, GCP, or Azure.
One commonly used data source is Prometheus, which stores time-series data, especially for monitoring. To use Prometheus as a data source in Grafana:
- In Grafana, open the sidebar and click on Settings (gear icon).
- Under Connections, click on Data Sources.
- Click the Add Data Source button and select Prometheus.
- In the Prometheus Server URL text box, enter
http://prometheus:9090(or the appropriate URL for your Prometheus instance). - Click Save & Test to verify that Grafana can successfully connect to Prometheus.
You can easily send Prometheus data to InfluxDB using the Telegraf plugin, which allows you to combine Prometheus data with other data sources. InfluxDB works natively with Grafana, enabling you to query and visualize all your data in one place.
4. Create a Grafana Dashboard
Once you’ve added your data source, you can create a dashboard to visualize the metrics from that data source.
- On the left sidebar, click on the Plus (+) icon, and then click Dashboard.
- Grafana will open a new dashboard where you can start adding panels (visualizations).
- Click Add new panel.
- Choose the type of visualization (e.g., Graph, Table, Gauge, etc.).
- Configure the panel by selecting the data source and specifying the queries that define the data you want to visualize.
- Once the panel is configured, click Apply to add it to the dashboard.
You can add multiple panels to a single dashboard, each displaying different metrics or visualizations.
5. Customize and Arrange Panels
Grafana Dashboard allows you to arrange and customize panels in various ways. You can:
- Resize panels by dragging the corners.
- Rearrange panels by dragging them to a new position on the grid.
- Configure panel settings like titles, thresholds, and colors to make the dashboard more informative.
You can also create multiple rows in a dashboard to organize the panels into logical groups.
6. Set Up Alerts
One of the key features of Grafana Dashboard is its ability to set up alerts based on specific conditions. Alerts notify you when a metric crosses a defined threshold, helping you stay on top of issues before they escalate.
To set up an alert:
- Click on a panel.
- In the panel editor, go to the Alert tab.
- Click Create Alert.
- Define the alert condition (e.g., when CPU usage exceeds 90%).
- Set the evaluation frequency (e.g., every minute).
- Configure the alert notifications (e.g., email, Slack, etc.).
Once set, Grafana will notify you whenever the defined condition is met.
7. Share Your Grafana Dashboard
Grafana allows you to share dashboards with others, making it easy to collaborate or show your insights.
To share a dashboard:
- Click the Share button at the top of the dashboard.
- You can share the dashboard link, embed the dashboard in a webpage, or export it as JSON.
8. Explore Plugins and Extensions
Grafana has a rich ecosystem of plugins that extend its functionality. You can install plugins for new data sources, visualizations, and integrations. To explore plugins:
- Go to Settings > Plugins.
- Browse the available plugins and click Install to add them to your Grafana instance.
Some popular plugins include:
- Worldmap Panel: For visualizing location-based data on a map.
- Grafana Image Renderer: For exporting dashboards as PNG images.
- Alertmanager: For managing alert notifications more efficiently.
Best Practices for Using Grafana Dashboard
- Use Templates: Grafana allows you to use variables and templates in your queries, making dashboards more flexible and reusable across different environments.
- Group Dashboards by Use Case: Organize dashboards into folders based on teams, projects, or use cases to keep everything manageable.
- Limit Data Retention: Set up data retention policies in your data sources to ensure that you’re not storing excessive historical data in Grafana.
- Leverage Annotations: Use annotations to mark important events or milestones on your dashboards for context.
References: https://grafana.com/grafana/dashboards/
Conclusion
Grafana is a powerful tool that can help organizations visualize, monitor, and analyze their data in a way that is both meaningful and actionable. Whether you’re tracking server performance, application metrics, or business KPIs, Grafana provides a comprehensive solution for data visualization and alerting. By following the steps outlined above, you can quickly set up Grafana and start building insightful dashboards that empower you to make informed decisions. With its flexibility and extensibility, Grafana is a must-have tool for anyone looking to gain deeper insights into their data.