


Introduction
Today, writing clear and concise documentation is important for developers and teams. Diagrams help explain ideas better than just text. People can understand the whole picture instead of focusing some words. They often use popular tools like draw.io, Visio, Paradigm, Power Designer… but they can take a lot of times and make version control a significant challenge.
Mermaid is a simple tool that lets you create diagrams using code.
Mermaid is a JavaScript-based diagramming and charting tool that uses Markdown-inspired text definitions and a renderer to create and modify complex diagrams. The main purpose of Mermaid is to help documentation catch up with development.
Mermaid supports a wide variety of diagram types, including flowcharts, sequence diagrams, Gantt charts, class diagrams, Git graphs, C4 model, and more.
graph TD
    A[Start] --> B(Process)
    B --> C{Decision?}
    C -- Yes --> D[End]
    C -- No --> B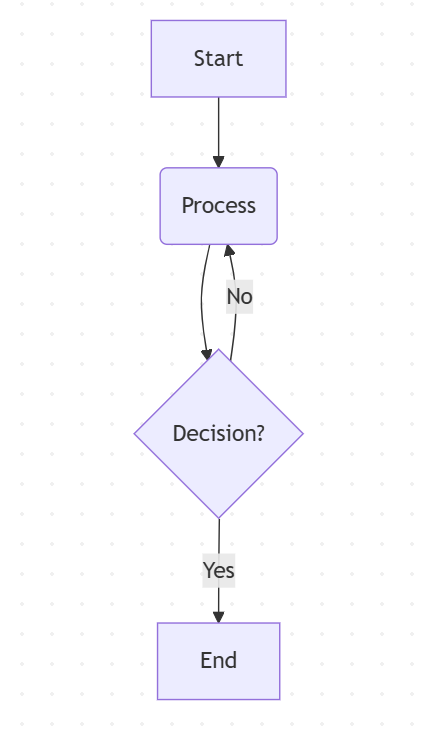
Why use Mermaid?
As developers, we want to make things clear, but tools like draw.io or Miro take time. Many developers forget to update diagrams, or they don’t create them at all. This causes confusion later.
There is a real case in my team: one member drew an Azure workflow diagram using draw.io, export it into an image and embedded it into a Jira task. But they didn’t share the source file. When they left the company, no one could update the diagram. We had to redraw it from scratch. This wasted time and made the document hard to maintain.
Mermaid helps fix this.
Mermaid uses simple code to describe diagrams. You can store directly inside your documentation or codebase. Many platforms as Github, Gitlab, and other sites support Mermaid directly. For another platform like WordPress, Jira, … you can use plugin or javascript to display diagrams.
Setting Up Mermaid
Include the Mermaid Library:
https://cdnjs.cloudflare.com/ajax/libs/mermaid/11.5.0/mermaid.min.jsAdd Mermaid diagrams by making a mermaid code block
```mermaid
    your code goes here
    .
    .
    .

```
Example:
```mermaid
flowchart LR
  A --> B
```
Otherwise, you can create diagrams using online tools. There are useful options
- The Mermaid Live Editor at https://mermaid.live.
- Mermaid Flow: https://www.mermaidflow.app/editor
Basic Syntax Overview
There are many diagrams that you can make with Mermaid. In this section, I only introduce some diagrams.
Flowchart
A flowchart is a type of diagram that represents a workflow or process. A flowchart can also be defined as a diagrammatic representation of an algorithm, a step-by-step approach to solving a task.
flowchart TD;
    A[Start] --> B[Process 1];
    B --> C[Process 2];
    C --> D[End];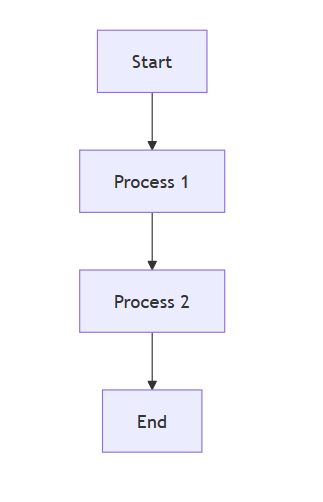
flowchart TD;means Top to Down (from top to bottom).- Each step is in square brackets
[]. - The arrows
-->show how the steps connect.
Using style with Mermaid
You can customize colors and styles using classDef and apply them with :::className
flowchart TD
  %% Define custom styles
  classDef methodCall fill:#DDEEFF,stroke:#3377CC,stroke-width:1px
  classDef logic fill:#60a917,stroke:#60a917,stroke-width:1px, color:#FFFFFF
  classDef memberAccess fill:#d5e8d4,stroke:#33AA33,stroke-width:1px
  classDef leaf fill:#E0E0FF,stroke:#3333CC,stroke-width:1px
  classDef source fill:#FFDDDD,stroke:#CC3333,stroke-width:1px
  classDef redStrong fill:#a20025,stroke:#990000,stroke-width:2px, color:#FFFFFF

  %% Nodes with styling
  A[(Blogs)]:::source
  B["MethodCall (Where)"]:::methodCall
  C[GreaterThan]:::logic
  D[MemberAccess]:::memberAccess
  E[x]:::leaf
  F[Id]:::leaf
  G[1]:::redStrong
  H["MethodCall (OrderBy)"]:::methodCall
  I[MemberAccess]:::memberAccess
  J[x]:::leaf
  K[Name]:::leaf

  %% Arrows
  B --> A
  B --> C
  C --> D
  D --> E
  D --> F
  C --> G
  H --> B
  H --> I
  I --> J
  I --> K
Note:
classDefis used to define the style (fill color, border color, text color, border width).:::classNameis used to apply that style to a specific node.
Entity Relationship Diagram (ERD)
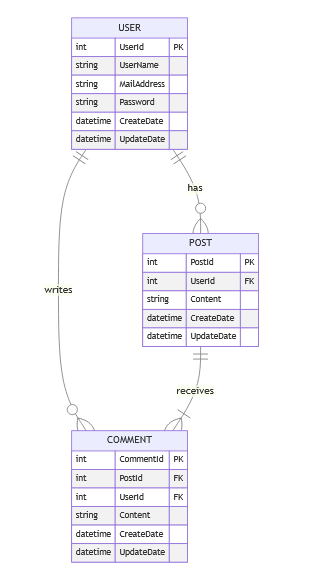
Entity Relationship Diagrams (ERDs) show how data is structured in a database. They are useful for backend developers or database designers.
Here’s a simple ERD for a blog system with User, Post, and Comment
erDiagram
    USER ||--o{ POST : has
    USER ||--o{ COMMENT : writes
    POST ||--|{ COMMENT : receives

    USER {
        int UserId PK
        string UserName
        string MailAddress
        string Password
        datetime CreateDate
        datetime UpdateDate
    }

    POST {
        int PostId PK
        int UserId FK
        string Content
        datetime CreateDate
        datetime UpdateDate
    }

    COMMENT {
        int CommentId PK
        int PostId FK
        int UserId FK
        string Content
        datetime CreateDate
        datetime UpdateDate
    }
Note
erDiagram
  USER ||--o{ POST : has
POST ||--|{ COMMENT : receives||--o{means one-to-many relationship|{means many on that side.- The word at the end (like
has,receives) is just a label to describe the relationship.
Mindmap
You can draw a mindmap in Mermaid using the mindmap syntax, which is perfect for organizing ideas visually. To make your mindmap more engaging, Mermaid also supports Font Awesome icons. To use them, simply add fa, fa-brand, fa-solid,… before the icon name, like fa-solid fa-code for a code.
mindmap
    [Technical Skills]
    ::icon(fa fa-cogs)
        Programming
        ::icon(fa fa-code)
            .NET
            ::icon(fa fa-hashtag)
            Python
            ::icon(fa-brands fa-python)
            Javascript
            ::icon(fa-brands fa-js)
                Node JS
                ::icon(fa fa-server)
                React
                ::icon(fa-brands fa-react)
                Angular
                ::icon(fa fa-code-branch)
        Database
        ::icon(fa fa-database)
        Cloud
        ::icon(fa fa-cloud)
            Microsoft Azure
            ::icon(fab fa-microsoft)
                Azure Functions
                ::icon(fa fa-bolt)
                Blob Storage
                ::icon(fa fa-folder-open)
            AWS
            ::icon(fa-brands fa-aws)
        Tool
        ::icon(fa fa-wrench)
            Visual Studio <br />Visual Studio Code
            ::icon(fa fa-code)
            Postman
            ::icon(fa fa-paper-plane)
        Soft Skills
        ::icon(fa fa-users)
            Communication
            ::icon(fa fa-comments)
            Problem Solving
            ::icon(fa fa-lightbulb)
            Time Management
            ::icon(fa fa-clock)
Wrapping Up
Now that we’ve explored how Mermaid works, and how to use it to draw flowcharts, class diagrams, and ER diagrams with simple code, you can start using it in your own projects or documentation.
That’s the end of this quick guide — thanks for reading! All diagrams in this article were created using Mermaid. If you’re curious, you can copy the Mermaid code and try it yourself in Mermaid Live Editor.
References
- Mermaid Official Docs: https://mermaid.js.org/intro/
- Github Mermaid: https://github.com/mermaid-js/mermaid
- The Expression Tree diagram in this post: Entity Framework Core Internals: Query Pipelines – NashTech Blog