


In today’s world of complex infrastructures and services, monitoring has become an essential part of maintaining and optimizing system performance. Among the many tools available for monitoring, Telegraf stands out due to its versatility and ease of use. This guide will provide you with a comprehensive introduction to Telegraf, from installation to basic configuration, helping you get started with this powerful monitoring agent.
What is Telegraf?
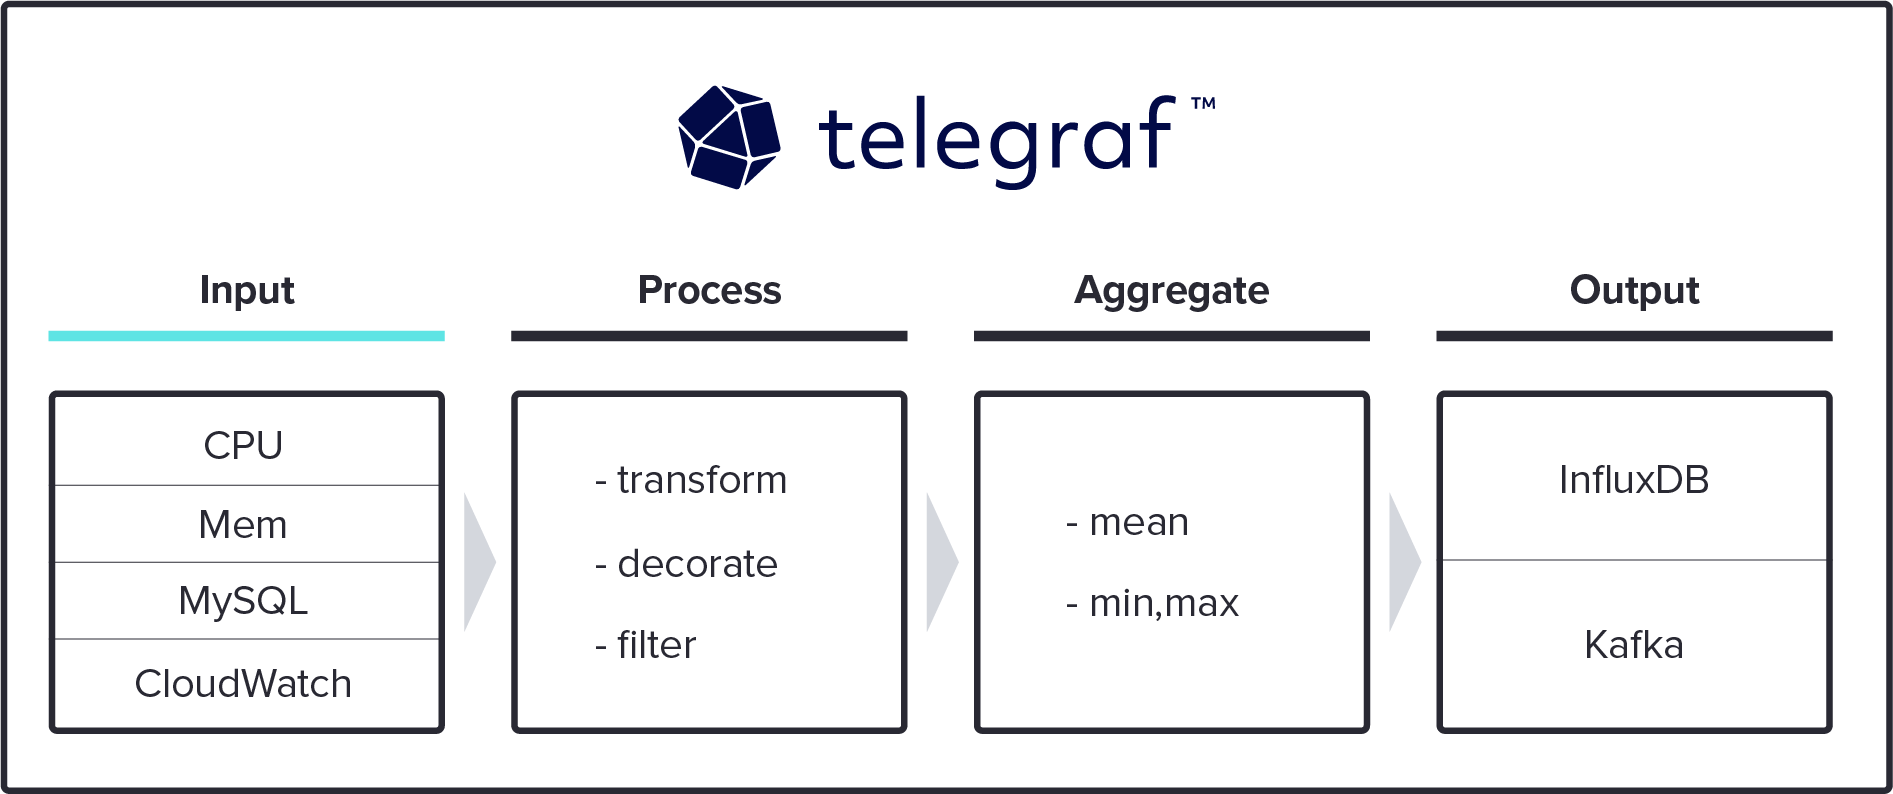
Telegraf is a server agent for collecting and reporting metrics. It is part of the TICK stack, which includes Telegraf, InfluxDB, Chronograf, and Kapacitor. Developed by InfluxData, Telegraf is designed to be easily extendable, with a wide variety of plugins available to gather metrics from different systems and services.
Why Use Telegraf?
Telegraf offers several key benefits:
- Extensive Plugin Ecosystem: Telegraf supports over 200 plugins for collecting data from various sources, including databases, systems, and applications.
- Ease of Use: It is simple to install and configure, making it accessible for beginners.
- Efficient: Telegraf is lightweight and designed to handle high-throughput metrics collection with minimal resource usage.
- Integration with InfluxDB: Seamless integration with InfluxDB for storing and querying time-series data.
Installing Telegraf
To get started with Telegraf, you need to install it on your system. The installation process varies depending on your operating system.
Installing Telegraf on Ubuntu/Debian
- Add the InfluxData repository:
wget -qO- https://repos.influxdata.com/influxdb.key | sudo apt-key add -
source /etc/os-release
echo "deb https://repos.influxdata.com/${ID} ${VERSION_CODENAME} stable" | sudo tee /etc/apt/sources.list.d/influxdb.list
- Update the package list and install Telegraf:
sudo apt-get update
sudo apt-get install telegraf
Installing Telegraf on CentOS/RHEL
- Add the InfluxData repository:
sudo tee /etc/yum.repos.d/influxdata.repo <<EOF
[influxdata]
name=InfluxData Repository - RHEL \$releasever
baseurl=https://repos.influxdata.com/rhel/\$releasever/\$basearch/stable
enabled=1
gpgcheck=1
gpgkey=https://repos.influxdata.com/influxdb.key
EOF- Install Telegraf:
sudo yum install telegrafInstalling Telegraf on macOS
- Use Homebrew to install Telegraf:
brew update
brew install telegraf
Installing Telegraf on Windows
- Download the Telegraf binary from the official website.
- Extract the zip file and move the
telegrafbinary to a directory of your choice. - Add the directory containing
telegraf.exeto your system PATH.
Configuring Telegraf
After installing Telegraf, the next step is configuring it to collect metrics. The main configuration file for Telegraf is telegraf.conf, typically located in /etc/telegraf/ on Linux systems or in the directory where you extracted it on Windows.
Generating a Configuration File
Firstly, you can generate a default configuration file using the following command:
telegraf config > /etc/telegraf/telegraf.confThis file contains settings for global tags, agent configuration, and plugins.
Basic Configuration Sections
- Global Tags: These are tags that will be added to every metric collected by Telegraf.
[global_tags]
dc = "us-east-1"- Agent Configuration: This section defines the behavior of the Telegraf agent.
[agent]
  interval = "10s"
  round_interval = true
  metric_batch_size = 1000
  metric_buffer_limit = 10000
  collection_jitter = "0s"
  flush_interval = "10s"
  flush_jitter = "0s"
  precision = ""
  debug = false
  quiet = false
  logfile = ""
hostname = ""- Output Plugins: These plugins define where Telegraf sends the collected metrics. For instance, to send metrics to InfluxDB:
[[outputs.influxdb]]
urls = [“http://localhost:8086”]
database = “telegraf”
retention_policy = “”
write_consistency = “any”
timeout = “5s”
- Input Plugins: These plugins define what metrics Telegraf collects. For example, to collect system metrics:
[[inputs.cpu]]
  percpu = true
  totalcpu = true
  collect_cpu_time = false
  report_active = false
Starting Telegraf
On Linux:
sudo systemctl start telegraf
sudo systemctl enable telegraf
On macOS:
telegraf --config /usr/local/etc/telegraf.conf
On Windows:
telegraf.exe --config telegraf.confUsing Telegraf Plugins
Telegraf’s strength lies in its extensive plugin ecosystem. Here are a few commonly used plugins:
— System Metrics —
Above all, Telegraf can collect a wide range of system metrics, such as CPU usage, memory usage, disk usage, and network statistics.
- CPU Metrics:
[[inputs.cpu]]
  percpu = true
  totalcpu = true
  collect_cpu_time = false
report_active = false- Memory Metrics:
[[inputs.mem]]- Disk Metrics:
[[inputs.disk]]
ignore_fs = ["tmpfs", "devtmpfs"]- Network Metrics:
[[inputs.net]]— Application Metrics —
In addition, Telegraf can also collect metrics from various applications, such as databases and web servers.
- MySQL Metrics:
[[inputs.mysql]]
  servers = ["root:password@tcp(localhost:3306)/"]
- NGINX Metrics:
[[inputs.nginx]]
  urls = ["http://localhost/status"]
— Custom Metrics —
Also, if you need to collect custom metrics, you can use the exec plugin to run scripts and commands.
[[inputs.exec]]
commands = [“your_script.sh”]
timeout = “5s”
data_format = “influx”
Visualizing Metrics by Setting Up Grafana
In addition, after collecting metrics with Telegraf and sending them to a time-series database like InfluxDB, you can use a visualization tool like Grafana to create dashboards and monitor your data.
- Install Grafana
sudo apt-get install -y adduser libfontconfig1
wget https://dl.grafana.com/oss/release/grafana_8.0.6_amd64.deb
sudo dpkg -i grafana_8.0.6_amd64.deb- Start Grafana
sudo systemctl start grafana-server
sudo systemctl enable grafana-server- Add InfluxDB as a Data Source:
- Open Grafana in your web browser (
http://localhost:3000). - Go to Configuration > Data Sources.
- Add InfluxDB and configure it with the details of your InfluxDB instance.
- Create Dashboards
Lastly, Use the metrics collected by Telegraf to create dashboards and visualize your data.
Conclusion
In short, Telegraf is a powerful and versatile tool for collecting and reporting metrics from various systems and applications. Altogether, ith its extensive plugin ecosystem and ease of use, it provides a comprehensive solution for monitoring infrastructure and applications. By following this guide, you should now have a solid foundation to start using Telegraf for your monitoring needs, from installation and configuration to visualizing your metrics in Grafana. Happy monitoring!
I hope this gave you some useful insights. Please feel free to drop any comments, questions or suggestions. Thank You !!!