


Hello Readers!!! In this blog we’ll see how we can create Infra Alerts High CPU Utilisation-Instance Down alerts in Apigee. Monitoring high CPU utilization and setting up alerts for VM instance downs are crucial aspects of maintaining the health and performance of your Apigee X deployment on Google Cloud Platform (GCP).
Overview
Infra Alerts in API Management plays a very vital role as your working instance may get down or stopped due to some issues. This page provides the information about the infrastructure alerts related to High CPU Utilisation-Instance Down alerts in Apigee in Apigee, specifically targeting VM instances in your environment on Google Cloud Platform (GCP). This ensures timely detection and response to potential issues, preventing service disruptions.
Steps For Infra Alerts for VM Instance Down (High CPU Utilisation)
To create an infra alerts for VM Instance Down (High CPU Utilisation) follow the below steps:
Configuring Metric Based Alerts:
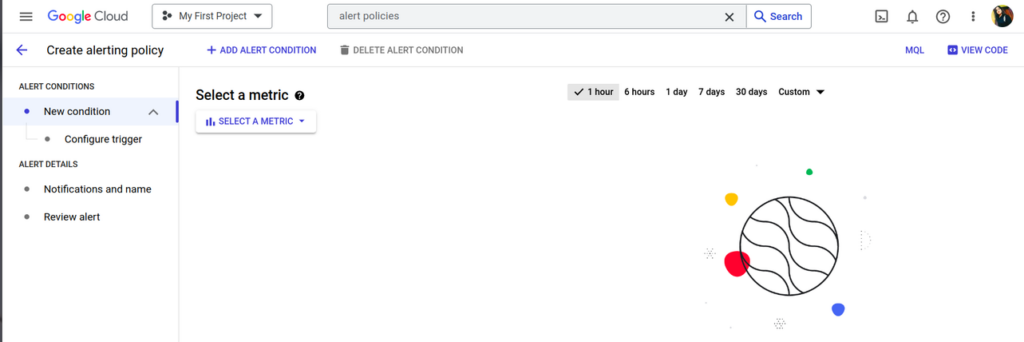
Step-1 These alerts are triggered by changing in API Metrics. Open the Create alerting policy page in the Google Cloud console.
STEP-2 Select a metric.
STEP-3 Deselect Show only active resources & metrics.
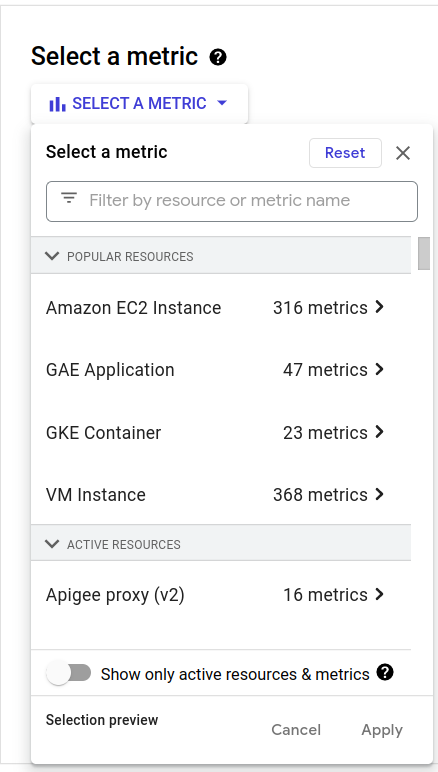
STEP-4 Select a metric as follows:
- Copy and paste the following in the Select metric field:
| apigee.googleapis.com/VM Instance/instance/CPU utilization |
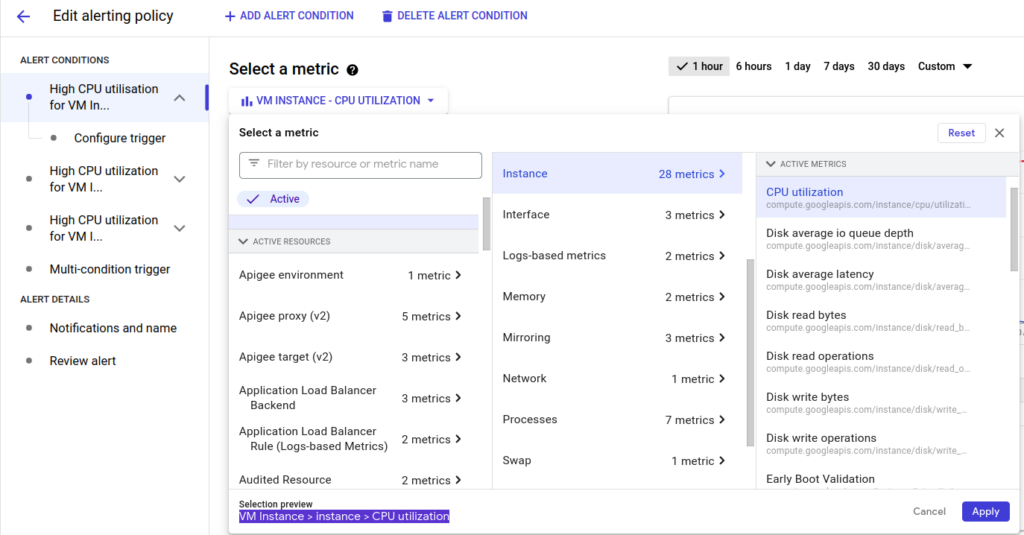
- Select VM Instance
- In the pane that opens to the right, select instance
- Then, CPU utilization in the next pane
- Click Apply
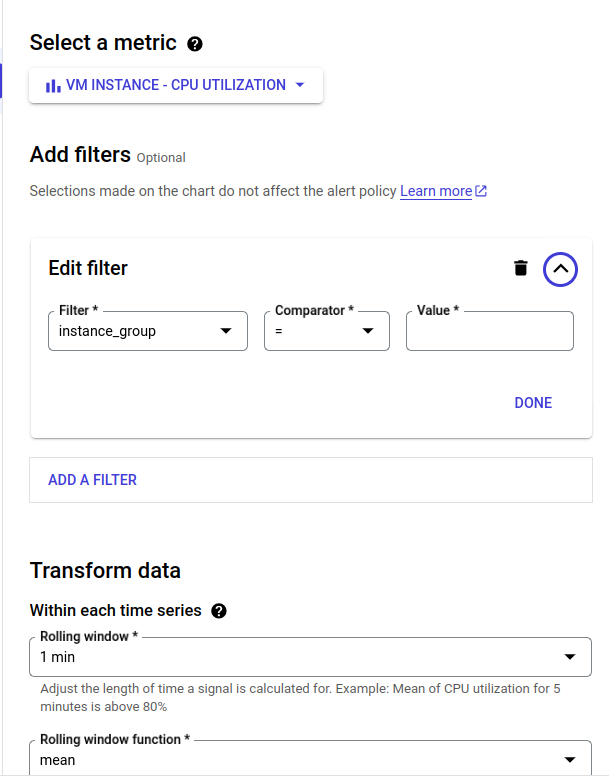
STEP-5 Add a filter for the particular proxy you want to monitor as follows:
- Click Add Filter
- Click in the Filter field and select instance_group from the drop-down menu.
- In the Comparator, select =.
- In the Value field, type instance_group
- Click Done.
You can use any filter you have in the filtering list to add filter for monitoring as:
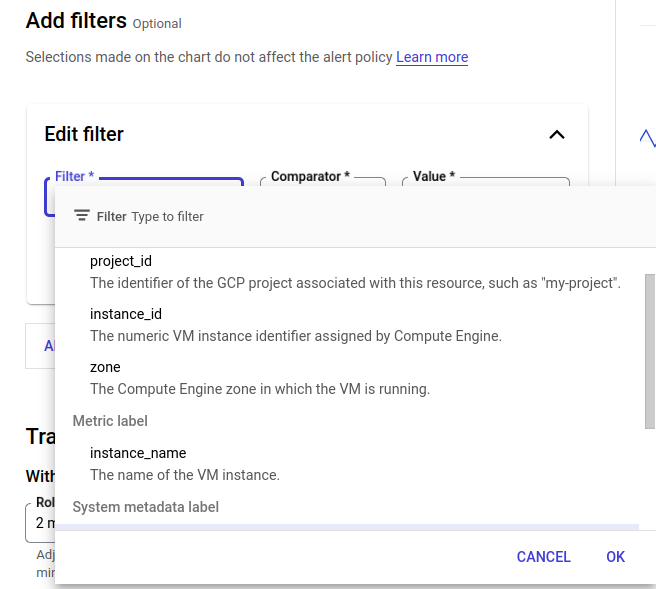
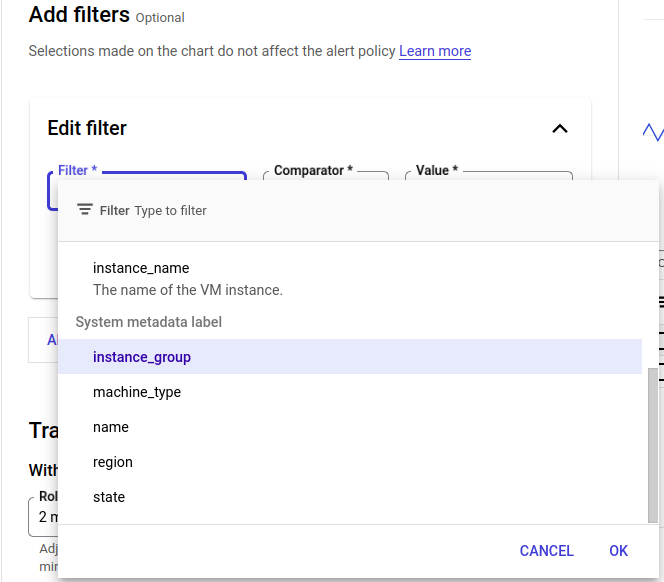
Above image shows you the filter list.
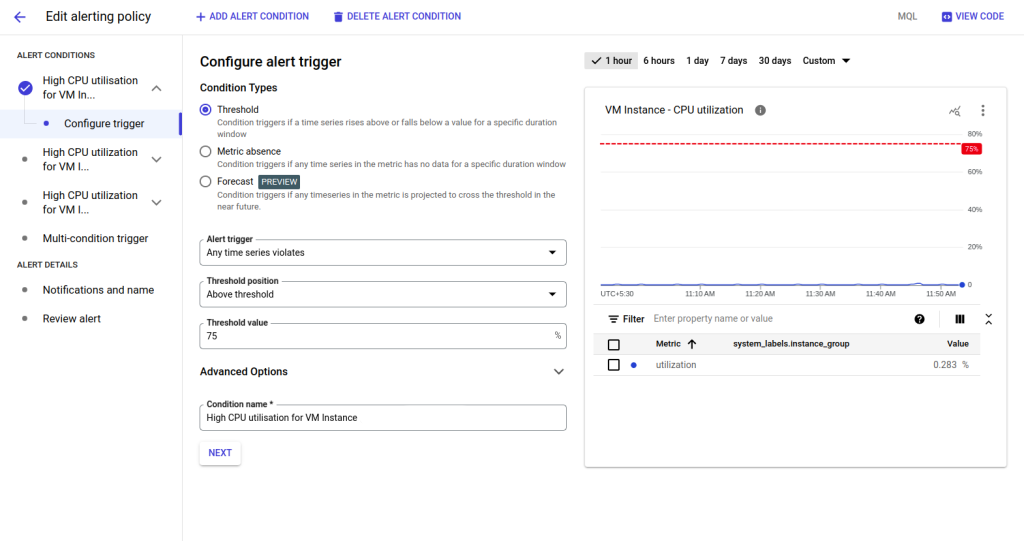
- After clicking on Next, you have to choose the data for Configure Alert Trigger as below:
Configure the alert trigger
To configure the event that triggers the alert, first click Configure trigger in the left-hand pane. Then do the following steps:
- Under Condition type, select Threshold.
- In the Alert trigger field, select Any time series violates.
- In the Threshold position field, select Above threshold.
- In the Threshold Value field set value as 75.
- In the Condition Name field, enter High CPU utilisation for VM Instance (name_of_vm)
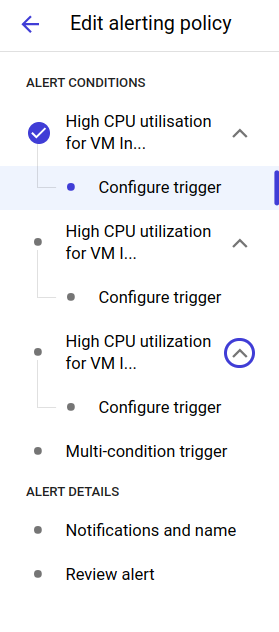
- Add multi condition alert trigger for all the VMs inside your Org as Below:
With these settings, an alert will be triggered whenever a memory used metric is absent for over 5 mins.
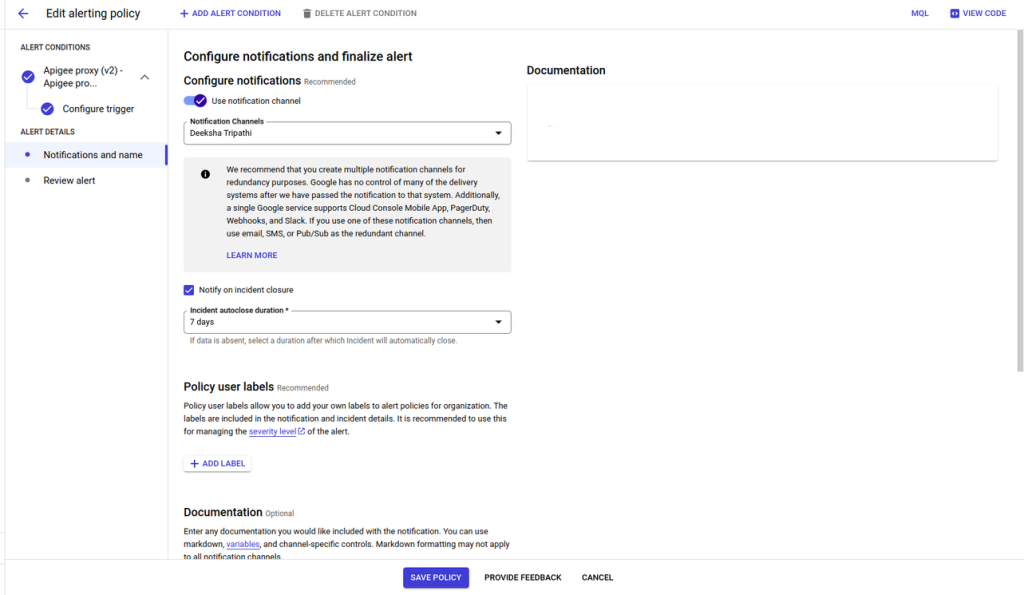
- Click Next to open the Configure notifications and finalise alert pane.
Set up a notification for the Alert!
- Click in the Notification Channels field. If you have already created a channel for the notification, such as an email address or SMS number, you can select it under Notification Channels. Otherwise, you need to add a channel by selecting Manage Notification Channels. This opens the Notification channels pane, where you can add one or more channels. See Manage notification channels for more information.
- To add notification channel Click on Manage Notification Channels as shown below :
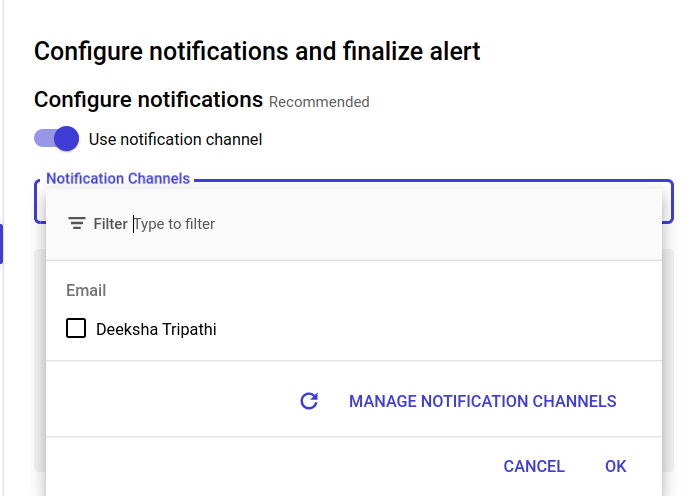
- Again when you click on Next a page will appear like this:
- Once you have selected one or more notification channels, click OK.
- In the Documentation field, you can add a message that will be sent with the notification.
- Click Next to review the details of the alert. If you are satisfied with them, click Create Policy to create the alerting policy.
- As created Multi trigger Alerting Policy so I have added all three VM instances in one as below:
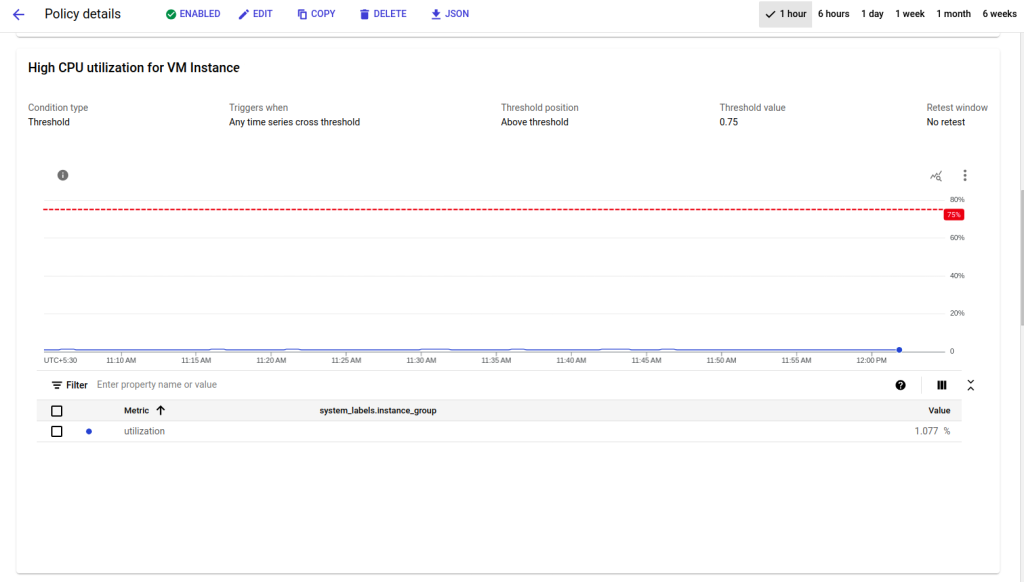
In the above image you can see your alert policy is created but it will only trigger an alert when incident is open.
- Now to Add the notification channel click on MANAGE NOTIFICATION CHANNELS as shown.
- A page will appear like the below image:
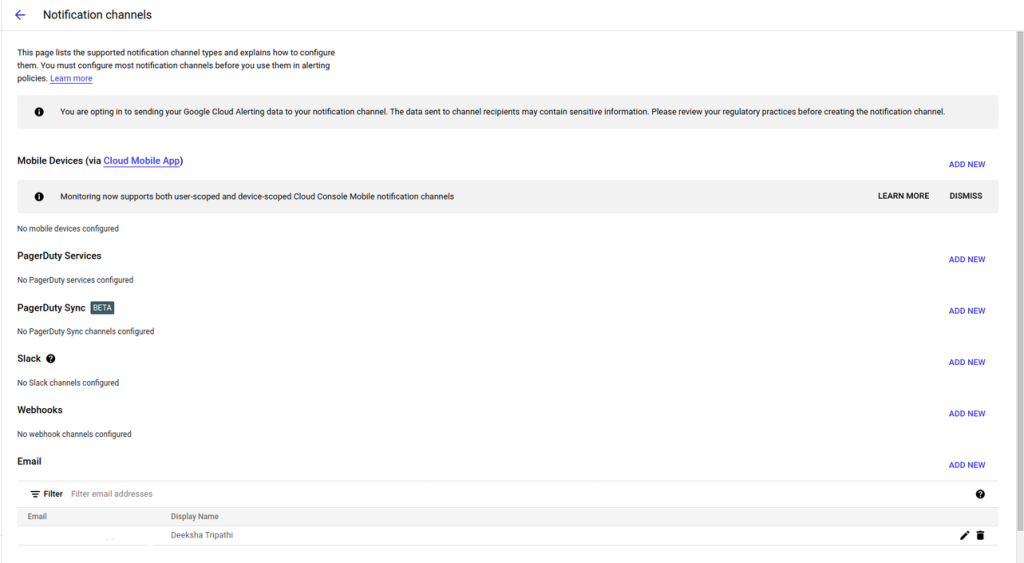
- Click on ADD NEW to add the notification Channel like I have added for Email Notification below:
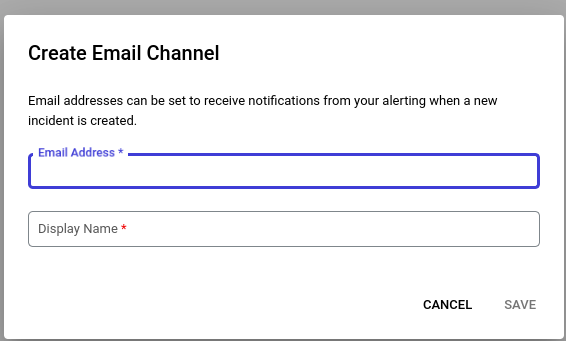
when you click on ADD NEW a box will open like above and in that you have to give the Email Address and Display Name for your notification channel. Once you will click SAVE notification channel will be added like this:
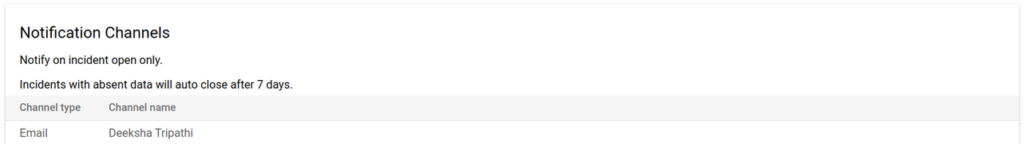
Below is the image shows you the Notification Channel type and the Channel Display Name.

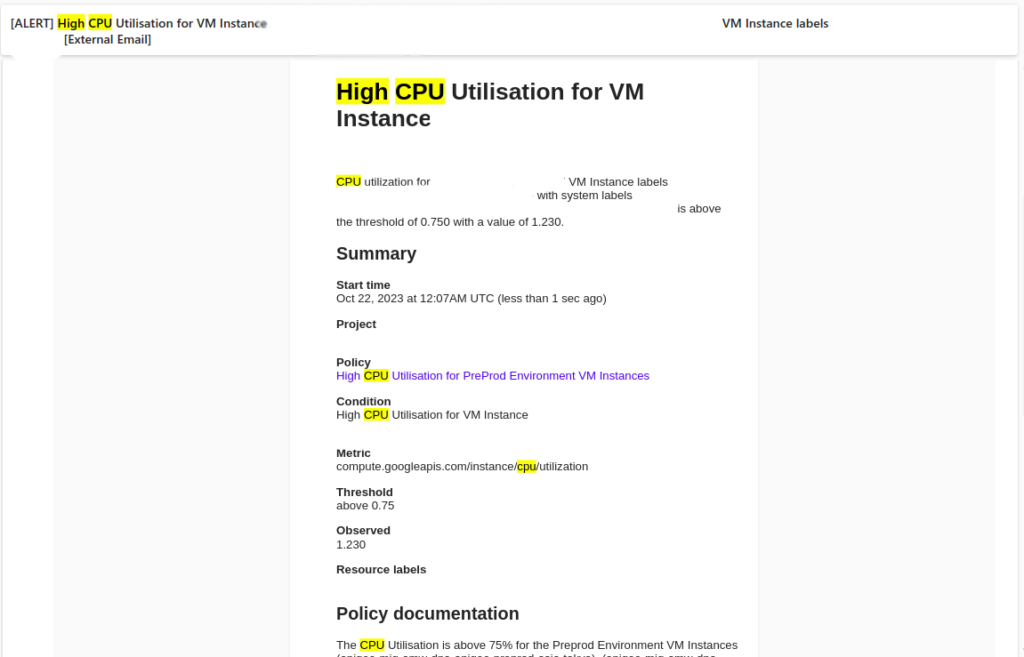
- Once the alert is created and when it met with the condition. You will receive an email like below:
CONCLUSION
Implementing this alerting policy for High CPU Utilisation-Instance Down alerts in Apigee in your Apigee environment enhances your ability to proactively address performance issues, minimising downtime and ensuring optimal system health. Regularly review the alerts dashboard, investigate the alerting policy, and address any underlying problems to ensure optimal operation of the Apigee infrastructure.