


Integrating OpenTelemetry with Jaeger and Prometheus can provide a robust observability solution for .NET Core applications. OpenTelemetry standardizes the collection of telemetry data, Jaeger focuses on distributed tracing, and Prometheus excels at metrics collection and alerting. This guide will walk you through the integration process using .NET Core.
Introduction
This guide will show you how to integrate OpenTelemetry with Jaeger and Prometheus in a .NET Core application. By following these steps, you can achieve comprehensive observability for your applications.
What is OpenTelemetry?
OpenTelemetry is an open-source observability framework that provides a unified approach to collecting, processing, and exporting telemetry data (metrics, logs, and traces) from software applications.
What is Jaeger?
Jaeger is an open-source tool for tracing transactions between distributed services. It helps in monitoring and troubleshooting microservices-based applications by providing detailed insights into request flows.
What is Prometheus?
Prometheus is an open-source monitoring and alerting toolkit designed for reliability and scalability. It collects and stores metrics as time-series data, allowing for powerful querying and alerting.
Why Integrate OpenTelemetry with Jaeger and Prometheus?
Integrating these tools provides a comprehensive observability solution. OpenTelemetry collects the data, Jaeger visualizes and analyzes traces, and Prometheus handles metrics collection, storage, and alerting. This integration helps in understanding the application’s performance and identifying issues quickly.
Prerequisites
- Basic understanding of observability concepts.
- Docker installed (for running Jaeger and Prometheus).
- A .NET Core application for instrumentation.
Setting Up OpenTelemetry in .NET Core
Installing OpenTelemetry SDK
Add the necessary OpenTelemetry packages to your .NET Core project. You can do this via the NuGet Package Manager or by editing your
.csproj
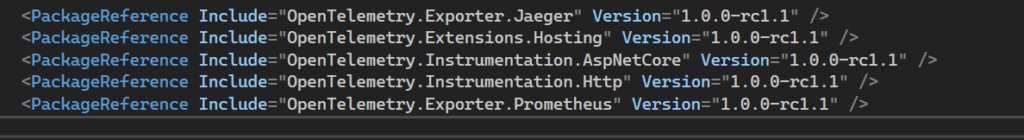
Configuring OpenTelemetry
Configure OpenTelemetry in your Startup.cs
public void ConfigureServices(IServiceCollection services)
{
    services.AddOpenTelemetryTracing(builder =>
    {
        builder
            .AddAspNetCoreInstrumentation()
            .AddHttpClientInstrumentation()
            .AddJaegerExporter(options =>
            {
                options.AgentHost = "localhost";
                options.AgentPort = 6831;
            });
    });

    services.AddOpenTelemetryMetrics(builder =>
    {
        builder.AddPrometheusExporter();
    });

    services.AddControllers();
}

public void Configure(IApplicationBuilder app, IWebHostEnvironment env)
{
    app.UseRouting();

    app.UseOpenTelemetryPrometheusScrapingEndpoint();

    app.UseEndpoints(endpoints =>
    {
        endpoints.MapControllers();
    });
}
Integrating OpenTelemetry with Jaeger
Setting Up Jaeger
Run Jaeger using Docker:
docker run -d --name jaeger
  -p 5775:5775/udp
  -p 6831:6831/udp
  -p 6832:6832/udp
  -p 5778:5778
  -p 16686:16686
  -p 14268:14268
  -p 14250:14250
  -p 9411:9411
  jaegertracing/all-in-one:1.22
Configuring OpenTelemetry Tracing with Jaeger
The configuration for Jaeger tracing was already added in the ConfigureServices method of your Startup.cs
Integrating OpenTelemetry with Prometheus
Setting Up Prometheus
Run Prometheus using Docker:
docker run -d --name prometheus -p 9090:9090 prom/prometheusAdd a scrape configuration for your application in Prometheus. Create or update prometheus.yml with the following content:
scrape_configs:
  - job_name: 'dotnet_app'
    scrape_interval: 5s
    static_configs:
      - targets: ['host.docker.internal:9184']
Configuring OpenTelemetry Metrics with Prometheus
The configuration for Prometheus metrics was already added in the ConfigureServices method of your Startup.cs
Instrumenting Your .NET Core Application
Adding Tracing
Instrument your application code to create spans:
public class WeatherForecastController : ControllerBase
{
    private readonly ILogger<WeatherForecastController> _logger;
    private readonly Tracer _tracer;

    public WeatherForecastController(ILogger<WeatherForecastController> logger, Tracer tracer)
    {
        _logger = logger;
        _tracer = tracer;
    }

    [HttpGet]
    public IEnumerable<WeatherForecast> Get()
    {
        using var span = _tracer.StartActiveSpan("Getting weather forecast");
        _logger.LogInformation("Started span for Get operation");


        span.AddEvent("Weather forecast retrieved");
        return forecasts;
    }
}
Adding Metrics
Instrument your application code to collect metrics:
ublic class WeatherForecastController : ControllerBase
{
    private readonly ILogger<WeatherForecastController> _logger;
    private readonly Meter _meter;
    private Counter<int> _requestCounter;

    public WeatherForecastController(ILogger<WeatherForecastController> logger, Meter meter)
    {
        _logger = logger;
        _meter = meter;
        _requestCounter = _meter.CreateCounter<int>("weather_forecast_requests", "Counts the number of weather forecast requests");
    }

    [HttpGet]
    public IEnumerable<WeatherForecast> Get()
    {
        _requestCounter.Add(1, new KeyValuePair<string, object>("endpoint", "Get"));


        return forecasts;
    }
}
Verifying the Integration
Checking Jaeger for Traces
Access the Jaeger UI at http://localhost:16686 and verify that traces are being collected and displayed.
Checking Prometheus for Metrics
Access the Prometheus UI at http://localhost:9090 and verify that metrics are being collected and displayed.
Conclusion
Integrating OpenTelemetry with Jaeger and Prometheus provides a powerful observability stack that can give you deep insights into your application’s performance and behavior. By following the steps outlined in this guide, you can set up and configure these tools to work together seamlessly, allowing you to monitor, trace, and analyze your application with ease.