


In today’s fast-paced world of software development, ensuring that your APIs perform optimally is crucial for delivering a seamless user experience. However, with constantly evolving codebases and changing user demands, monitoring API performance in real-time becomes a necessity rather than a luxury. This is where tools like Postman and Newman come to the rescue, offering a streamlined way to continuously monitor API performance. In this blog, we’ll delve into the process of setting up continuous monitoring of API performance using Postman collections and Newman, accompanied by practical code examples that you can run on your machine.
Why Postman and Newman? Leveraging Postman and Newman for Continuous API Performance Monitoring
Postman is a popular API development tool that allows you to design, test, and debug APIs effortlessly. It provides a user-friendly interface for creating collections of API requests along with features for scripting, environment management, and collaboration.
Newman, on the other hand, is a command-line collection runner for Postman. It enables you to run and test Postman collections directly from the command line or integrate them into your CI/CD pipelines for automated testing.
Combining the power of Postman for creating collections and Newman for running them in a continuous integration environment, we can achieve robust API performance monitoring effortlessly.
Setting Up Continuous Monitoring & Automated Performance Tests in Postman
Let’s dive into the step-by-step process of setting up continuous monitoring of API performance using Postman and Newman.
Step 1: Install Postman and Newman
If you haven’t already installed Postman and Newman, you can do so by following the instructions on their respective websites or you can use web-based tools for testing.
- Download Postman – https://www.postman.com/.
- Install Newman using node cli – Sudo npm install -g newman
Step 2: Create a Postman Collection
First, we’ll create a Postman collection containing the API requests we want to monitor. For demonstration purposes, let’s consider a simple collection that tests the performance of a weather API: you can give URL directly in postman.
https://api.weatherapi.com/v1/forecast.json?key=https://api.weatherapi.com/v1/forecast.json?
key=PUT_YOUR_API_KEY&q=New%20York&days=1&q=New%20York&days=1
- Create Weather Api key as below:
https://www.weatherapi.com/my/
Step 3: Run the Collection in Postman
Before automating the process, let’s ensure that the collection runs successfully with test cases in Postman. Open Postman, import the collection, click on generate test and run it to verify that the API requests execute without errors.
Click on Run Collection

Step 4: Export the Collection
Once you’ve confirmed that the collection runs smoothly, export it as a JSON file. This file will be used by Newman to execute the requests from the command line.
Click on Export
Step 5: Run the Collection with Newman
Now, open your terminal and navigate to the directory where you exported the collection JSON file. Then, execute the following command:
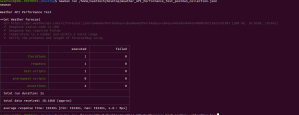
newman run /home/nashtech/Desktop/Weather_API_Performance_Test_postman_collection.json
Report generation command:
npx newman run /home/nashtech/NewmanExports/APIPerformanceTest.json -r htmlextra
We will see the result as below:
Step 6: Automate the Process – Analyzing API Performance Metrics with Newman Reports
To automate the continuous monitoring process, you can integrate Newman into your CI/CD pipelines. For instance, if you’re using Jenkins, you can create a Jenkins job that runs the Newman command as a build step triggered by a schedule or after each code deployment.
-
Choose a CI/CD Tool :
Select a CI/CD tool that you’re using or planning to use for your project. Popular choices include Jenkins, Travis CI, CircleCI, GitLab CI/CD, and GitHub Actions. For the sake of this explanation, let’s consider Jenkins.
-
Set Up Jenkins Job:
Log in to your Jenkins instance and create a new job to automate the API performance monitoring process. Navigate to Jenkins dashboard and click on “New Item” to create a new job.
-
Configure Job Details:
Enter a name for your job (e.g., “API Performance Monitoring”) and choose the appropriate job type (e.g., Freestyle project).
-
Configure Source Control:
If your API tests are stored in a version control system (e.g., GitHub), configure the job to pull the test scripts from the repository. You can specify the repository URL, branch, and credentials if required.
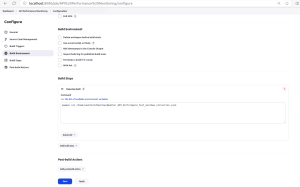
- Add Build Step:
In the configuration of your Jenkins job, add a build step to execute the Newman command. This can typically be done in the “Build” section of the job configuration. -
Specify Newman Command:
In the build step, specify the Newman command to run your Postman collection. For example:Replace path with the actual path to your Postman collection JSON file.
newman run /path/to/your/collection.json -
Save Configuration:
Once you’ve configured the job settings and added the Newman build step, save the job configuration.
-
Trigger the Job:
You can trigger the job manually to test if everything is set up correctly. Alternatively, you can configure triggers such as periodic builds, webhook triggers, or triggers based on repository changes.
-
View Results:
After the job is triggered, Jenkins will execute the Newman command and run the API tests defined in your Postman collection. You can view the results of the test execution directly within the Jenkins interface.
-
Configure Notifications (Optional):
Optionally, configure email notifications or other types of notifications to be sent out based on the test results. This helps in keeping the team informed about the API performance status.

Step 7: Creation of K6 Script to run Jenkin jobs using CLI.
Please refer below script format to run Jenkin job using k6 script.
import http from 'k6/http';
import { check } from 'k6';
import encoding from 'k6/encoding';

export default function () {
var username = 'username'; // Your Jenkins username
var apiToken = 'token'; // Your Jenkins API token
var auth = username + ':' + apiToken;
var params = {
headers: {
"Authorization": "Basic " + encoding.b64encode(auth),
},
};

var url = 'http://localhost:8080/job/API_Performance_Monitoring/build?token=authvishuapijob'; // Update this URL with your Jenkins job URL

let res = http.post(url, null, params);

check(res, { 'status was 201': (r) => r.status === 201 });
}
Command to run K6 file.
k6 run k6_commands.js
Output

Report:

Conclusion
Continuous monitoring of API performance is essential for maintaining the reliability and efficiency of your applications. With tools like Postman and Newman, you can automate this process seamlessly, ensuring that your APIs consistently meet performance expectations. By following the steps outlined in this blog and incorporating them into your development workflow, you can stay ahead of potential performance issues and deliver a superior user experience.
Now, armed with this knowledge, go ahead and empower your team with efficient API performance monitoring using Postman and Newman!