


One day, your dashboard shows this:
- CPU: 40%
- Memory: Stable
- Error rate: 0%
- Requests per second: High and healthy
But Slack is exploding.
“The system is slow.”
How can that be?
The system is processing thousands of requests per second.
Throughput looks great.
But users are waiting.
That’s when you realize:
High throughput does not mean low latency.
And if you don’t understand the difference, your architecture decisions will hurt you later.
First, What Do These Words Actually Mean?
Throughput
Throughput is:
How much work your system can handle per unit of time.
Examples:
- 5,000 requests per second
- 200 MB/s data processing
- 10,000 messages per minute
Think of throughput as:
Capacity.
Latency
Latency is:
How long one request takes from start to finish.
Examples:
- 20 ms API response time
- 200 ms database query
- 2 seconds page load
Think of latency as:
Waiting time.
Simple analogy: Highway vs Travel Time
Imagine a highway.
- Throughput = how many cars pass per hour.
- Latency = how long one car takes to reach destination.
You can have:
- A highway moving 10,000 cars/hour
- But each car takes 2 hours to reach its destination
That’s high throughput, high latency.
Or:
- A small road moving 500 cars/hour
- But each car reaches in 5 minutes
Low throughput, low latency.
They measure different things.
Why Observability Must Track Both
If you only monitor throughput:
- You might think your system is healthy.
- But users may still feel it’s slow.
If you only monitor latency:
- You might optimize response time.
- But your system may collapse under load.
True observability requires both.
The Throughput–Latency Relationship
There is a hidden relationship between them.
When load increases:
- Throughput increases (to a point)
- Latency eventually increases dramatically
This is queueing theory in action.
What happens under load?
Imagine your service can handle:
- 1,000 requests per second comfortably.
At 800 rps:
- Latency = 20 ms
At 950 rps:
- Latency = 40 ms
At 1,000 rps:
- Latency = 100 ms
At 1,100 rps:
- Latency = 2 seconds
- Timeouts begin
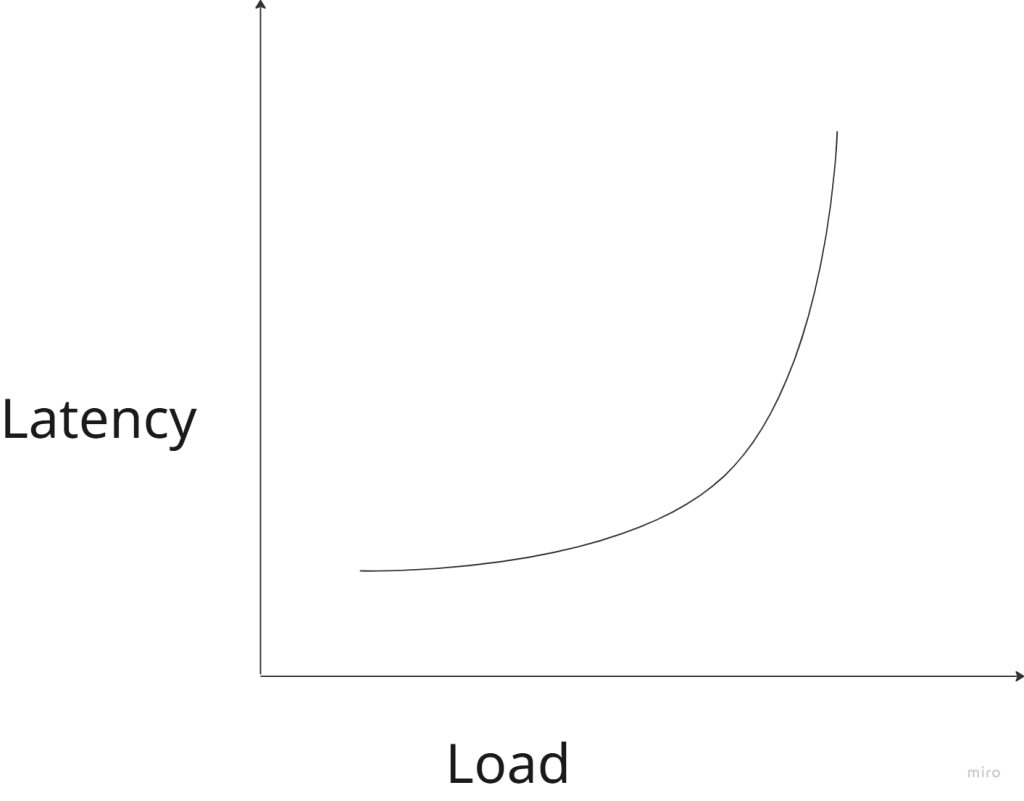
Latency rises slowly… then explodes.
This is why systems feel “fine” until suddenly they don’t.
Why This Matters in Microservices
In microservice architecture:
API → Service A → Service B → DatabaseIf each service has:
- 50 ms latency
Total user latency:
50 + 50 + 50 = 150 msNow add:
- Network overhead
- TLS handshake
- Retry
Suddenly:
250–400 msEven if throughput is high.
Latency compounds across services.
When Do You Optimize for Low Latency?
You choose low latency when:
1. User experience is critical
Examples:
- Search results
- Autocomplete
- Trading platforms
- Gaming
- Real-time dashboards
In these systems:
- 100 ms feels instant
- 300 ms feels slow
- 1 second feels broken
Users care about responsiveness.
2. Services are chained
If your architecture has many hops:
Client → API → Auth → Profile → Order → PaymentSmall latencies add up.
Low latency per service prevents explosion at the edge.
3. Synchronous systems
If the caller is waiting:
- Mobile app
- Browser
- Frontend
You care about latency.
When Do You Optimize for High Throughput?
Throughput matters more when:
1. Batch processing systems
Examples:
- Data pipelines
- Log processing
- ETL jobs
- Machine learning training
Users don’t wait per request.
They care about:
Total work completed over time.
2. Streaming systems
Examples:
- Kafka consumers
- Event processors
- Metrics ingestion
Goal:
- Handle massive volume
- Without crashing
Latency per message may not matter as much.
3. Background jobs
Examples:
- Email sending
- Image resizing
- Report generation
As long as it finishes eventually, latency is less critical.
Why You Can’t Maximize Both Easily
There is often a trade-off.
High Throughput Systems
They usually:
- Use batching
- Queue requests
- Maximize CPU utilization
- Run near capacity
But:
- Queuing increases latency
Low Latency Systems
They often:
- Keep spare capacity
- Avoid deep queues
- Prefer fast fail over retry
- Use in-memory caching
But:
- May waste resources
- Lower maximum throughput
Observability: What Should You Measure?
At minimum:
For Latency
- p50 (median)
- p95
- p99
Average latency is misleading.
If:
- p50 = 20 ms
- p99 = 2 seconds
Users will complain.
For Throughput
- Requests per second
- Messages per second
- Transactions per second
Track per service, not just globally.
For System Health
- Queue length
- CPU utilization
- Thread pool usage
- Connection pool saturation
- Retry rate
Often latency spikes before CPU hits 100%.
A Dangerous Pattern in Microservices
Many teams optimize for:
“Handle more traffic.”
They scale horizontally:
- More pods
- More containers
Throughput increases.
But they ignore:
- Tail latency (p99)
- Retry amplification
- Network overhead
Then during peak load:
- Latency spikes
- Retries increase traffic
- Congestion worsens
- System collapses
Throughput obsession can kill latency.
A Simple Mental Model
Ask this question:
Is my system user-facing or work-facing?
If it is:
- User-facing → prioritize latency
- Work-facing → prioritize throughput
Better:
- Design separate paths
Example:
- API layer optimized for low latency
- Background processing optimized for high throughput
Architecture Patterns That Help
1. Caching
Reduces latency dramatically.
Without cache:App → DB → 50 msWith cache:App → Memory → 2 ms2. Asynchronous processing
Move non-critical work out of request path.
Instead of:
User request → process everythingDo:
User request → enqueue job → respond quickly3. Backpressure
Prevent overload.
If system is full:
- Reject early
- Don’t queue infinitely
Better to fail fast than die slowly.
The Real Goal: Predictable Performance
Users don’t need:
- The absolute fastest system.
They need:
Consistent, predictable performance.
A system with:
- 100 ms stable latency
Feels better than:
- 20 ms most of the time
- 2 seconds sometimes
That’s why:
- Tail latency (p99) matters more than average.
Final Takeaway
Throughput answers:
How much can we handle?
Latency answers:
How long must someone wait?
In distributed systems:
- Network calls are expensive
- Queues amplify delays
- Retries increase load
- Latency compounds
Good architecture is not about maximizing one metric.
It’s about choosing the right priority for your system.