


As businesses grow and their infrastructures become more complex, monitoring becomes a critical component of maintaining system health and performance. Telegraf, an open-source server agent for collecting and sending metrics and events from databases, systems, and IoT sensors, is widely used for this purpose. However, handling high volumes of metrics can strain resources and degrade performance. This blog will explore strategies for optimizing Telegraf’s performance when dealing with high-volume metrics.
Understanding Telegraf and Its Architecture
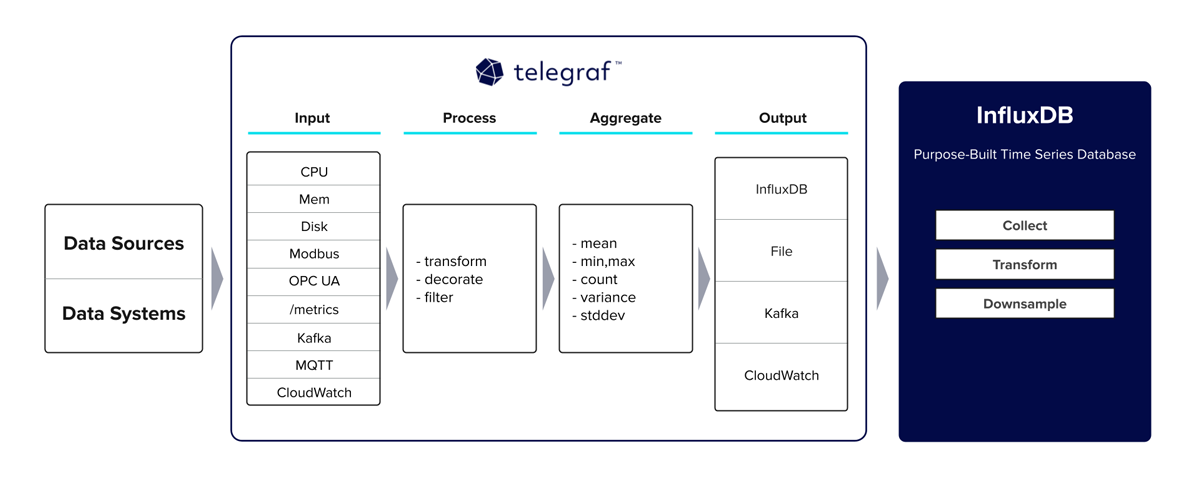
Telegraf is designed to collect, process, and write metrics efficiently. It is part of the TICK stack (Telegraf, InfluxDB, Chronograf, Kapacitor) but can be used independently with various output plugins like Graphite, Prometheus, and others.
Key Components
- Input Plugins: Collect metrics from various sources (e.g., system metrics, application logs).
- Processors: Apply transformations to the collected data.
- Aggregators: Combine multiple data points into fewer, more meaningful metrics.
- Output Plugins: Send the collected and processed metrics to storage systems or other services.
Given this architecture, optimizing Telegraf for high-volume metrics involves tuning each of these components to handle large data volumes efficiently.
1. Optimize Input Plugins
Reduce Unnecessary Metrics
Collect only the metrics you need. Unnecessary metrics not only consume resources but also make it harder to analyze the data. Carefully review and select the metrics that provide the most value for your monitoring needs.
[[inputs.cpu]]
  percpu = false
  totalcpu = true
  fielddrop = ["time_*"]
In the above example, we collect only total CPU metrics and drop fields with a prefix time_ to reduce data volume.
Use Efficient Polling Intervals
Set polling intervals based on the criticality of the metrics. Not all metrics need to be collected at the same frequency.
[[inputs.cpu]]
  interval = "10s"
[[inputs.disk]]
  interval = "30s"
Here, CPU metrics are collected every 10 seconds, while disk metrics are collected every 30 seconds, reducing the load on the system.
2. Optimize Processors and Aggregators
Use Aggregators to Reduce Data Volume
Aggregators can combine multiple data points into fewer, more meaningful metrics, reducing the overall data volume.
[[aggregators.basicstats]]
  period = "30s"
  drop_original = true
  stats = ["mean", "max", "min"]
In this example, we aggregate data over 30-second periods, calculating mean, max, and min values, and dropping the original high-frequency data points.
Filter and Transform Data
Use processors to filter out unnecessary fields and tags, and transform data into a more useful format.
[[processors.regex]]
  order = 1
  [[processors.regex.tags]]
    key = "host"
    pattern = "^(.*)$"
    replacement = "${1}.example.com"
    result_key = "host"
This configuration transforms the host tag by appending .example.com, standardizing the hostnames in your metrics.
3. Optimize Output Plugins
Batch and Buffer Data
Configure batching and buffering to reduce the frequency of writes and handle transient spikes in data volume.
[[outputs.influxdb]]
  urls = ["http://localhost:8086"]
  database = "telegraf"
  retention_policy = ""
  write_consistency = "any"
  timeout = "10s"
  udp_payload = "512B"
  precision = "s"
  [outputs.influxdb.tagpass]
    environment = ["production"]

  [outputs.influxdb.buffer]
    max_buffer_size = 5000
    max_buffer_interval = "10s"
This configuration sets a maximum buffer size and interval, ensuring data is written in batches to optimize performance.
Use Efficient Output Formats
Choose output formats that are efficient for your storage backend. For instance, using JSON might be less efficient than a binary format for high-volume data.
[[outputs.prometheus_client]]
  listen = ":9273"
  metric_version = 2
Using the latest version of the Prometheus metric format can improve efficiency.
4. Optimize Telegraf’s Performance Settings
Increase Parallelism
Increase the number of parallel collectors to handle more metrics concurrently.
[agent]
  interval = "10s"
  round_interval = true
  metric_batch_size = 1000
  metric_buffer_limit = 10000
  collection_jitter = "0s"
  flush_interval = "10s"
  flush_jitter = "0s"
  precision = ""
  debug = false
  quiet = false
  logfile = "/var/log/telegraf/telegraf.log"
  hostname = ""
  omit_hostname = false
  collection_parallelism = 4
By setting collection_parallelism to 4, we enable Telegraf to collect metrics from 4 inputs in parallel.
Optimize Resource Usage
Ensure Telegraf has enough CPU and memory resources to handle the data volume. Monitor Telegraf’s resource usage and adjust the resource limits as necessary.
[agent]
  interval = "10s"
  metric_batch_size = 1000
  metric_buffer_limit = 5000
Adjusting metric_batch_size and metric_buffer_limit helps manage memory usage and performance under high load.
5. Monitor and Tune
Regularly Monitor Performance
Use monitoring tools to track Telegraf’s performance and resource usage. Look for bottlenecks and tune configurations as necessary.
Profile and Debug
Use Telegraf’s built-in profiling and debugging tools to identify and troubleshoot performance issues.
telegraf --pprof-addr :6060Access the profiling data via HTTP to analyze Telegraf’s performance in real-time.
Conclusion
Optimizing Telegraf for high-volume metrics involves a combination of careful configuration and regular monitoring. By reducing unnecessary metrics, optimizing polling intervals, leveraging aggregators, configuring batching and buffering, increasing parallelism, and monitoring resource usage, you can ensure Telegraf performs efficiently under high load. Regularly revisiting and tuning these configurations based on your infrastructure’s evolving needs will help maintain optimal performance.
Implementing these best practices will allow you to handle high-volume metrics effectively, ensuring your monitoring infrastructure remains robust and responsive.
I hope this gave you some useful insights. Please feel free to drop any comments, questions or suggestions. Thank You !!!