


This blog offers insights into optimizing test analysis using Report Portal strategies, providing valuable guidance for understanding and improving software testing effectiveness.
In the rapidly evolving realm of software development, guaranteeing the quality of products stands as a top priority. It’s essential to analyse test results meticulously to identify issues and enhance testing practices further. Report Portal serves as a valuable tool in this regard, facilitating the collection, analysis, and comprehension of test results. Throughout this post, we’ll delve into strategies for optimizing test analysis with Report Portal, equipping readers with the knowledge to enhance their testing processes effectively.
Strategies for Optimal Effectiveness:
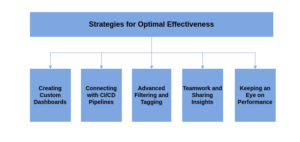
1. Creating Custom Dashboards:
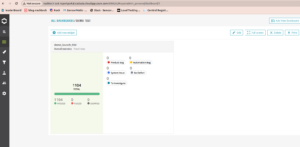
Report Portal gives teams the power to design their own dashboards, which are like personalized screens showing important information about how tests are going. By choosing what widgets and graphs to include, teams can see important numbers like how many tests pass.
if there are any patterns in failures, how long tests take to run, and how much of the code is being tested. These customized dashboards help everyone involved in testing understand what’s happening and decide if the software is ready to be released.
- Example: A testing team can create a customized dashboard in Report Portal with widgets displaying key metrics such as:
- Test pass rate over time.
- Distribution of test failures by severity.
- Average test execution time per test suite.
- By visualizing these metrics on the dashboard, the team can quickly identify trends, anomalies. And areas for improvement in their testing process.
2. Connecting with CI/CD Pipelines:
It’s really important for testing tools like Report Portal to work smoothly with Continuous Integration and Continuous Deployment (CI/CD) pipelines. This means that when tests run as part of the development process, the results are automatically sent to Report Portal. By linking Report Portal with CI/CD workflows, teams can be sure that they’re always collecting and looking at test data as the software moves through different stages of development. This helps catch problems early and gives quick feedback, so issues can be fixed fast, making the software better.
- Example: The testing team configures their CI/CD pipeline to automatically trigger test execution upon code commits. Test results are then seamlessly reported to Report Portal using integration plugins or APIs.
- As a result, every code change undergoes rigorous testing. And the corresponding test results are immediately available in Report Portal for analysis.
3. Advanced Filtering and Tagging:
Teams can use advanced filters and tags in Report Portal to organize test results based on various factors like pass/fail status, testing environment. This allows them to focus on specific groups of tests such as failed tests, quick smoke tests, or those related to critical features. By analysing data in this focused manner, teams can quickly identify trends and determine the root causes of issues.
- Example: The testing team uses Report Portal’s filtering and tagging capabilities to focus their analysis on specific subsets of test results, such as:
- Failed tests related to a critical feature.
- Performance tests run on a specific environment.
- By applying filters and tags, the team can isolate relevant test data and gain deeper insights into the root causes of issues, leading to more targeted and effective problem resolution.
4. Teamwork and Sharing Insights:
Making sense of test results involves everyone on the team: developers, testers, product managers, and others. Report Portal helps this collaboration by letting people add notes to test results, leave comments, and share what they’ve learned right away. By working together and sharing what they know, teams can use everyone’s skills to solve problems, make testing better, and keep getting better at what they do.
- Example: During a test execution analysis session, team members collaborate in real-time using Report Portal’s commenting and annotation features.
- A developer identifies a recurring failure and adds a comment with insights on potential code changes to address the issue.
- A tester annotates a failed test case with additional information about the test environment and steps to reproduce the failure.
- By sharing insights and collaborating within Report Portal, team members can leverage collective expertise to resolve issues quickly and improve testing practices collaboratively.
5. Keeping an Eye on Performance:
Besides looking at each test result, Report Portal helps teams watch how things change over time. They can keep track of important numbers like how long tests take, how often they fail, and how stable they are. By looking at these trends, teams can spot patterns that show where things might need fixing or more checking. This kind of analysis helps teams stay on top of performance, make tests run better, and make sure their testing is reliable.
- Example: The team tracks performance metrics such as test execution times and failure rates over multiple test runs using Report Portal’s trend analysis features.
- They observe a gradual increase in test execution times over several weeks, indicating a potential performance degradation.
- By drilling down into the data, they identify a bottleneck in the test infrastructure and take proactive measures to optimize resource allocation and improve overall test performance.
- Through continuous performance monitoring and trend analysis, the team ensures the reliability and efficiency of their testing process, ultimately leading to faster feedback and higher-quality releases.
Below is an example of integrating Report Portal with a Java test framework, specifically TestNG. This code demonstrates how to start and finish test items in Report Portal, allowing for effective test execution analysis.
import com.epam.reportportal.service.ReportPortal;
import com.epam.reportportal.testng.ReportPortalTestNGListener;
import org.testng.annotations.AfterMethod;
import org.testng.annotations.BeforeMethod;
import org.testng.annotations.Listeners;
import org.testng.annotations.Test;@Listeners({ReportPortalTestNGListener.class})
public class ExampleTest {private ReportPortal reportPortal;
@BeforeMethod
public void setUp() {
// Initialize Report Portal instance
reportPortal = ReportPortal.builder()
.withEndpoint(“End point”)
.withProjectName(“your-project”)
.withApiKey(“your-api-key”)
.build();
}@AfterMethod
public void tearDown() {
// Close Report Portal client
reportPortal.finishLaunch();
}@Test
public void testExample() {
// Start test item
reportPortal.startTestItem(“testExample”, “Automated test”);// Finish test item with PASSED status
reportPortal.finishTestItem(“testExample”, “PASSED”);
}
}
Let’s break each part of the code:
- Imports: We import necessary classes from Report Portal and TestNG libraries.
- @Listeners: TestNG annotation that specifies the ReportPortalTestNGListener class to listen to test events.
- setUp() Method: This method is annotated with @BeforeMethod, indicating that it will run before each test method execution. Inside, we initialize the Report Portal instance with the desired endpoint, project name, and API key.
- tearDown() Method: Annotated with @AfterMethod, it runs after each test method execution. Here, we finish the Report Portal launch, ensuring proper cleanup.
- testExample() Method: An example test method annotated with @Test. Inside, we start a test item with a given name and description using reportPortal.startTestItem(), then execute the test logic. Finally, we finish the test item with a status of PASSED using reportPortal.finishTestItem().
Best Practices for Test Execution Analysis
1. Establishing Clear Goals and Objectives for Test Analysis
Before delving into test execution analysis with Report Portal, it’s vital for teams to set clear goals and objectives. Define what you want to accomplish through test analysis. Are you aiming to enhance test coverage, pinpoint regression trends, or streamline test execution times? Establishing clear goals will steer your analysis efforts and ensure that you concentrate on the most pertinent metrics and insights.
2. Standardizing Test Reporting Formats and Conventions
Consistency in test reporting is crucial. Therefore, by standardizing formats and conventions, everyone on the team can understand and interpret test results consistently. First and foremost, define a clear structure for test reports, including sections for test status, a summary of findings, and actionable insights. Additionally, utilize standardized naming conventions and terminology to prevent confusion and streamline communication within the team.
3. Conducting Post-mortem Analysis for Failed Tests
Failed tests are valuable learning opportunities. After a test fails, perform a post-mortem analysis to uncover the root cause and prevent similar issues in the future. Explore factors like test environment setups, data configurations, and application behaviour to find out why the test failed. Document your discoveries and share them with the team to promote knowledge sharing and avoid repeat problems.
4. Implementing Automated Alerts and Notifications for Critical Issues
For proactive issue management, think about adding automated alerts and notifications to Report Portal. Create alerts for particular thresholds or conditions, like a sudden spike in test failures or a significant drop in test coverage. Moreover, configure notifications to be sent via email, Slack, or other channels, ensuring that everyone is promptly informed about issues and can swiftly take action.
References
Conclusion
Effective test execution analysis is essential for maintaining high-quality software products. By leveraging Report Portal and adopting the strategies outlined in this post, teams can gain deeper insights into their testing efforts and drive continuous improvement across the software development lifecycle.