


A server has 32 occupied admission slots. Its queue is bounded. HTTP/2 flow control may be doing exactly what it should. Then one more original message arrives. What should the service do with it?
The admission limit can protect the server from accepting unlimited unfinished work. It cannot decide whether the next message should wait, receive a refusal, be tried again, or be deliberately discarded. That is an application contract, not a transport setting.
When capacity runs out, every overload policy moves a cost somewhere. It does not make that cost disappear. The engineering question is: where did the cost go, and is that an acceptable place for it?
Blog 1 investigated transport flow control and application backlog. Blog 2 explored fixed and adaptive admission budgets. Here we hold the admission boundary fixed and change what happens beyond it.
1. The queue is full. Now what?
Imagine an event that is useful only if processed before its deadline. It is already waiting in a client’s pending queue, or it is about to be sent. The server cannot accept another admitted piece of work right now.
A successful local Go Send does not establish that the remote application consumed or completed the event. Even a perfectly enforced admission limit does not establish that the original event finished on time. The service needs a rule for demand it cannot serve immediately.
The decision has two parts: which work the server may own, and what promise the system makes to work outside that boundary. The first is admission control. The second is overload policy.
The full-queue decision
| At the 32-slot boundary | What happens next? | Where does the cost go? |
|---|---|---|
| WAIT | Hold the request for a slot, subject to cancellation and deadlines. | Waiting time, upstream pending work, and consumed deadline. |
| REJECT | Return an explicit admission refusal. | Caller responsibility: handle refusal or abandon the original. |
| RETRY | Server rejects; client may try again within a finite original deadline and attempt budget. | Extra attempts, elapsed time, and client capacity. |
| DROP | Accountably discard work the application says is expendable. | Accepted loss of the original’s useful outcome. |
This is a conceptual decision map, not a measured chart. Costs can overlap: a retrying client may also wait, and rejecting still costs network and response work.
2. Four policies, four places to pay
WAIT – “I’ll hold your place, but you pay for waiting.” It favors giving already-offered work another chance. It sacrifices time and upstream capacity while the server remains full. In our implementation waiting is bounded and cancellable; WAIT does not promise lossless delivery.
REJECT – “I can’t accept this; you decide what happens next.” It favors a prompt, explicit refusal instead of silently accumulating server-owned work. The caller must choose whether the original is still worth pursuing. “Nonblocking” refers to the admission decision, not zero response latency.
RETRY – “Try again, but spend a finite budget.” This is client-side behavior after a server refusal, not a fourth independent server admission mechanism. A repeated attempt must retain the original’s identity and immutable deadline. It may recover useful work; it may also amplify load and displace other originals.
DROP – “This work is allowed to disappear.” It favors explicit loss when the application has declared the event expendable. In our protocol DROP returns a terminal per-message response and counts the discarded original. It is not successful processing or a transport-level no-ACK optimization.
There is no policy that manufactures worker capacity. The decision is which combination of waiting, caller responsibility, repeated work, and acceptable loss the service is prepared to own. Protocol and semantics · approved claims C01/C23.
3. A small experiment to make the trade-offs visible
We used a Go gRPC client and a Rust/tonic server with one serial worker and a 32-slot application admission limit. The client scheduled 80 original messages per second for 36 seconds–2,880 originals per run-while the worker slowed down and recovered. We compared WAIT, REJECT, RETRY, and DROP in five matched blocks under the primary workload.
Each original carried an immutable 2-second application deadline measured from its scheduled arrival, not from its first successful send or its latest retry. This was not a two-second gRPC stream deadline; the RPC had a separate, longer lifetime.
The main outcome is useful completion: an original completed by its own deadline, divided by all 2,880 scheduled originals, including originals that never reached a Send call. Counting only admitted work would hide a major part of overload.
The worker’s capacity did not change between policies. What changed was how demand encountered the admission boundary. Detailed phase timing, 16 KiB payloads, client bounds, counter definitions, validity checks, and limitations appear in the appendix. Primary evidence · Stage 5 report.
4. RETRY bought useful work – and sent the bill elsewhere
Compared with REJECT, RETRY completed about 41 more original messages on time per run while initiating about 91 more total attempts. That is the experiment’s most useful trade-off: more useful work, more effort, and a latency qualification.
RETRY versus REJECT – primary single-client, 2-second deadline
| Useful work gained | Additional attempts | Recovery-period latency |
|---|---|---|
| +40.6 on-time originals/run (+1.410 percentage points of all scheduled originals) | +91.2 initiated attempts/run | Higher completed-cohort p95 for RETRY in all five paired blocks |
Conceptual comparison of measured endpoints, not an efficiency ratio or a causal allocation of attempts to completions.
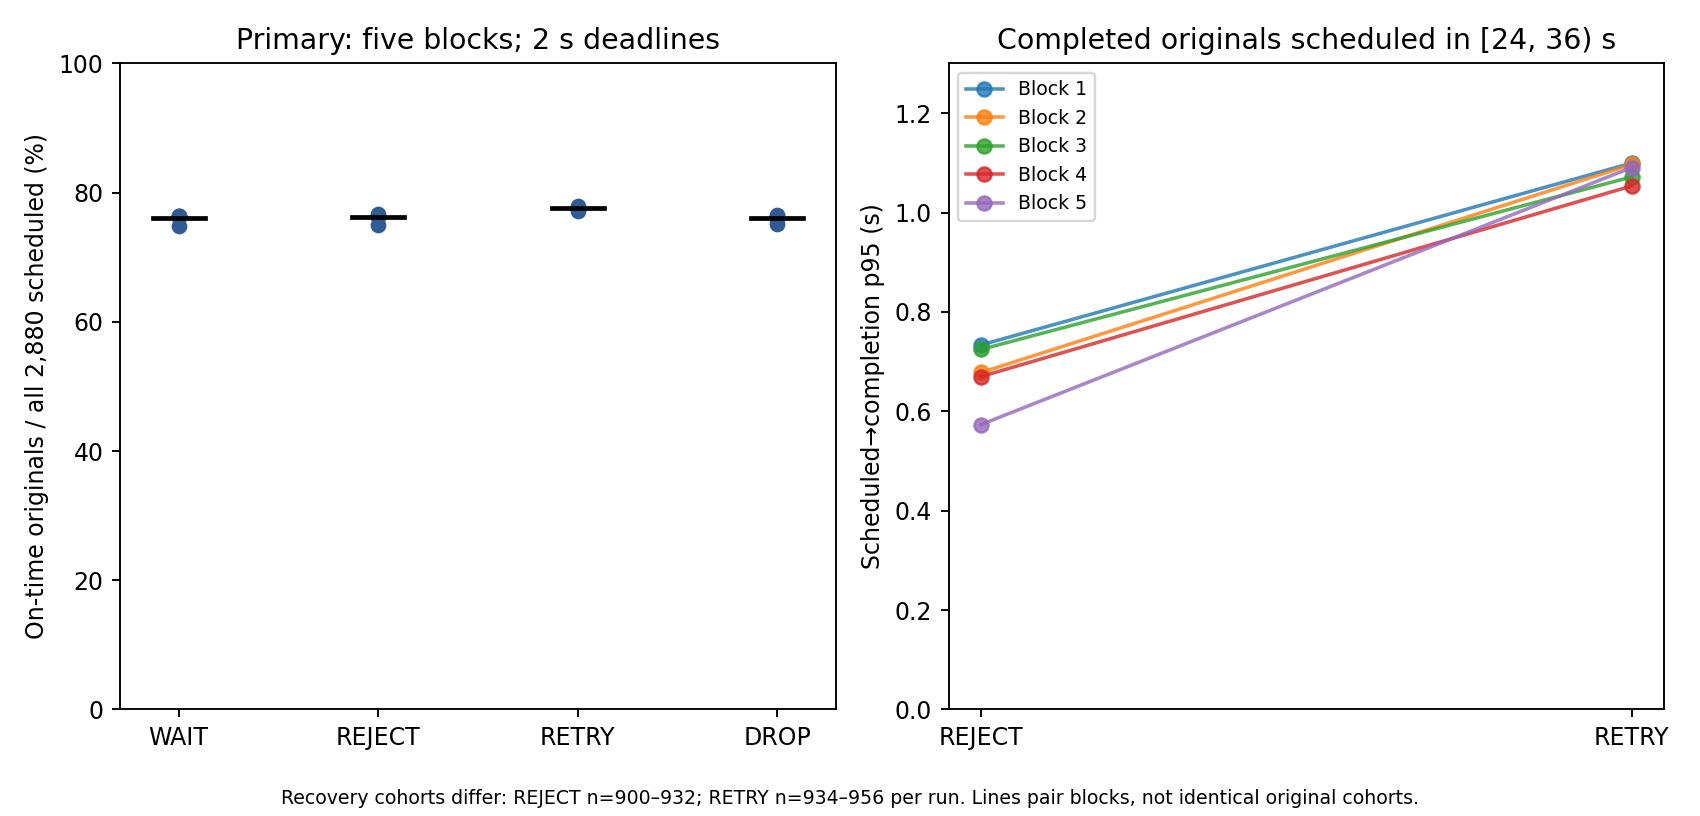
*Figure 1. Primary 2-second study, five matched blocks. Left: per-run useful-completion fraction of all 2,880 scheduled originals. Right: per-run p95 **only among completed originals scheduled during recovery 24,36) seconds**. REJECT’s completed cohort was **900–932/run**, RETRY’s **934–956/run**. These are different cohorts: the figure does not measure the latency difference for the same originals. [Reviewed figure · audit.*

RETRY’s on-time improvement averaged +1.410 percentage points across five paired blocks. But the client initiated 124.8 retries per run, and 91.2 more total attempts than REJECT-not 124.8 more, because RETRY first-attempted fewer distinct originals. The extra attempts did not cause exactly 40.6 extra completions in any directly measurable one-to-one way. Retry changed which originals entered the system, too.
The latency trade-off is real but conditional. For completed originals scheduled in the recovery phase, RETRY’s per-run p95 was 1.054–1.100 seconds, compared with 0.573–0.733 seconds for REJECT, worse in all five blocks. Because the completed cohorts differ and unfinished work is excluded, this is not a same-original causal latency comparison or an end-to-end guarantee.
The more detailed accounting-originals versus initiated attempts versus successful local Sends versus decoded requests, paired block counts, descriptive intervals, and retry conversions-is in the appendix. The important design lesson is simpler: a retry is not a free second chance; it spends a deadline and an attempt budget, and it can change who gets served.
Retry scheduling is another cost decision. In a separate eight-client study with staggered arrivals, fixed relative backoff produced fewer retry-timing collisions than uniform jitter. That does not establish fixed backoff as generally preferable; the appendix explains the −15.873% finding and its limitations.
5. Deadlines change what is worth saving
Suppose the same event is useful for only 500 ms instead of 5 seconds. Waiting or retrying can consume most of the shorter window before the worker has a chance to act. With more time, a second attempt may still be worthwhile-but longer deadlines also permit more work to remain outstanding.
In a separate Stage 6 secondary runtime, we executed actual 500 ms and 5-second application deadlines. Moving to 5 seconds improved on-time completion in all five paired blocks for every policy. The mean paired gains ranged from 9.278 to 13.799 percentage points, depending on policy. Yet longer time did not make RETRY universally preferable: at 500 ms, RETRY’s advantage over REJECT was −0.007 pp with an interval crossing zero; at 5 seconds, RETRY trailed WAIT by −0.222 pp on average in this secondary study.
One valid 500 ms WAIT run was markedly worse than its other four blocks. It remained in the analysis, materially lowered the mean, and its cause is unknown. The figure, complete block counts, and sensitivity context remain in the appendix.
These runs must not be pooled with the primary 2-second study or joined into a single 500 ms → 2 s → 5 s curve: the secondary study used a separately versioned runtime. Their practical lesson is about value over time, not a universal deadline threshold. Stage 6 evidence · approved claims C12–C16.
6. How to choose an overload policy in production
I would start with the original’s value and deadline, not a fashionable retry algorithm. The choices then become concrete:
- Define useful work. What outcome counts, and when does the original stop being valuable? Keep one immutable deadline across attempts.
- Decide whether loss is allowed. DROP needs an explicit expendability contract; REJECT needs a caller-side terminal decision.
- Bound both sides independently. Limit server admission ownership and client pending/outstanding work. A 32-slot application limit is not a whole-process RSS bound.
- Choose who may wait. If WAIT moves backlog to the caller, specify its capacity, cancellation and expiry behavior. If REJECT is chosen, make refusal visible and actionable.
- Budget retries end to end. Cap attempts, time, outstanding credits and backoff. A retry can improve useful completion while competing with fresh originals.
- Preserve original identity. Handle ambiguous responses and deduplication; in-memory deduplication is not durable exactly-once processing across crashes.
- Measure offered demand, not just admitted work. Count scheduled originals, first attempts, all attempts, on-time completions, late completions, refusal, expiry, discard and never-sent work separately.
- Specify terminal behavior when every budget is exhausted. The application should know what it promised-and what it did not.
For latency, separate original-schedule-to-completion from server queue residence, admission waiting and local Send duration. A local Send return does not prove remote application consumption, and those measurements should not be casually added into one end-to-end timeline. Also observe client backlog, worker occupancy, sampled memory and cohort sizes for conditional percentiles.
This experiment gives a reason to consider bounded RETRY when originals are valuable, deadlines leave room, and additional attempts are affordable. It does not show RETRY always wins. WAIT/REJECT/DROP primary useful-work ordering remains inconclusive; the controlled timer-based single-worker system is not a general production performance model.
7. Conclusion: decide which promises survive overload
A full queue is not just a performance problem. It is a decision about which promises your service can still keep.
Bounded admission protects a capacity boundary; it does not determine the fate of excess demand. WAIT pays in time and upstream backlog. REJECT hands a decision to the caller. RETRY can recover useful work by spending finite attempts and deadline. DROP accepts accountable loss for work allowed to disappear.
The three things worth remembering are: bound ownership, follow where the cost moves, and judge success against useful originals and their deadlines-not just server throughput.
Backpressure tells a sender to slow down. An overload policy decides what the system is willing to promise when slowing down is not enough.
Appendix: the evidence behind the decisions
The appendix keeps the approved outcome figures, secondary study and jitter detail, counter accounting, limitations and reproducibility references accessible without making the reader decode them before reaching the engineering decision.
A. Primary outcomes across all scheduled originals
The first result is about disposition, not speed. The same capacity schedule produced different mixes of on-time work, late work, refusal, explicit discard and demand that never reached the server.
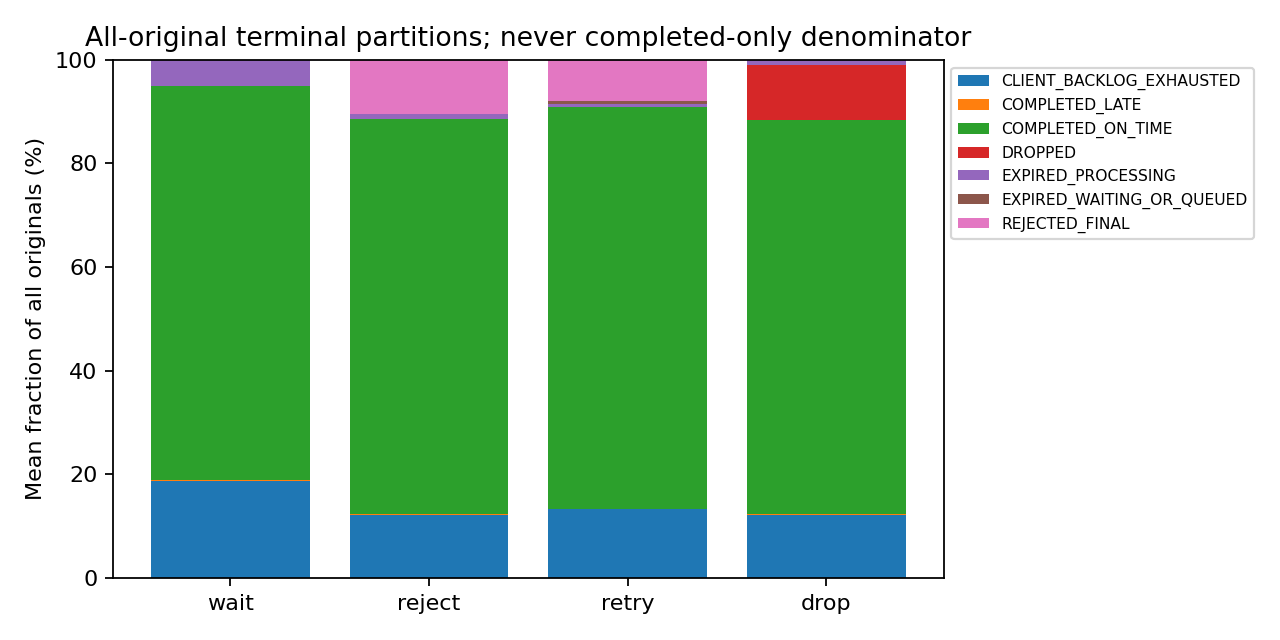
Figure 2. Primary single-client, 2-second application-deadline study; five matched blocks. Bars show mean fractions of all 2,880 scheduled originals per run, including never-sent/backlog-exhausted originals. Late completions are separate from on-time completions; refusal, discard and expiry are not successful processing. A missing original is not necessarily one the server received. Source figure and analysis.

On-time completion averaged 76.042% WAIT, 76.167% REJECT, 77.576% RETRY and 76.014% DROP. These percentages should not be read as a simple ranking of operational goodness. WAIT may preserve a chance to execute work while making the caller hold it. REJECT makes refusal visible and, in these runs, retained less queued-plus-worker payload-time than WAIT by a mean 0.500 MiB·s over 39 seconds across all five pairs. That integral excludes staging, transport, metadata and allocator memory; it is not a measured reduction in whole-process RSS.
DROP has different semantics from REJECT, even though we did not establish a distinct goodput/retention advantage for DROP in this all-expendable, response-acknowledged protocol. The paired descriptive intervals for WAIT versus REJECT versus DROP overlap zero. That leaves their goodput ordering inconclusive, not equivalent. Stage 7 claims C07–C11.
B. Retry accounting and recovery qualification
The accounting explains why 124.8 retry attempts do not mean 124.8 extra attempts compared with REJECT:
| Mean per primary run | REJECT | RETRY |
|---|---|---|
Distinct originals with a first attempt (F) | 2,529.8 | 2,496.2 |
| Additional retry attempts | 0 | 124.8 |
All initiated attempts (A) | 2,529.8 | 2,621.0 |
RETRY initiated 33.6 fewer distinct originals, so its 124.8 retries yielded 91.2 more total attempts than REJECT (3.605% more than REJECT’s attempt count). Those retries are 4.333% of scheduled originals; among RETRY’s first-attempt originals, A/F=1.0500. Its A/N=0.9101 is still below one because some scheduled originals were never attempted. Initiated attempts (A), local successful Sends (S), decoded server attempts (R) and useful originals (U) remain separate accounting events.
The cost was not only attempt volume. Among completed originals originally scheduled in recovery [24,36) s, RETRY’s per-run p95 was 1.054–1.100 s, versus 0.573–0.733 s for REJECT, higher in all five blocks. RETRY’s completed cohort was 934–956/run versus 900–932/run for REJECT. A completed-only quantile excludes failures and unsent work; because membership differs, it does not show how much retrying delayed any particular original.
The logs also record 88, 95, 100, 83, 77 previously refused originals that later completed on time under RETRY. These are real retry conversions, not the net counterfactual benefit: changing admissions and send schedules also changes which other originals finish. The paired net useful-work differences remain 75, 22, 34, 47, 25. Primary per-run results · Stage 7 C03–C06.
Even “recovery” needs careful scope. The server’s pre-24-second admitted cohort cleared roughly 0.4 seconds after the slowdown ended, yet client pending/outstanding work remained at 36 seconds. Clearing old server work is not proof that the entire client-server system has recovered. Stage 7 claims C03–C06, C11, C24; independent audit.
C. Deadline study, figure and valid anomaly
What if the original has much less time, or much more?
We ran a separate secondary study, using a separately versioned runtime, with actual immutable 500 ms and 5-second original deadlines. These were new executions, not the primary 2-second results reclassified after the fact. We do not pool the studies or draw a single 500 ms → 2 s → 5 s performance curve across their different runtime families.
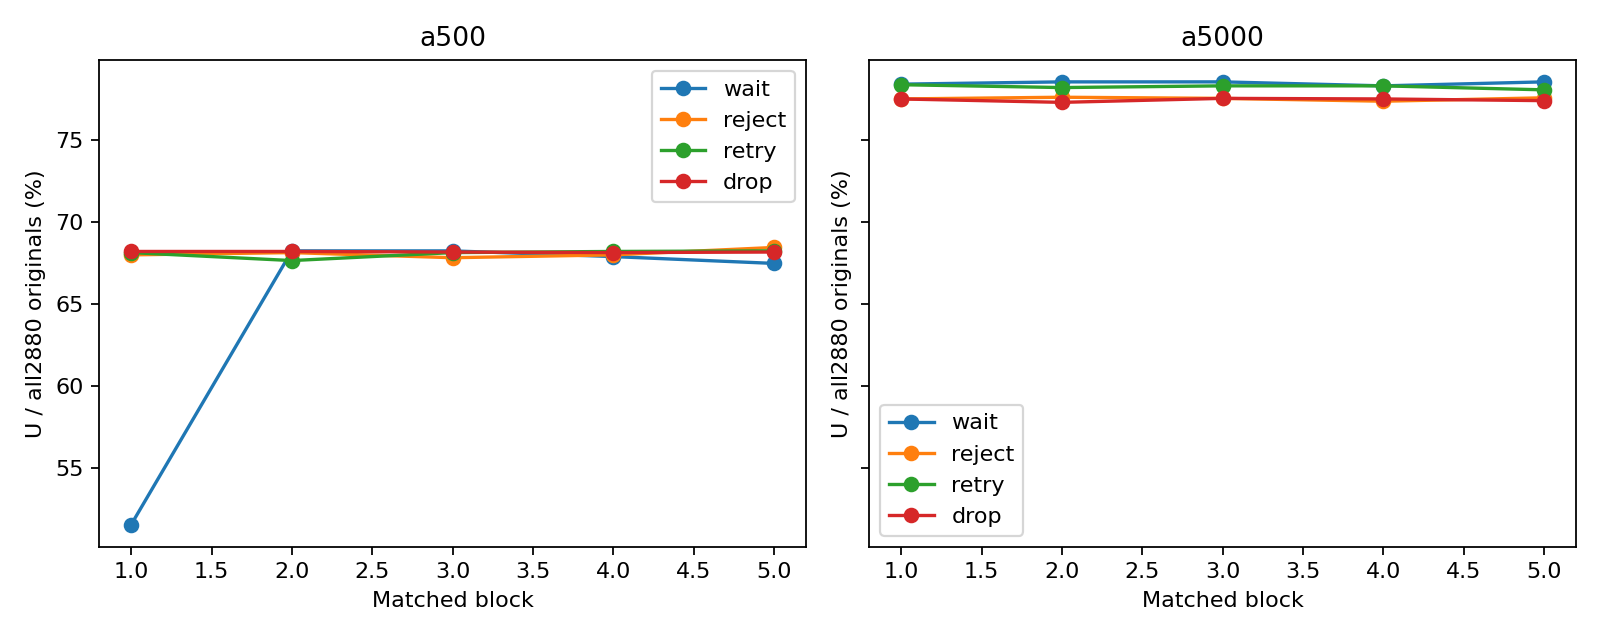
Figure 3. Separate Stage 6 secondary-A executions at actual 500 ms and 5 s application-level original deadlines, five matched blocks per condition and the same secondary application binaries. Every fraction uses all 2,880 scheduled originals/run. The low 500 ms WAIT block 1 point is valid and unexplained; it remains included. These panels must not be joined to the primary 2-second study as a common deadline curve. Source figure.

Within this secondary runtime, moving from 500 ms to 5 seconds improved U/N in all five paired blocks for every policy. The mean paired gains were 13.799 pp WAIT, 9.444 pp REJECT, 10.181 pp RETRY, and 9.278 pp DROP. But extra time did not make RETRY uniformly attractive: at 500 ms, RETRY minus REJECT averaged −0.007 pp, with an interval crossing zero; at 5 seconds, RETRY minus WAIT averaged −0.222 pp (descriptive interval −0.382 to −0.063). These comparisons are model-specific, not a recommendation to make deadlines arbitrarily long.
One valid observation complicates the deadline result: 500 ms WAIT block 1 completed only 51.5625% on time, well below its other four blocks. It passed the frozen validity checks, was neither rerun nor excluded, and pulled the five-block mean to 64.701% versus median 67.917%. Its cause is unknown. We keep the point visible in Figure 3 and the full five-block accounting in the appendix; no CPU, scheduler, warm-up or cancellation story has been isolated as an explanation. Audited anomaly.
D. Eight-client retry collision and backoff sensitivity
Retry advice often includes randomized backoff to avoid a synchronized herd. We tested a narrower proposition: under our specified eight-client workload, would a common fixed relative backoff concentrate retries into the same short time bins more than uniform jitter?
Eight clients each scheduled 10 originals/s, still 80/s total and 2,880 originals, sharing one 32-slot server and one worker. This was not eight times the offered demand. It did introduce eight connections and larger aggregate client capacity: 264 outstanding and 256 pending rather than the single-client limits.
We measured actual initiated retries during the slowdown interval [12,24) seconds. Divide that interval into 600 bins of 20 ms. For M initiated retries, the collision fraction is the number of distinct retry pairs sharing a bin divided by M(M−1)/2. This is a timing-concentration measure, not a transport stall, successful-processing rate or count of independent experimental replicates.
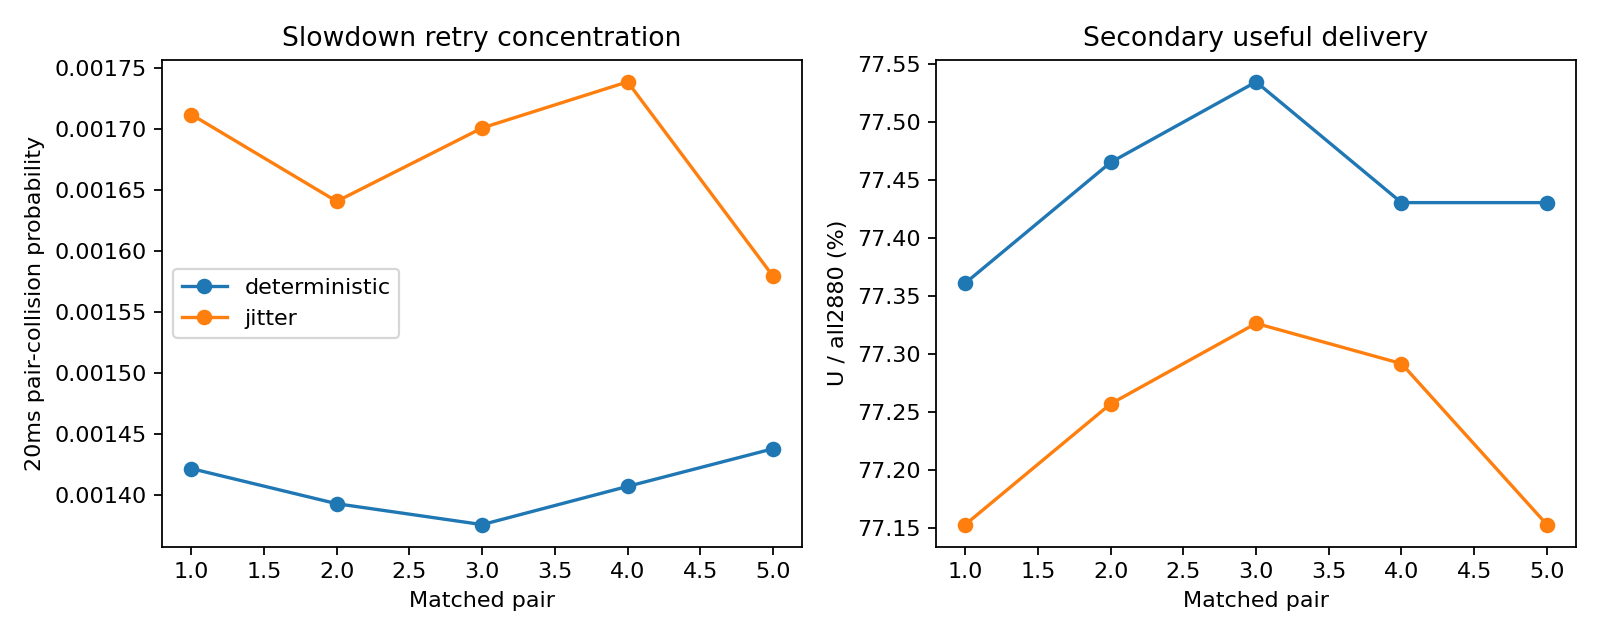
*Figure 4. Stage 6 secondary-B2, five matched eight-client pairs. The left panel measures the probability that two distinct **initiated retries in 12,24)** fall in the same one of **600 fixed 20 ms bins**, normalized by 0; retry counts vary across runs (fixed **1,468–1,485**, jitter **1,476–1,515**). No synchronized original-arrival burst was injected. **Only the left panel supports the collision claim.** The right panel’s U/N axis is deliberately zoomed; its approximately **0.208 pp** contrast is small and must not be visually read as a large winner. [Source figure; reviewed bin calculations.*

The directional prediction failed in this model. Fixed relative backoff had lower collision in all five pairs: the mean of paired relative differences was −15.873% (descriptive interval −18.704% to −12.236%). That measures relative retry timing concentration, not a percentage-point change in useful completion.
Why isn’t that a verdict against jitter? The eight clients’ original arrivals were staggered. If clients start at different times, waiting the same number of milliseconds after each refusal need not make them retry at the same absolute time. We did not inject a synchronized herd. Moreover, fixed 100/200 ms delays versus uniform [0, cap] jitter changed expected wait duration as well as variability. Different retry populations, client timing and transport behavior remain possible contributors; the study does not isolate any one cause. The bin-width/offset checks and the pre-traffic B2 seed correction are documented in the appendix. Audited H6 result · Stage 7 C17–C21.
E. Methods, limitations and reproducibility
Evidence hierarchy. The Stage 7 review, approved claim matrix, publication outline and chart registry govern this manuscript. Primary results: Stage 5 report, primary analysis. Secondary results: Stage 6 report, secondary analysis, independent raw arithmetic audit. The review independently recomputed key arithmetic but was not an external-laboratory replication.
Replication and intervals. Five paired blocks per comparison. Descriptive 95% paired-block bootstrap intervals enumerate 3,125 ordered five-block resamples. These are not significance/equivalence tests or guarantees of population coverage. Primary (20 runs), secondary deadline (40 runs), and eight-client B2 (10 runs) are separate populations, not a 70-run pooled experiment. Conditional latency cohorts and initiated retry populations differ.
Observation and recovery. Primary and secondary 500 ms observations end at 39 s; secondary 5 s ends at 42 s. The separate boundary-correct recovery figure shows observed rate bins through [38,39) and client backlog endpoints at 39 s. The older recovery plot’s zero at 39 s is an unobserved closure sentinel, not a measured [39,40) rate. Clearance of work admitted before 24 s is not full-system recovery.

Implementation and resource boundaries. Rust used normal debug builds and Go default builds. Work is simulated with timers, not production CPU saturation. Shared-host scheduling, polling, logging, state locks, client payload generation/hashing/serialization, and native secondary multi-stream routing are part of the measured model; their overhead was not isolated. The primary and secondary applications differ. Server-owned payload-time, staging, ledger estimates, transport allocations, sampled RSS and client memory are distinct. CPU and RSS samples have finite resolution; the experiments do not establish a continuous memory bound, durable exactly-once effects, isolated HTTP/2 stalls or remote consumption from successful writes.
The valid 500 ms WAIT anomaly, all five blocks. On-time original counts: 1,485, 1,966, 1,966, 1,956, 1,944 (each out of 2,880). Block 1 recorded 363 late completions versus 5–26 in the other blocks. Its paired 5 s-minus-500 ms gain was 26.875 pp; the all-five mean deadline gain was 13.799 pp versus median 10.417 pp. This changes the estimated magnitude and uncertainty, not the direction of all five deadline contrasts. Stage 6 per-block table · Stage 7 C15–C16.
Eight-client H6 sensitivity and provenance. The primary collision measure uses initiated retries in **12,24) s**, 600 fixed **20 ms** bins and 0 unordered distinct retry pairs per run. Fixed retry counts ranged **1,468–1,485**, jitter **1,476–1,515**. The paired fixed-minus-jitter collision difference averaged **−0.000267843**, and the negative direction also held for shifted 20 ms and 10/50 ms bin definitions. These are sensitivity checks, not independent replications. The originally planned B client seed derivation produced overlapping finite RNG sequences. A source-inspection boundary stop occurred **before B traffic**; the domain-separated SHA-256 seed amendment was committed and frozen before the corrected B2 runs, preserving the original plan, interruption records and all outcomes. The amendment did not respond to a B result. [Stage 7 H6 arithmetic · B2 amendment · boundary verification.
Figure provenance and presentation QA. All four main images reference the Stage 7-reviewed commit 25771cda76abfbcee32f994841a67e900efe5833, not mutable main. They reproduce approved figures without changing endpoints. Figure 4 retains the original two-panel artifact: only its left collision panel supports the H6 claim; the right goodput axis is zoomed and its ~0.208 pp difference must not be mistaken for a large win. Before WordPress publication, verify all four image URLs resolve and inspect labels, legends, figure widths and mobile legibility at 700–800 CSS px. Image rendering was not independently verified during this Markdown revision. Chart registry.
Archived exceptions and provenance. The valid 500 ms WAIT block 1 remains in every five-run result. The B2 seed amendment preceded any B traffic; the superseded seed plan and boundary-stop record remain available. Source hashes, immutable workloads/deadlines, per-original reconciliations, attempt events, freeze records, validity outputs and exclusions are linked from the Stage 5, Stage 6 and Stage 7 reports. Reproduce analysis from preserved evidence; do not overwrite raw run directories.
gRPC Under Pressure
A three-part engineering series on backpressure, admission control, and overload.