


In this post, we will see how to perform performance testing using k6 and grafana. we will learn how to run a k6 script and see the result in the k6 grafana dashboard.
What is performance testing
Nonfunctional testing that ensures that the application performs properly under its expected workload is called Performance testing. Performance testing is a kind of testing to analyze the quality and capability of the application
The main attributes are:-
Speed
Scalability
Reliability
stability
What is k6 in performance testing
- K6 is an open-source load testing tool that makes performance testing simple and valuable for the engineering team.
- K6 is free, developer-centric, and extensible.
- Grafana Labs and the community have developed K6.
Key features of K6
- CLI tool with developer-friendly APIs
- Scripting with javascript with support for local and remote modules
- Already Inbuilt checks and Threshold APIs for goal-oriented automation-friendly load testing
Use cases in k6
- Minimal consumption of system resources
- Designed for running tests with high load
- Provide a great experience for performance testing automation
- Provides monitoring of the performance with some integrated sources like Grafana, InfluxDB, AWS Cloudwatch etc.
Started with k6
The very first thing that if you don’t have it installed already if you’re on Linux os just
sudo apt-get update
sudo apt-get install k6
How to run a k6 script
Below is a basic k6 script
- If you want to ramp the number of Vus up and down then you can ramp the number of VUs up and down at the time of test. we will use the options. stages to ramping up and down
import http from "k6/http";

import { check, sleep } from "k6";

export const options = {

stages: [

// Ramp-up from 1 to 4 virtual users (VUs) in 4s
{ duration: "4s", target: 4 },

// Stay at rest on 4 VUs for 8s
{ duration: "8s", target: 4 },

// Ramp-down from 4 to 0 VUs for 4s
{ duration: "4s", target: 0 },

],

};
export default function() {

const response = http.get("https://httpbin.test.k6.io/");

check(response, { "status should be 200": (r) => r.status ==200 });

sleep(1);

}- we can run the k6 script locally and on the cloud also you will use this command to run on local
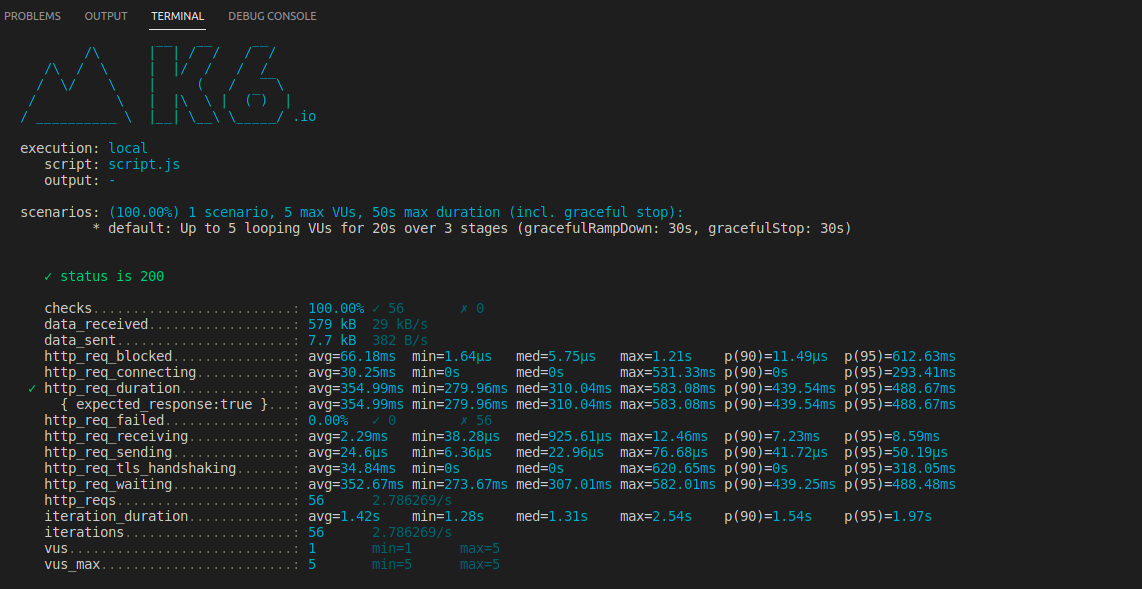
k6 run script.js
- and test case running and looks like this
we will use this command to run on the cloud
k6 cloud script.js
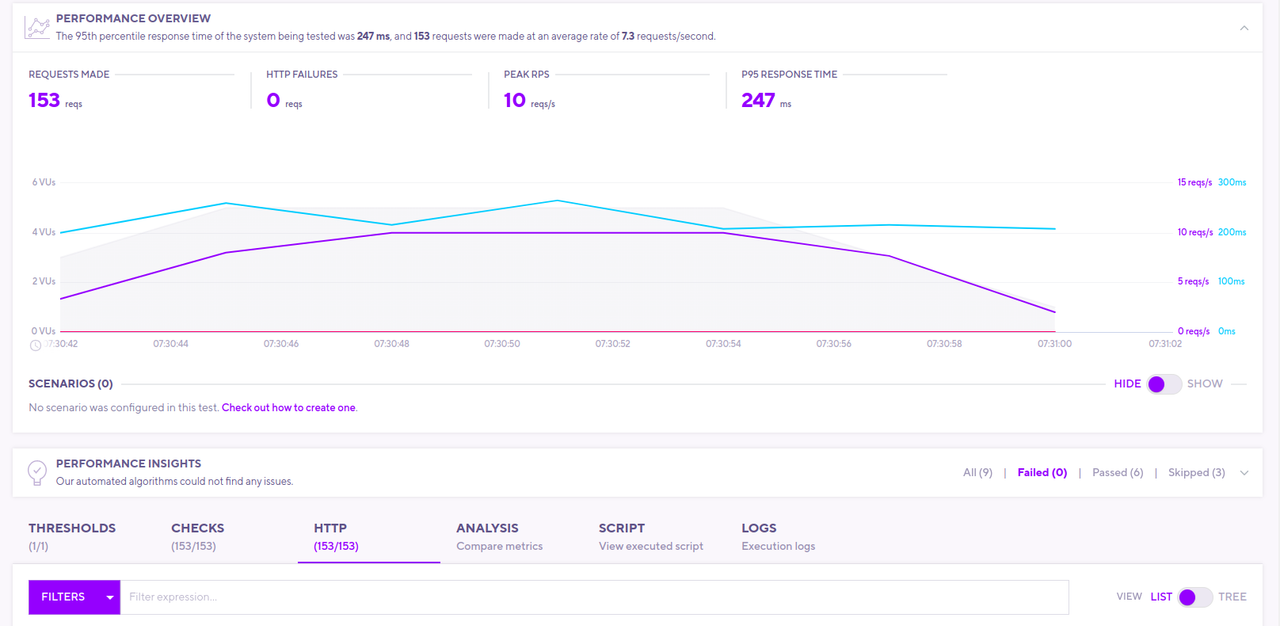
- test case running on the cloud so we can see the real-time metrics and get some feedback rather than the output only
K6 with grafana
Many people didn’t quite understand what the connection was between k6 and grafana but we can explain as grafana brings observability and k6 brings data so they work really well together
- So what you need to do is grafana marketplace (grafana k6 cloud) and then you’ll just have to go to configuration and then data sources and then do search for k6 it should show up there
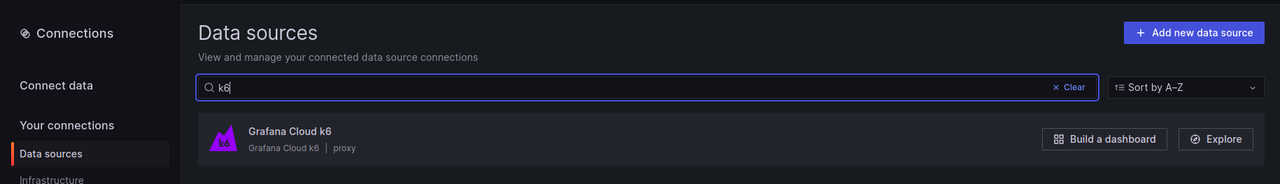
- Click on k6 then it will ask for the API token you just go to your account settings and click API token you copy the string that’s there and paste it here and then you can then save and test
- And then go to the dashboards and import this 2 dashboard
K6 cloud test run list
K6 cloud test result
- If you will click on the K6 cloud test run list you will see the list of test cases that are completed
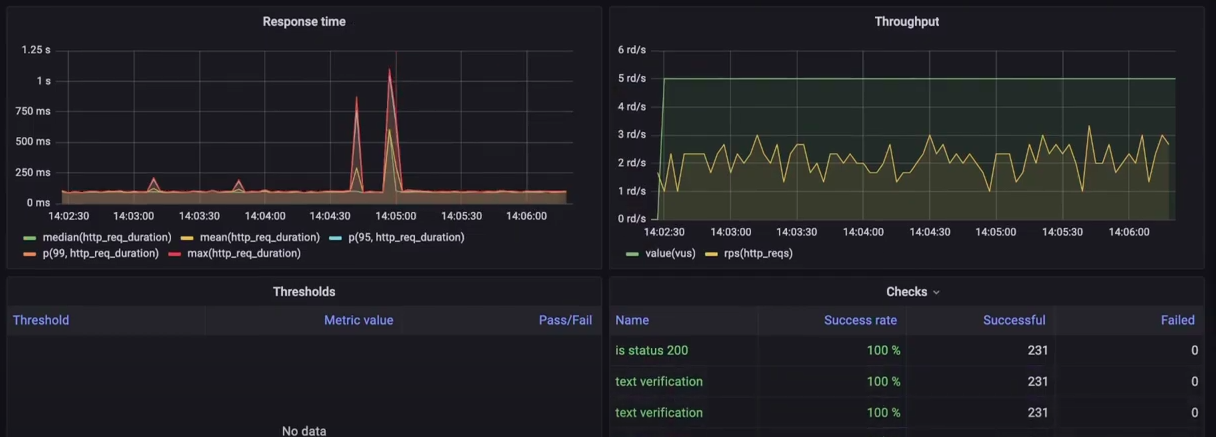
- And if you will click on the K6 cloud test result you will see the result in the metrics form and looks like this
References:-