


1. Introduce
When it comes to Performance testing, the usual suggestions I hear are JMeter, K6, LoadNinja, etc. Selecting a perfect performance testing tool is one of the biggest challenges testers must overcome. Have you ever thought about selecting Postman as a Performance-testing tool? I recently found Postman has built-in capability to run load (performance) testing.
There are two core functionalities we will discuss in this post:
- Using Postman to simulate load by having multiple parallel virtual users hit your endpoints.
- Visualizing the metrics of your APIs under the simulated load in real time.
2. Steps to run Performance Testing
2.1. How to run tests
Step 1: Create your collection and add APIs you want to test first.
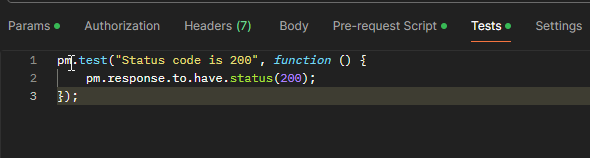
Step 2: Add assertions.
- You should use assertions. In load tests, assertions verify that a server returns an expected result.
- Select the Tests tab to add assertions. Verifying request responses in Postman is done by writing tests in JavaScript.
- There are several approaches to implementing assertions in the Postman, each serving a unique purpose. The main assertion types include:
-
- Status code assertion
- Response Body Assertions
- Header Assertions
- JSON Schema Assertions
- XML Assertions
-
For example: write the assertion code using the pm library
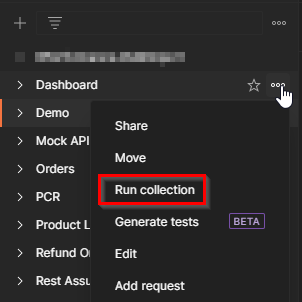
Step 3: Select the Postman collection you are planning to execute performance testing and click on Run collection.
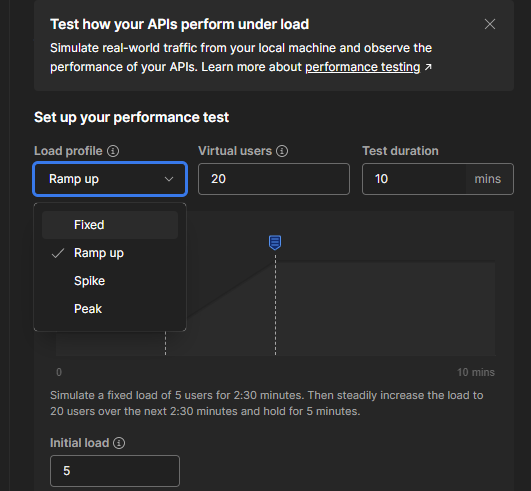
Step 4: Select the Performance tab on the right. There will be 3 options:
- Load profile: the intensity of the load during the test’s duration.
-
- Fixed: all virtual users will repeatedly run the collection in parallel.
- Ramp up: the number of VUs slowly increases from the initial load to the maximum.
- Speak: the number of VUs increases from the base load to the maximum, then decreases back to the base load.
- Peak: the number of VUs increases from the base load to the maximum, holds steady, then decreases back to the base load.
-
- Max Virtual Users: how many users will simultaneously call the collection.
- Test duration: how long the test will load (in minutes).
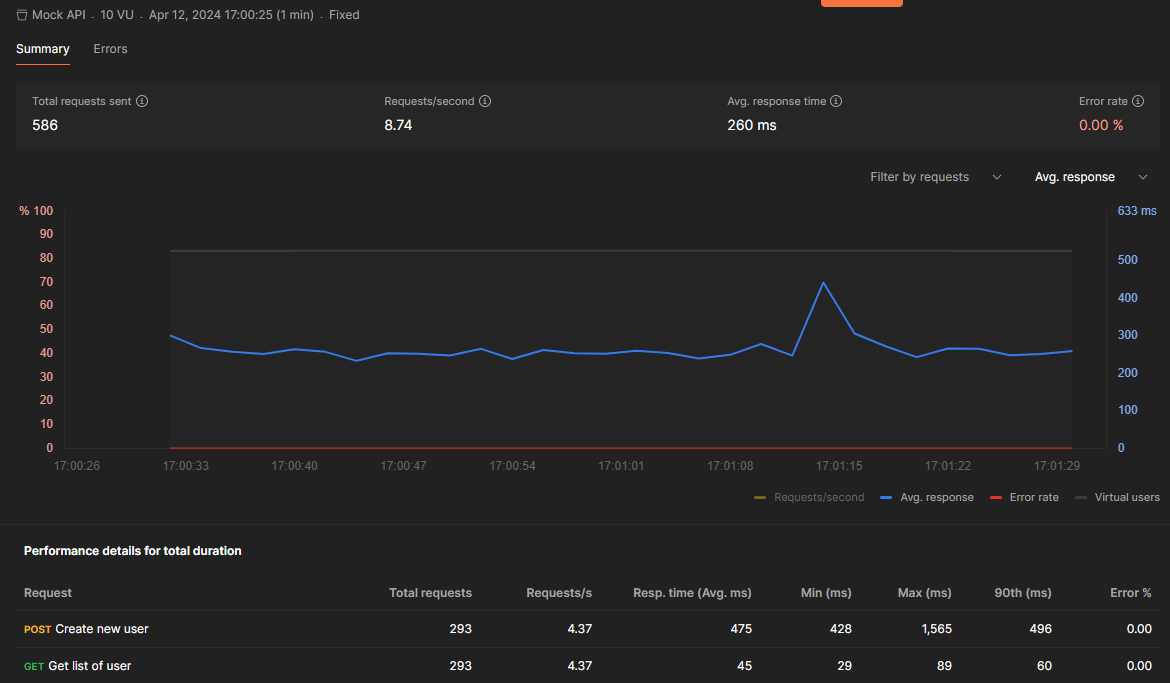
2.2. Analyze test result
After the execution runs, you will get a nice graph with detailed results. This report provides the following basic metrics:
- Total requests sent
- Requests/second (throughput)
- Avg response time
- Error rate
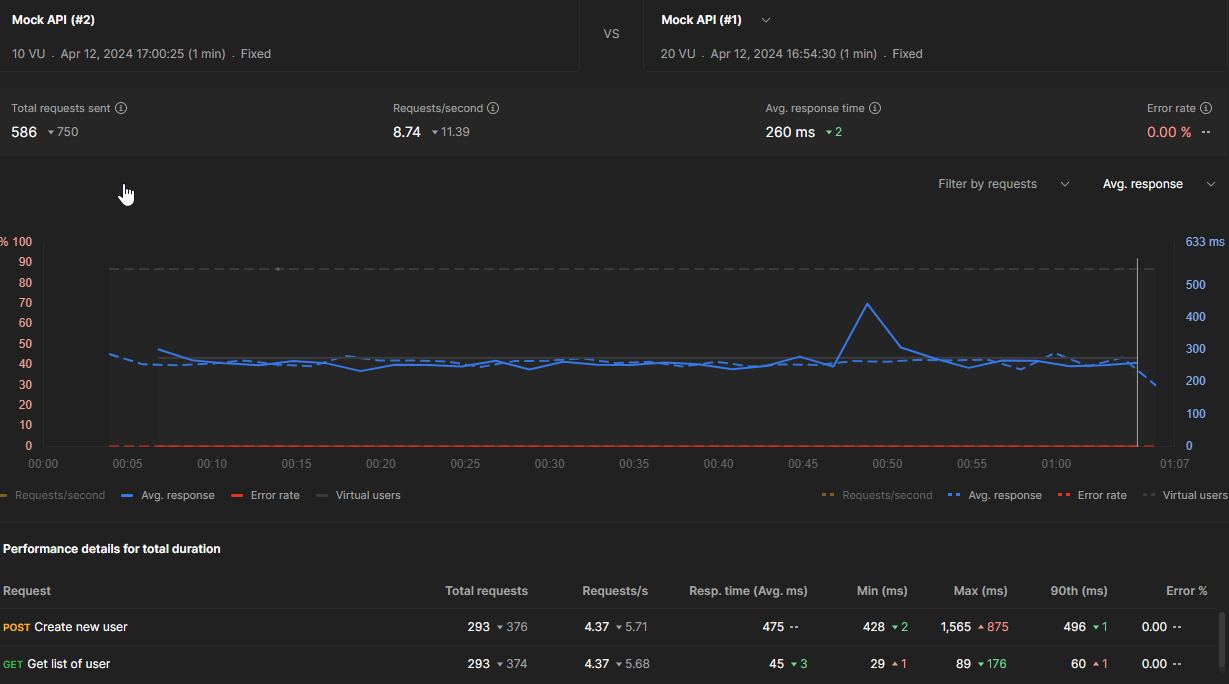
2.3. Compare two performance runs
Usually, to compare results, performance tester base on the Summary Statistics and look for differences between response time of the test results. Though this is a straightforward approach, it does not help you see the whole picture of the differences between the test runs.
Consequently, to understand how the performance of your API has changed over time, you can compare performance runs by using the built-in feature “Compare runs”. Select 2 runs to compare, and Postman will visualize differences between the 2 runs like this:
3. Highlights of this release
- Simulate real traffic: You can now simulate real-world traffic from your machine.
- Observe performance metrics: watch response times, requests per second, and error rate. This will help you measure and improve your API performance under simulated load and identify bottlenecks before going to production.
- Compare 2 performance runs: comparing test results with the built-in feature “Compare runs” to help you measure the improvement or degradation brought along by the second version of the application.
4. Postman vs JMeter
| Feature | Postman | JMeter |
| Plans & Pricing | Free for individuals & small teams (up to 3 users) | Available for free |
| Integrations | Azure Pipelines, Bitbucket Pipelines, CircleCI, GitHub Actions, GitLab CI/CD, Jenkins, Travis CI | Jenkins, Apache Maven, InfluxDB and Grafana, Apache Kafka |
| Community Support | It has a vast user community, tutorials, and community support. | Has a large and active community of users and contributors, with many resources and forums available. |
| User-Friendliness | Postman gives a person-friendly interface. | It is Complex for beginners, but it has many resources and tutorials available to help users get started. |
| Test Scripting | Postman tests are run using JavaScript. | Beanshell, Groovy, JavaScript or JEXL
Groovy has become the recommended scripting language. |
| Report | Postman offers a quite basic report. | JMeter supports dashboard report generation to get useful graphs and statistics separately, it is easy to track. |
| Max Virtual Users |
|
doesn’t have a limit on virtual users. |
5. Conclusion
In conclusion, Postman has limitations, but it is impressive that you can go from nothing to an easy performance test in minutes. There is sometimes a need to run performance tests immediately, without researching solutions, coding, and training testers to use cumbersome tools. On numerous occasions, I have found Postman to be the remedy to such a problem.