


If you’re at an intermediate level and just starting to run your applications on a VPS or server, everything usually feels fine when:
- You only have a few apps
- Or a small number of containers
However, once your system grows—more applications, more containers, more users—you’ll quickly notice resource pressure:
- CPU spikes
- RAM exhaustion
- Disk I/O bottlenecks
- Network saturation
Most people initially estimate resource usage manually:
- “This app probably uses more CPU”
- “That service has more users”
- “Maybe it’s time to upgrade the server or add a load balancer”
This approach might work short-term, but manual estimation is time-consuming, inaccurate, and not scalable.
And then… tada ✨
After some serious tinkering, I found a powerful yet completely free monitoring combo that gives:
- Extremely detailed metrics
- Real-time visibility
- A beautiful dashboard
- Easy setup with Docker
What Can This Monitoring Stack Do?
Example: Basic Server Metrics
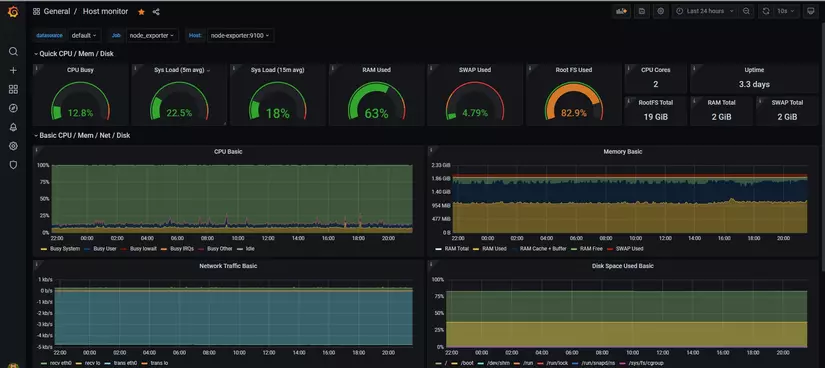
- CPU usage
- Memory usage
- Disk usage
- Network traffic
Example: Docker Container Monitoring
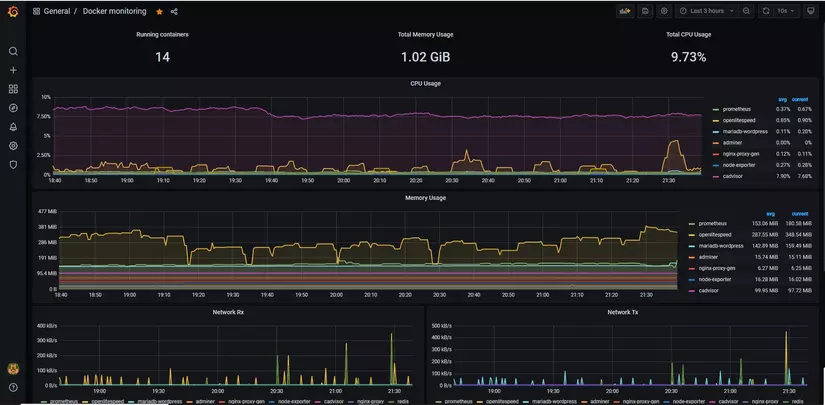
- Per-container CPU/RAM
- Container restarts
- Resource limits & consumption
📊 The best part?
The dashboards look insanely good—and everything is FREE.
And with Docker, the setup is surprisingly simple (this is why we love Docker 😛).
Monitoring Stack Components (Explained Simply)
🔹 Node Exporter
- Written in Go
- Collects host-level metrics:
- CPU
- Memory
- Disk
- Network
- Think of it as a server health sensor
Exporters are services that expose metrics so Prometheus can collect them.
🔹 cAdvisor (by Google)
- Specialized exporter for containers
- Provides:
- CPU / RAM per container
- Container lifecycle metrics
- Perfect for Docker & Kubernetes environments
🔹 Prometheus
- The heart of the system
- Responsibilities:
- Periodically pull metrics from exporters
- Store them as time-series data
- Support alerting (Alertmanager)
Example:
“Every 20 seconds, collect metrics from Node Exporter and cAdvisor.”
⚠️ In this article, we focus on monitoring, not alerting—but you can easily add alerts later.
🔹 Grafana
- Visualization layer
- Turns raw metrics into:
- Beautiful dashboards
- Time-series graphs
- Alerts (optional)
Grafana can visualize data from many sources, but Prometheus is the most common pairing.
Monitoring Architecture (Single VPS)
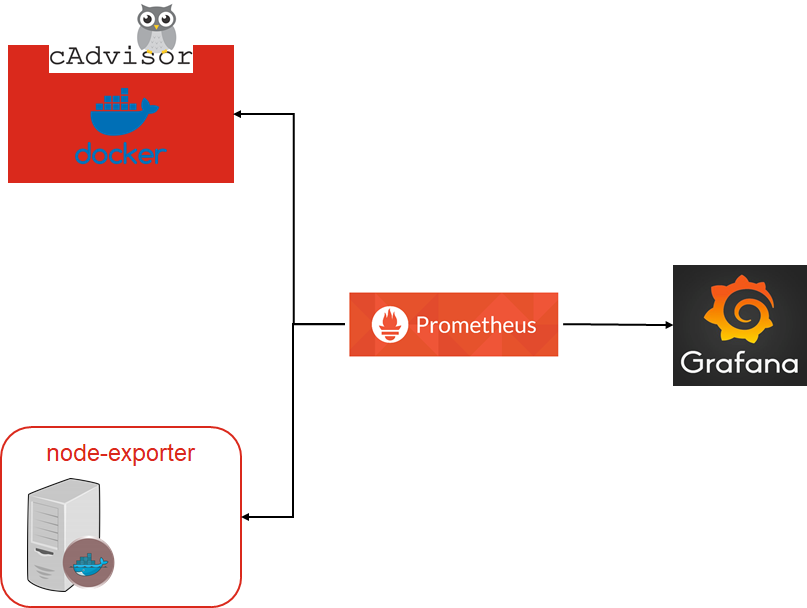
How it works:
- Node Exporter & cAdvisor expose metrics
- Prometheus scrapes and stores metrics
- Grafana queries Prometheus and displays dashboards
Simple, clean, effective ✅
Hands-On: Let’s Build It with Docker Compose
Step 1: Prometheus Configuration (prometheus.yml)
global:
  scrape_interval: 20s
  scrape_timeout: 15s

scrape_configs:
  - job_name: cadvisor
    static_configs:
      - targets:
          - cadvisor:8080

  - job_name: node_exporter
    static_configs:
      - targets:
          - node-exporter:9100
Explanation:
scrape_interval: 20s→ collect metrics every 20 secondsjob_name→ logical grouping for exporterscadvisor:8080works because Docker Compose creates internal DNS names- Default ports:
- cAdvisor: 8080
- Node Exporter: 9100
Step 2: Docker Compose (docker-compose.yml)
version: "3.8"

services:
  cadvisor:
    image: gcr.io/cadvisor/cadvisor:v0.49.1
    container_name: cadvisor
    restart: always
    volumes:
      - /:/rootfs:ro
      - /var/run:/var/run:rw
      - /sys:/sys:ro
      - /var/lib/docker:/var/lib/docker:ro

  node-exporter:
    image: prom/node-exporter:v1.7.0
    container_name: node-exporter
    restart: always
    volumes:
      - /proc:/host/proc:ro
      - /sys:/host/sys:ro
      - /:/rootfs:ro
    command:
      - "--path.procfs=/host/proc"
      - "--path.sysfs=/host/sys"
      - "--path.rootfs=/rootfs"

  prometheus:
    image: prom/prometheus:v2.48.0
    container_name: prometheus
    restart: always
    volumes:
      - ./prometheus.yml:/etc/prometheus/prometheus.yml
    depends_on:
      - cadvisor
      - node-exporter

  grafana:
    image: grafana/grafana:10.2.0
    container_name: grafana
    restart: always
    ports:
      - "3000:3000"
    depends_on:
      - prometheus
✔️ Versions updated to stable 2024–2025 releases
Step 3: Start the Stack
docker-compose up -d
Access Grafana
Open your browser:
http://<VPS-IP>:3000

Example:
http://132.123.xx.xx:3000
Default Login:
- Username: admin
- Password: admin
(Change it immediately after login ❗)
Import Ready-Made Dashboards (Fast & Effective)
Grafana provides community dashboards to save time.
Recommended Dashboards:
- Node Exporter Full → ID 1860
- Docker / cAdvisor → ID 193
How to Import:
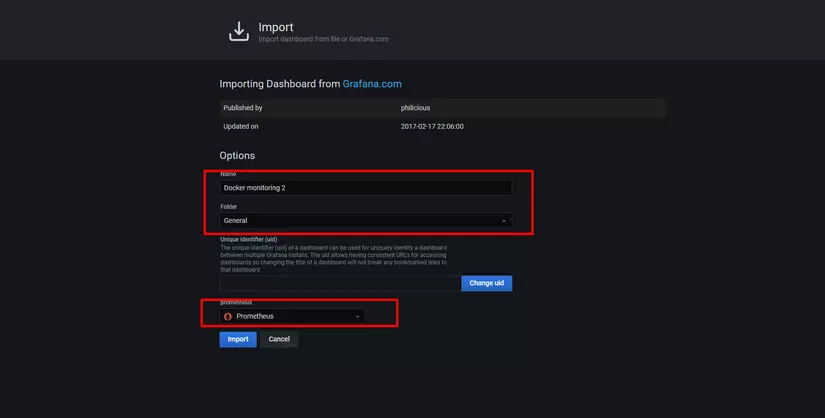
- Grafana → Dashboards → Import
- Choose Import via grafana.com
- Enter Dashboard ID
- Select Prometheus as data source
- Click Import
Repeat for each dashboard.
🎉 And tada! You now have professional-grade monitoring.
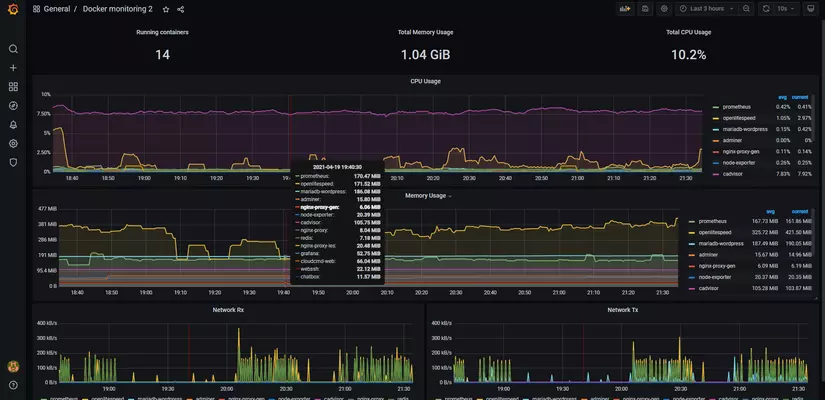
Final Result
- Real-time server metrics
- Container-level visibility
- Clean, interactive dashboards
- Zero cost
- Setup time: ~30 minutes
Before, this could take weeks.
Now? Too easy 😎
What’s Next?
You can extend this system by:
- Adding Alertmanager (CPU/RAM thresholds)
- Customizing dashboards
- Monitoring multiple servers from one Prometheus
- Moving to Kubernetes later
And to complete the observability stack…
👉 Coming next:
Docker Log Monitoring with Loki & Fluent Bit 🔥
Stay tuned 😃