


Introduction
In today’s rapidly evolving digital landscape, monitoring and managing applications are critical tasks for ensuring optimal performance, reliability, and user experience. With the rise of containerized applications, it becomes even more imperative to have robust monitoring solutions in place. One such powerful tool for application monitoring is Dynatrace, which provides comprehensive insights into the performance of applications and infrastructure.
In this guide, we’ll walk you through the process of setting up Azure Container Apps in Dynatrace, enabling you to effectively monitor and manage your containerized applications on the Azure platform.
Azure Container App monitoring
Enable monitoring
Monitor resources based on tags
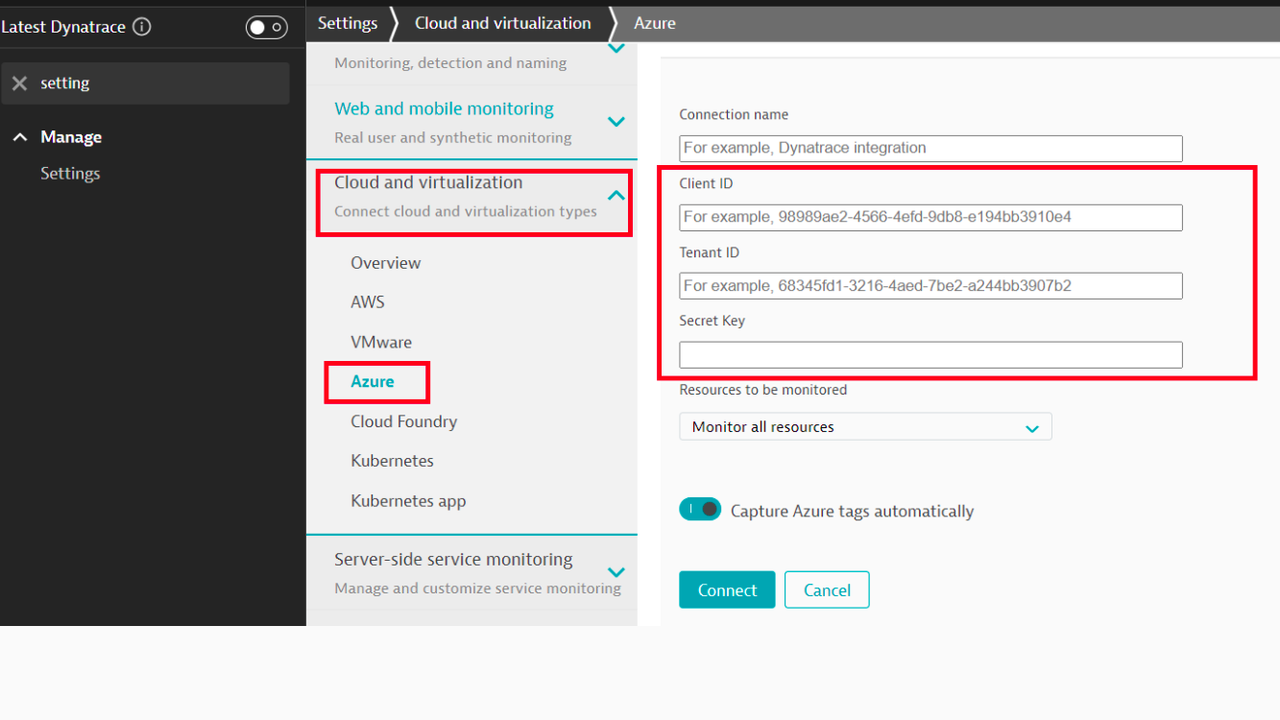
- Go to Settings > Cloud and virtualization > Azure.
- Click on Connect new instance.
- Add details that mentioned below in the image.
Add Azure Client-ID , Tenant-ID , Secret. - Click on Connect.
Add the service to monitoring
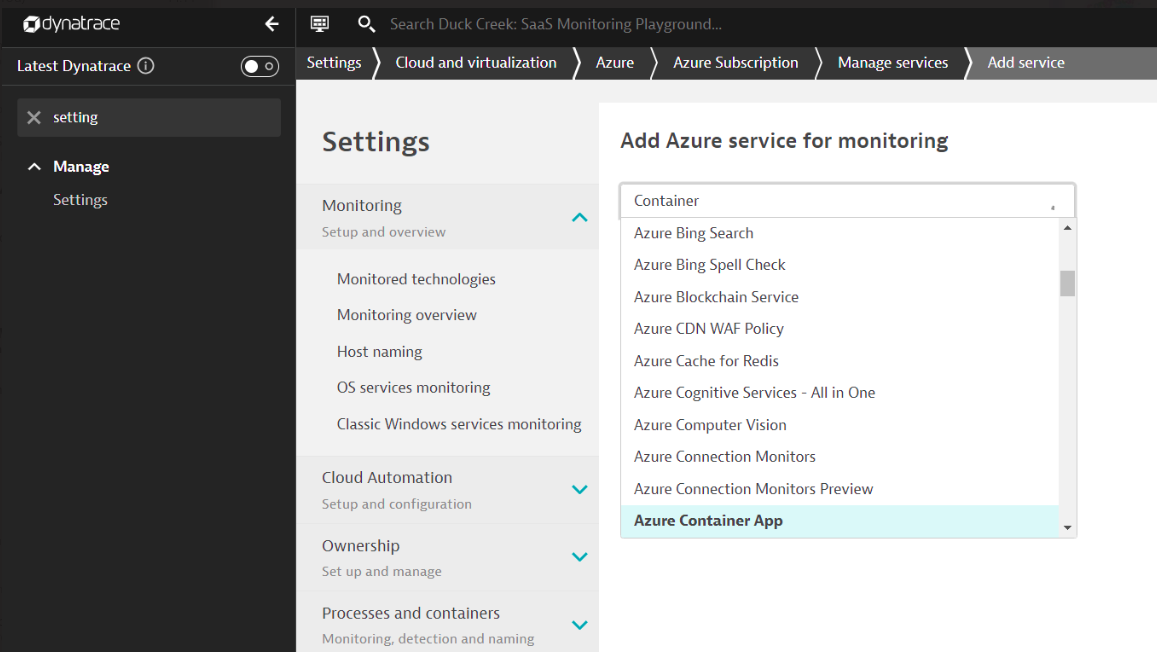
In order to view the service metrics, you have to add the service to monitoring in your Dynatrace environment.
- Go to Settings > Cloud and virtualization > Azure.
- On the Azure overview page, select Edit for the desired Azure instance.
- Go to Manage Services > Add service, choose the desired service name from the list, and select Add service.
- Select Save changes to save your configuration.
Monitor resources based on tags
You can choose to monitor resources based on Azure tags, as Dynatrace automatically imports them from service instances.
To monitor resources, based on tags
-
Go to Settings > Cloud and virtualization > Azure.
-
On the Azure overview page, select the Edit
 icon for the Azure instance.
 -
Set Resources to be monitored to Monitor resources selected by tags.
-
Enter key/value pairs to identify resources.
-
Select Save to save your configuration.
View Service Metrics
You have the option to access service metrics within your Dynatrace environment through either the custom device overview page or your Dashboards page.
View metrics on the custom device overview page
To access the custom device overview page
- Go to Technologies & Processes or Technologies & Processes Classic.
-
Filter by service name and select the relevant custom device group.
- Once you select the custom device group, you’re on the custom device group overview page.
- The custom device group overview page lists all instances (custom devices) belonging to the group. Select an instance to view the custom device overview page.
View metrics on your dashboard
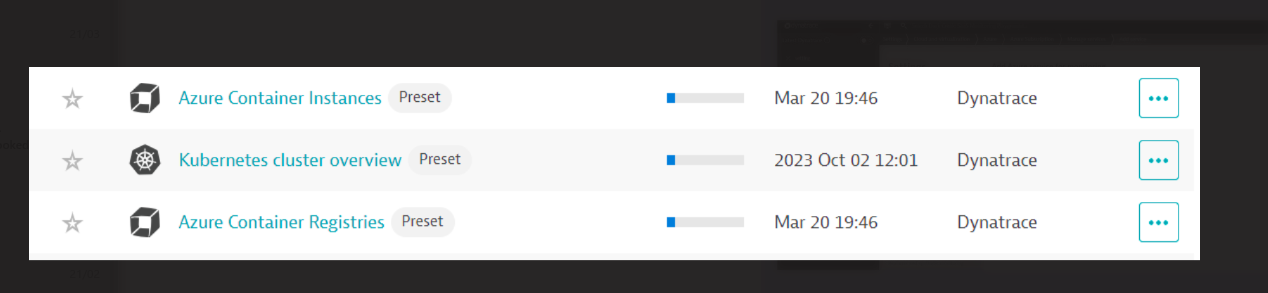
Once you add a service to monitoring, a preset dashboard for the respective service containing all recommended metrics is automatically created on your Dashboards page. You can look for specific dashboards by filtering by Preset and then by Name.
Conclusion
Setting up Azure Container Apps in Dynatrace for monitoring is a straightforward process that can greatly enhance your ability to manage and optimize containerized applications on the Azure platform. By following the steps outlined in this guide, you’ll be well-equipped to harness the full power of Dynatrace for monitoring your Azure Container Apps effectively. Stay proactive, stay optimized, and ensure the seamless operation of your containerized workloads with Dynatrace.