



Let’s face it: AI coding agents are merging PRs faster than ever, but your team’s review time hasn’t gone down – it has gone up. Harness 2026 says 81% of developers now spend more time in code review since AI adoption, and ~31% of that effort is completely invisible (no ticket, no tracking, just quiet burnout).
We needed a way to stop estimating review time by “gut feeling” and start using science. So I built a framework that turns code changes into hours – and finally makes the hidden work visible.
The CREST Master Formula
Here’s how CREST works, The AI Code Review Estimation Formula:

Where:
- ΔLOC_adj = weight‑adjusted lines of code
- R_base = base review speed (lines/hour)
- K_total = combined complexity factor (sum of risk weights)
- F_size = non‑linear penalty for large MRs
- T_research = time to learn new tech / specs
- T_overhead = session switching cost (because your brain isn’t a server)
1. Not all lines are equal (ΔLOC_adj)
|Change Type     | Coefficient | Explanation                  |
|----------------|-------------|------------------------------|
| Added lines	 | 1.0	       | Completely new code.         |
| Modified lines | 1.2	       | Need to understand old + new.|
| Deleted lines  | 0.5	       | Check for side‑effects       |
2. Base review speed (R_base) – pick your depth
- Deep Review (100% understanding): 120 lines/hour. (For Core logic, security, finance).
- Standard Review: 180 lines/hour. (For ordinary business features, not critical to understand every line inside each function/method)
- Sanity Check: 300–400 lines/hour. (Only check syntax, display errors, hard‑coded keys/config, simple checklists).
3. Combined Complexity Factor (K_total)
This factor is calculated as the sum of risk weights based on the presence of characteristics within the LOC, according to multiple criteria, standards, aspects, and proprietary formulas defined by each enterprise or project based on its business domain and technical requirements.
4. The non‑linear size penalty (F_size)
- F_size = 1.0, when ΔLOC_adj ≤ 500 (Normal size, no adjustment needed)
- F_size = 1.1, when 500 < ΔLOC_adj ≤ 800 (Large MR, cognitive load increases ~10%)
- F_size = 1.2, when ΔLOC_adj > 800 (Very large MR, should be split if possible)
5. Research time (T_research)
Fixed time for reading documentation, specs, or learning a new library/framework.If the reviewer has never touched Stripe API or Terraform, add those hours upfront. No shortcuts.
6. Overhead – the 50‑Minute Rule (T_overhead)
A meta‑analysis of 2,300 participants showed focus crashes after 40‑50 minutes. If your estimated T_total > 2 hours, split into sessions and add 15‑30 min warm‑up per 2‑hour block. We model this as T_overhead in the formula.
7. Golden safety thresholds (don’t ignore these)
- 400‑LOC Rule – SmartBear/Cisco & PropelCode (2025): PRs with 200‑400 lines detect 70‑90% of defects. Larger PRs = 40% more defects. If ΔLOC_adj > 400, split or apply F_size.
- Density trap – If a file averages >100 chars/line, ask for refactoring or add +0.2 to K_total.
- AI truthfulness – Never trust AI’s own explanation. Hallucinations are real (JetBrains 2026: 75‑80% not detectable by static analysis).
- Rush trap – Urgent tickets don’t mean skip steps. The multiplier buys carefulness, not speed.
8. Walk through a real example
Ticket: New Stripe payment flow + AWS Lambda + Terraform IaC.
- Added lines: 200 × 1.0 = 200
- Modified lines: 40 × 1.2 = 48
- ΔLOC_adj = 248
Factors:
- T_research = 4.0 hours (Stripe API + Terraform state)
- K_total = 1.7 (sum of complexity weights)
- F_size = 1.0 (248 ≤ 500)
- R_base = 120 (Deep Review)
T_code = (248 / 120) × 1.7 × 1.0 = 3.51 hours
T_overhead = ceil(3.51 / 2) × 0.25 = 0.44 hours
T_total = 3.51 + 4.0 + 0.44 = 7.95 → 8 hoursResult: ~8 working hours, including 4 hours of research and session overhead. Now you can explain to stakeholders why it takes that long – and protect your team from unrealistic deadlines.
9. My Real‑World Application
Guess what? I didn’t just leave CREST on a whiteboard. I actually took it into battle.
Today, CREST is running live in my daily workflow – estimating and measuring how much time and cost developers/reviewers truly need to understand 100% of AI‑generated changes. No more guesses, no more “should be fine” moments.
I even built a small application that collects, analyzes, calculates, and predicts real numbers using CREST. And after months of personal experimentation (plus countless tweaks, sighs of joy, and coffee breaks), CREST v2.0 – the version you see in this document – has become stable, reliable, and, frankly, quite amazing.
Below is a screenshot of the application showing CREST v2.0 in action for a real pull request / merge request.
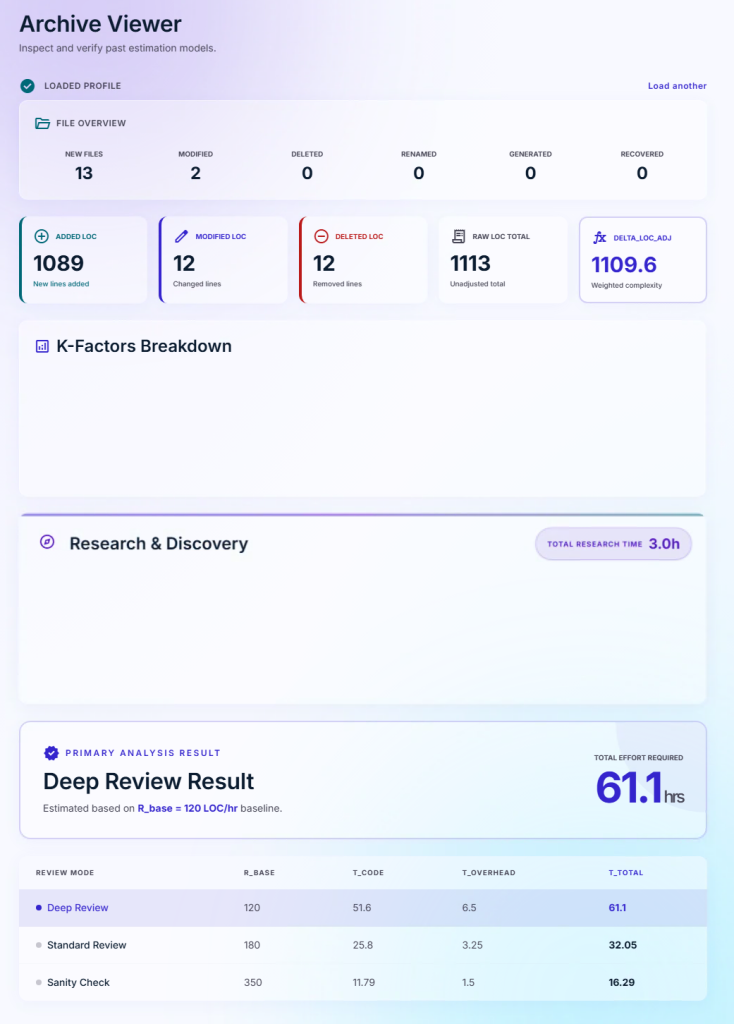
The interface and the actual values of K‑factors (K_total) and Research & Discovery (T_research) are blurred out for project privacy reasons.
Why this matters for 2026 onwards?
We are drowning in AI‑generated code. DORA 2025 found deployment stability drops -7.2% per 25% increase in AI adoption. The Arxiv 2026 showed that reviewers actually give less negative feedback to AI PRs with redundant code – a dangerous blind spot.
This framework isn’t about slowing down. It’s about measuring what matters so you can plan, negotiate, and improve without burning out your best people.