


In today’s data-driven landscape, businesses need robust tools to analyze and visualize their data effectively. Snowflake, a leading cloud data platform, combined with Power BI Service, a powerful business analytics service, offers an excellent solution for comprehensive data analysis and visualization. This guide will walk you through the steps to connect Snowflake to Power BI Service, enabling you to create dynamic and insightful dashboards.
Why Connect Snowflake to Power BI Service?
Combining Snowflake’s powerful data warehousing capabilities with Power BI Service’s comprehensive analytics and visualization features allows organizations to:
- Easily access and analyze large datasets.
- Create interactive and shareable dashboards.
- Make data-driven decisions with real-time insights.
Prerequisites
Before getting started, ensure you have the following:
- A Snowflake account with necessary permissions.
- Power BI Pro or Premium subscription.
- Administrator rights to install the Power BI Gateway.
- Power BI Desktop installed on your computer.
Step 1: Configure Snowflake
Create a Snowflake User and Role
Ensure you have a dedicated user and role in Snowflake with the necessary permissions to access the database and tables you want to connect to Power BI.
Whitelist IP Addresses
Whitelist the IP addresses used by the Power BI service to connect to your Snowflake instance. You can find the list of Power BI IP addresses here.
Step 2: Install and Configure the Power BI Gateway
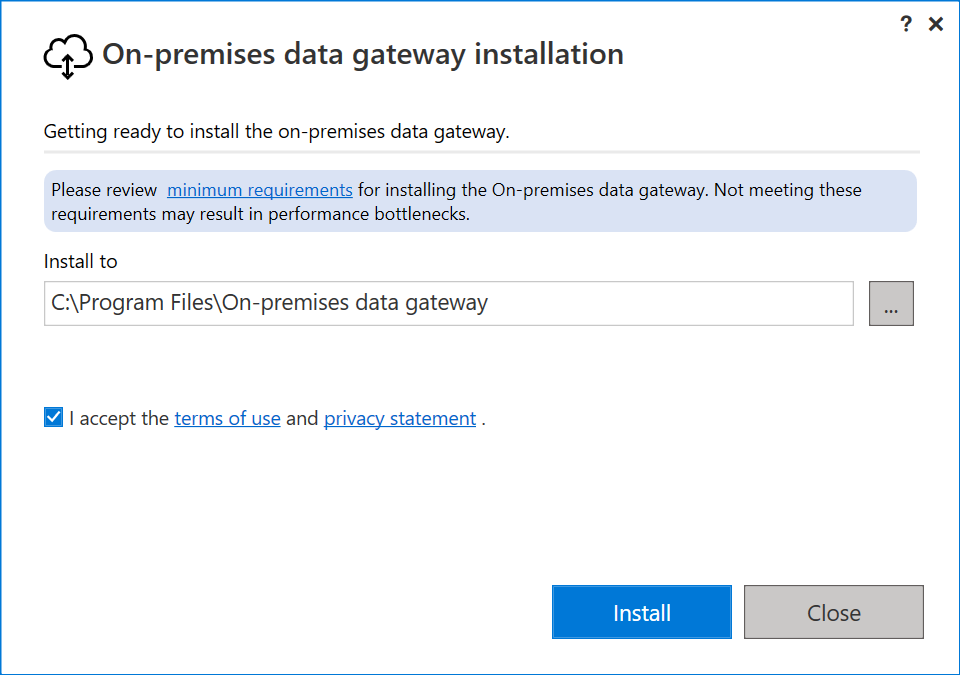
Download and Install the Power BI Gateway
- Go to the Power BI Gateway download page and download the latest version.

- Run the installer and follow the on-screen instructions to install the gateway.
Configure the Gateway
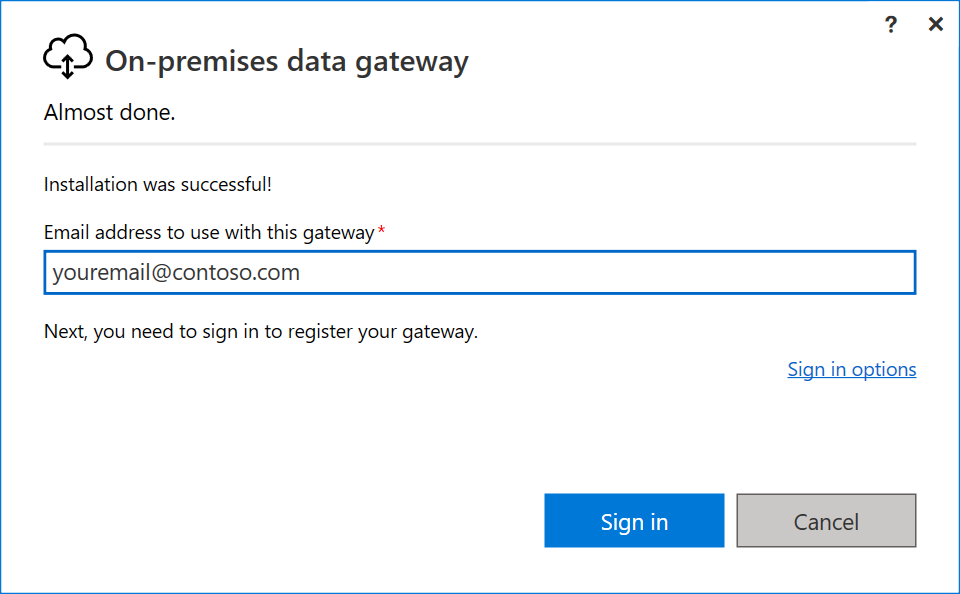
- After installation, launch the gateway configuration tool.
- Sign in with your Power BI account.
- Register a new gateway or take over an existing one.
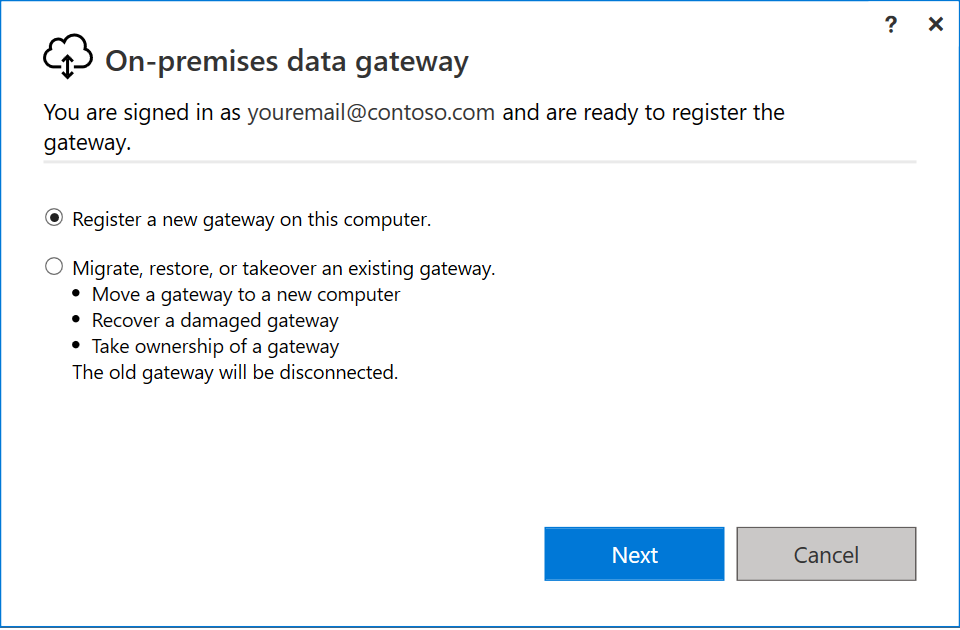
- Configure the gateway to connect to your Snowflake data source.

Step 3: Connect Power BI Desktop to Snowflake
Open Power BI Desktop
Launch Power BI Desktop on your computer.
Get Data
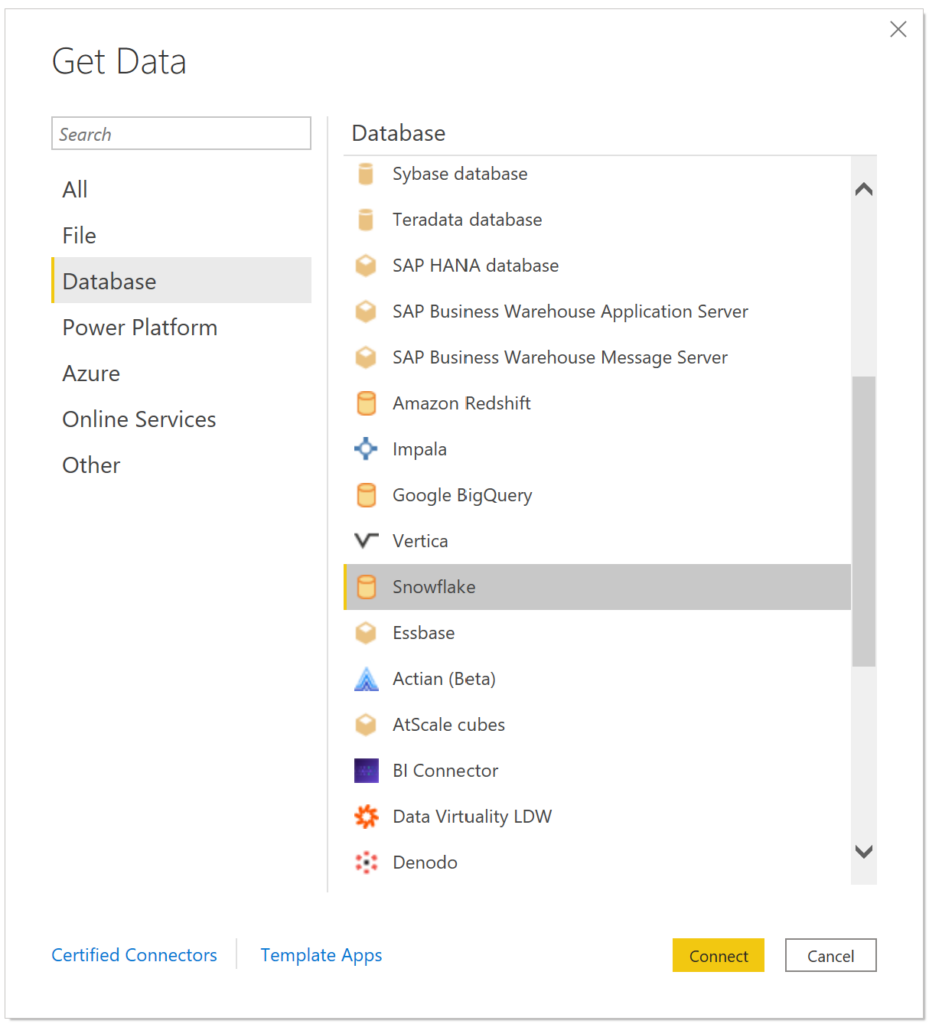
- Click on “Get Data” in the Home ribbon.
- Select “Snowflake” from the list of data sources.
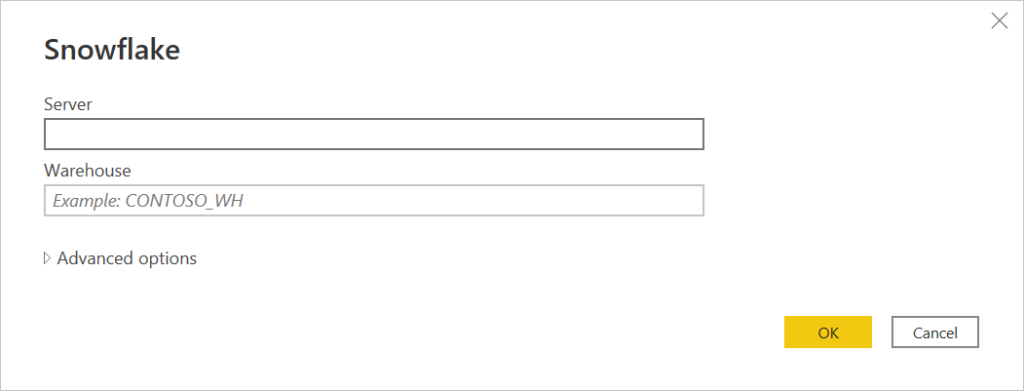
Enter Connection Details
- In the Snowflake connector window, enter the server name, warehouse, database, schema, and your credentials.
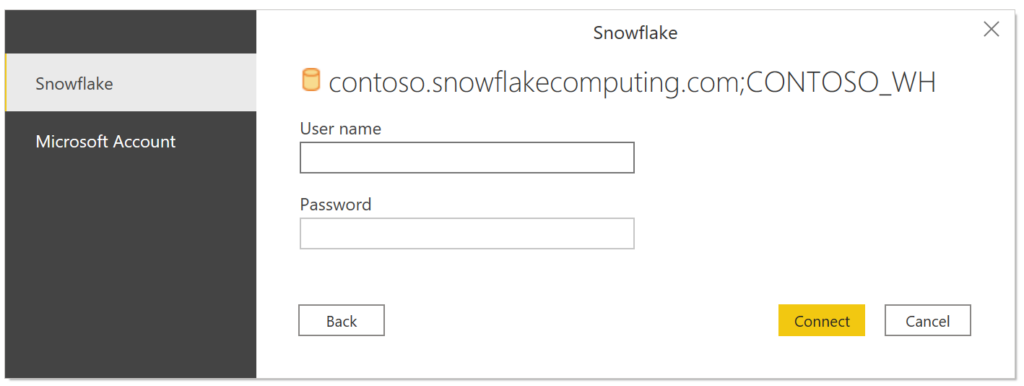
- Click “Connect” and select the tables or views you want to load into Power BI.
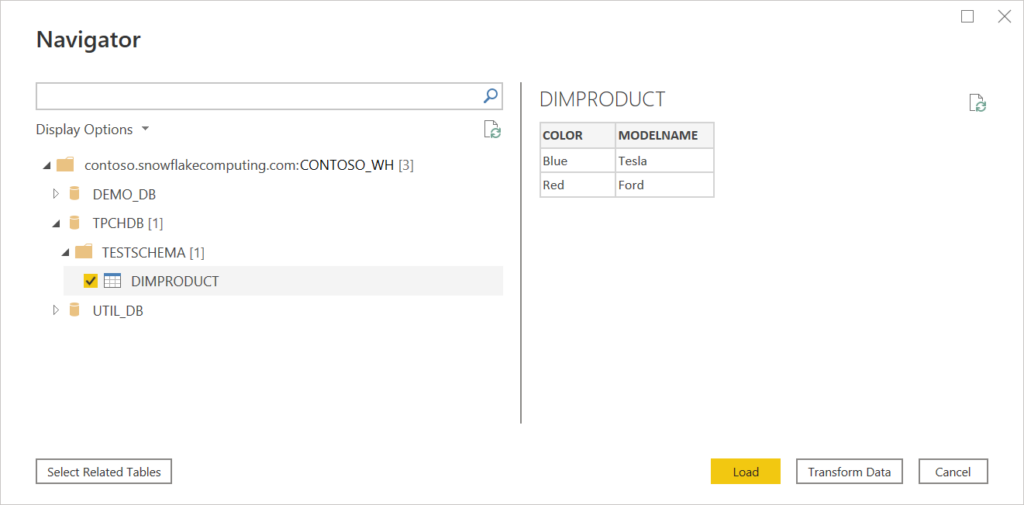
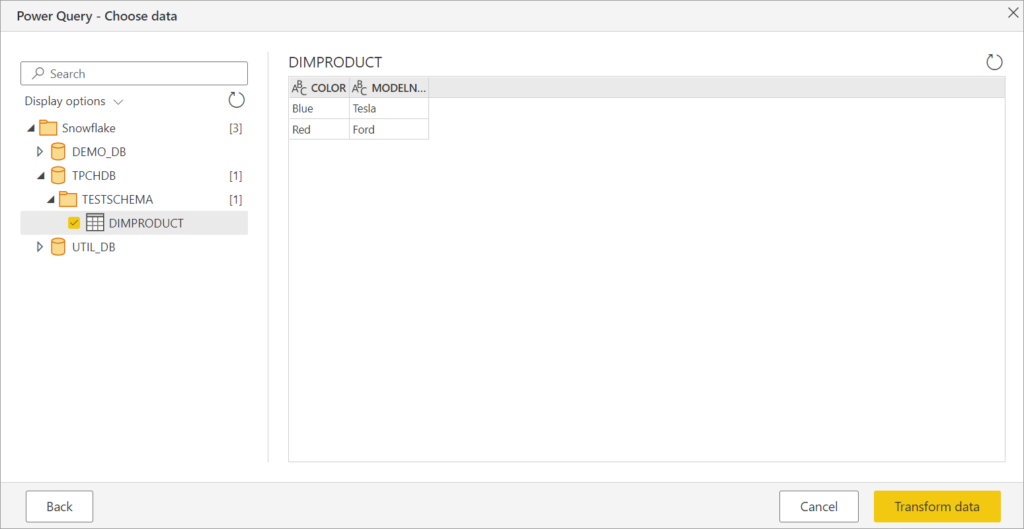
Load Data
Transform and clean the data as needed using the Power Query Editor and then click “Load” to import the data into Power BI.
Step 4: Publish to Power BI Service
Publish the Report
- Once your report is ready in Power BI Desktop, click on “Publish” in the Home ribbon.
- Sign in to your Power BI account if prompted.
- Select the workspace where you want to publish the report and click “Select.”
Configure the Data Source
- In the Power BI Service, go to the workspace where you published your report.
- Click on “Datasets” and find the dataset you just published.
- Click on the ellipsis (…) next to the dataset and select “Settings.”
- Under “Data source credentials,” click “Edit credentials” and enter your Snowflake credentials.
Step 5: Schedule Data Refresh
Configure Scheduled Refresh
- In the dataset settings, scroll down to “Scheduled refresh.”
- Turn on “Keep your data up to date” and configure the refresh frequency and time.
- Ensure the gateway connection is correctly configured to allow data refresh.
Additional Tips
- Data Security: Ensure that the connection details and credentials are securely stored and managed.
- Performance Optimization: Use Snowflake’s warehouse sizing and query optimization features to enhance the performance of your Power BI reports.
- Documentation: Refer to the official documentation for both Snowflake and Power BI for the latest updates and best practices.
Conclusion
Connecting Snowflake to Power BI Service unlocks the potential to leverage powerful data warehousing with advanced analytics and visualization capabilities. Follow these steps to create insightful, data-driven dashboards that can drive your business forward. Happy data analyzing!