


What is OpenTelemetry?
OpenTelemetry is an open-source project that provides a standardized way to collect telemetry data from your applications. It is vendor- and tool-agnostic, meaning that it can be used with a broad variety of Observability backends, including open source tools like Jaeger and Prometheus, as well as commercial offerings. It is a collection of APIs, SDKs, and tools. It combines two older projects, OpenTracing and OpenCensus, to create a unified standard for observability.

Key Components of OpenTelemetry
APIs and SDKs
These are tools that developers use to add telemetry data collection to their applications. OpenTelemetry provides these tools for many programming languages like Java, Python, Go, and JavaScript.
Instrumentation Libraries
These libraries automatically collect telemetry data from popular libraries and frameworks. For example, they can automatically gather data from web frameworks like Express (Node.js), Spring (Java), and Django (Python).
Collector
The OpenTelemetry Collector is a service that receives, processes, and exports telemetry data. It can be run as an agent (alongside your application) or as a gateway (a central service). The Collector helps manage and transform the data before sending it to a backend system for analysis.
Exporters
Exporters are components that send the collected telemetry data to various backend systems like Prometheus, Jaeger, Zipkin, and others. These systems store and help analyze the data.
OpenTelemetry Architecture
OpenTelemetry’s architecture is designed to be flexible and scalable. Here’s a simple overview of how it works:
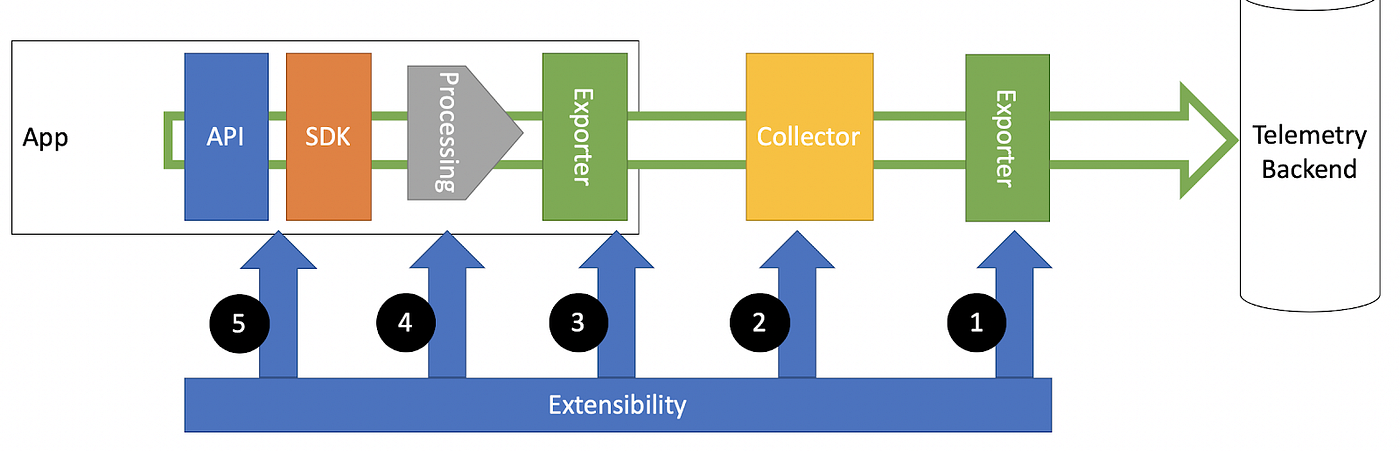
Instrumentation
This is the process of adding code to your application to collect telemetry data. You can do this manually using OpenTelemetry APIs or automatically using instrumentation libraries. This code creates spans (for traces) and metrics, and adds contextual information.
SDKs and Resource Detection
SDKs handle the collection of telemetry data. They also detect and attach resource information like the application name, version, and environment (e.g., production, staging) to the data.
Context Propagation
This ensures that trace context (trace IDs and span IDs) is passed across different services so that you can see the full journey of a request through your system.
Processing with the Collector
The Collector processes telemetry data, applying tasks like batching, filtering, and sampling before sending it to backends. It can run as an agent or a gateway.
Exporting Data
Exporters send the processed telemetry data to various backend systems where it can be stored and analyzed.
Signals/Three pillars
In OpenTelemetry, “signals” refer to the types of telemetry data that can be collected, processed, and analyzed to understand the performance and behavior of an application. The three primary signals in OpenTelemetry are traces, metrics, and logs. Each signal provides a different perspective on the system’s operation, and together, they offer a comprehensive view of the system’s health and performance.
1. Traces

Traces are used to capture the flow of requests as they move through various components and services within a system. Traces provide a detailed view of the execution path, making it easier to diagnose performance issues and understand dependencies.
Spans: The basic unit of a trace. Each span represents a single operation within a trace and includes information like the operation name, start and end times, and other metadata.
- Trace Context: Ensures that traces can be correlated across different services by propagating context (e.g., trace IDs and span IDs) along with requests.
Example Use Case: Traces can help you identify where a request is spending most of its time or which service in a microservices architecture is causing a slowdown.
2. Metrics
Metrics provide quantitative data about the performance and health of a system. They are typically collected at regular intervals and are used to monitor and alert on system behavior.

Types of Metrics:
-
- Counters: Measure the number of times an event occurs (e.g., the number of requests received).
- Gauges: Measure a value at a specific point in time (e.g., current memory usage).
- Histograms: Measure the distribution of values over time (e.g., request latency).
- Summaries: Provide percentile data for sampled observations (e.g., response time percentiles).
Example Use Case: Metrics can help you monitor resource utilization, such as CPU and memory usage, and set up alerts for abnormal conditions, like a sudden spike in error rates.
3. Logs

Logs are textual records of events that happen within a system. They provide a detailed account of what the system is doing at any given time, often including error messages, warnings, and other informational messages.
- Structured Logs: Use a consistent format (e.g., JSON), making them easier to parse and analyze.
- Unstructured Logs: Free-form text, which can be more flexible but harder to process automatically.
Example Use Case: Logs can help you troubleshoot issues by providing detailed context around errors and other significant events. For example, when an error occurs, logs can show you the exact state of the system leading up to the error.
Integration of Signals
OpenTelemetry aims to integrate these three signals seamlessly, allowing developers to correlate data across traces, metrics, and logs. This integration enhances the ability to diagnose and understand complex issues by providing multiple perspectives on the same events or performance anomalies.
Benefits of Using Signals in OpenTelemetry
- Holistic Observability: By capturing traces, metrics, and logs, you get a complete view of your system’s health and performance.
- Better Context for Troubleshooting: Correlating data from different signals helps in understanding the root cause of issues more effectively.
- Improved Performance Monitoring: Metrics provide real-time insights into system performance, while traces and logs help in detailed analysis and debugging.
- Scalable Monitoring: Signals can be aggregated and processed to monitor large-scale systems efficiently.
Benefits
Using OpenTelemetry provides several benefits that enhance your observability practices and overall system performance. Here are the key advantages:
1. Standardization
OpenTelemetry offers a standardized way to collect and process telemetry data. This consistency makes it easier to integrate with various observability tools and platforms, reducing the complexity and effort required to manage multiple, disparate systems.
2. Comprehensive Observability
By supporting traces, metrics, and logs—the three pillars of observability—OpenTelemetry provides a holistic view of your application’s performance and health. This comprehensive approach allows you to understand the full context of system behavior and interactions.
3. Vendor Neutrality
OpenTelemetry is designed to be vendor-neutral, meaning it can work with a wide range of backend systems and observability platforms. This flexibility allows you to choose the best tools for your needs without being locked into a single vendor’s ecosystem.
4. Enhanced Troubleshooting
With detailed traces, metrics, and logs, you can quickly identify and diagnose issues within your system. Traces help you pinpoint where latency or errors occur, metrics help you monitor system health and performance trends, and logs provide detailed event context for troubleshooting.
5. Automatic Instrumentation
OpenTelemetry offers auto-instrumentation libraries for popular frameworks and languages, which significantly reduce the manual effort required to collect telemetry data. This makes it easier and faster to implement observability in new and existing applications.
6. Scalability
The OpenTelemetry Collector can be deployed in various configurations (as an agent or gateway) to handle large volumes of telemetry data efficiently. Its scalable architecture ensures that you can manage observability data from applications of any size.
7. Community and Ecosystem Support
Being an open-source project, OpenTelemetry benefits from a large and active community. This collective effort leads to rapid development, regular updates, and a rich ecosystem of tools and integrations, ensuring that OpenTelemetry remains relevant and effective.
8. Better Resource Management
With detailed metrics and logs, you can track resource utilization over time, identify inefficiencies, and make informed decisions about scaling and resource management. This leads to better cost management and optimized performance.
9. Cross-Platform Support
OpenTelemetry supports a wide range of programming languages and platforms, making it suitable for diverse technology stacks. This cross-platform support ensures that you can implement observability across all parts of your system.
10. Future-Proofing
As an evolving standard backed by major industry players, OpenTelemetry is designed to adapt to future changes in the observability landscape. Adopting OpenTelemetry helps ensure that your observability practices stay current with industry trends and advancements.
Getting Started with OpenTelemetry
Here’s how you can start using OpenTelemetry:
- Choose Your Language and Libraries: Select the right SDKs and instrumentation libraries for your programming language.
- Instrument Your Application: Add OpenTelemetry code to your application. Use auto-instrumentation if available.
- Deploy the Collector: Set up the OpenTelemetry Collector to receive and process telemetry data.
- Analyze and Visualize Data: Use an observability platform to analyze and visualize the collected data.
- Iterate and Improve: Continuously monitor your application’s performance and make improvements based on the telemetry data.
Conclusion
OpenTelemetry is a game-changer in the field of observability. It provides a standardized, flexible, and comprehensive way to collect and process telemetry data. By adopting OpenTelemetry, you can gain deep insights into your applications, improve performance, and ensure reliability. Whether you’re developing new software or maintaining existing systems, OpenTelemetry helps you monitor, troubleshoot, and optimize effectively.