


Performance testing is an essential aspect of software development to ensure that web applications can handle expected loads without degradation in performance. Measuring end user experience has become an important part of performance testing. Almost all clients want to know not only how the server behaves (in terms of CPU, memory, network, etc) but also how the end user experience is. Unfortunately, most performance testing tools don’t support to measure the duration for frontend rendering. By combining JMeter for load testing and Selenium for browser automation, we can simulate real-world scenarios and evaluate the application’s performance under various conditions. In this comprehensive guide, we’ll explore in detail how to conduct performance testing by combining JMeter and Selenium.
1. Setting Up the Environment
Firstly, we need to install the necessary tools for implementing performance test.
- Install JMeter: we can download Jmeter from this url and easy install it on our computer
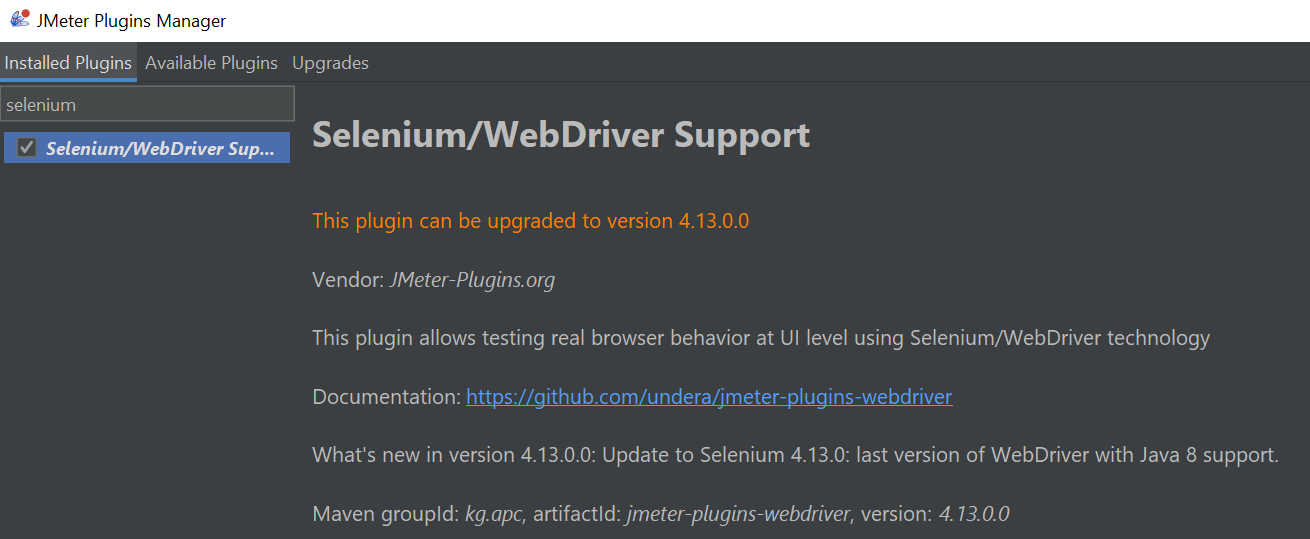
- Configure Selenium WebDriver in Jmeter: we need to install Selenium/WebDriver Support plugin, which allows us to simulate real behavior at UI level using Selenium/WebDriver technology Selenium WebDriver, into Jmeter. Please following this guide for installing the new plugin into Jmeter. After installing Selenium/WebDriver plugin, we can see it in the Installed Plugins tab.
- Download Chrome driver from this url and store it a specific folder
2. Create sample project
In this blog, we will perform a simple test case on the https://demo.guru99.com/v4/ site. The steps will involve logging in and recording the time when the user accesses the Change Password page. Please follow the following tutorial.
2.1 Create a Thread Group
Thread Group is the place we define the behavior of virtual users (threads) during the test. We can specify the number of threads (users) and the ramp-up period to simulate gradual load. We can add a new Thread Group by right click on the Test Plan and select the menu path Add > Threads(Users) > Thread Group.
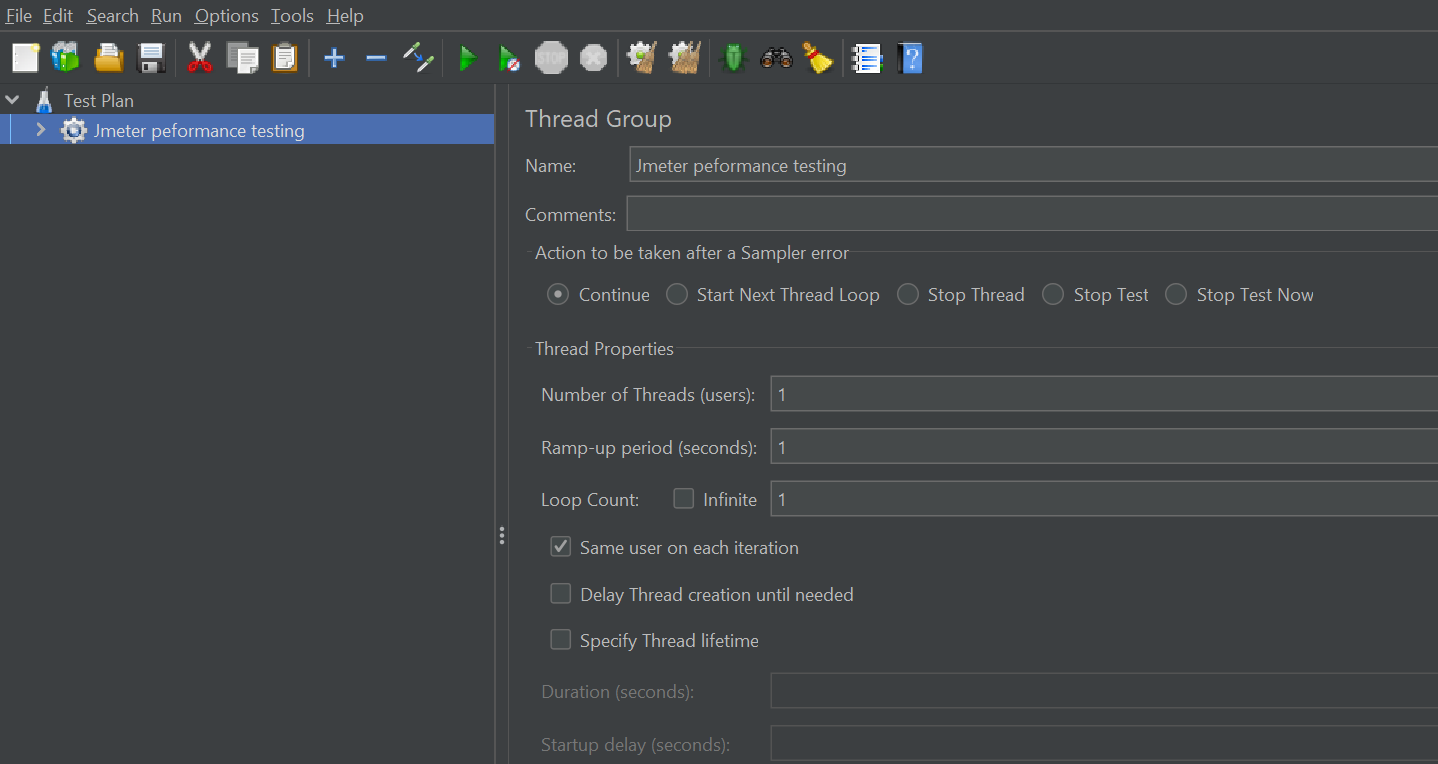
Based on the requirement, we can set adjust value of Number of Threads or Ramp-up period or Loop Count.
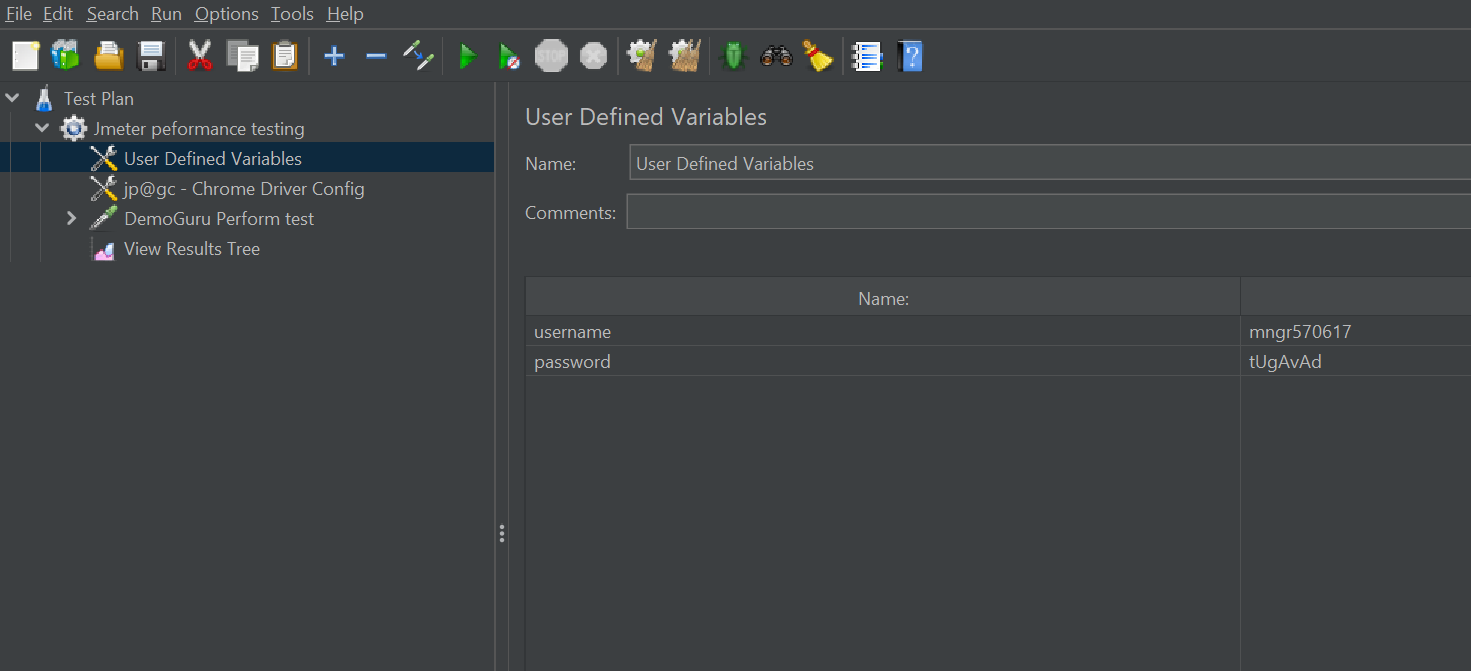
2.2 Define variables for storing the credential
In our test script, we’ll need the username and password for logging into the application. We can define the variables to hold these data by adding User Define Variables item through right click on the created thread group and select the menu path Add > Config Element > User Define Variables
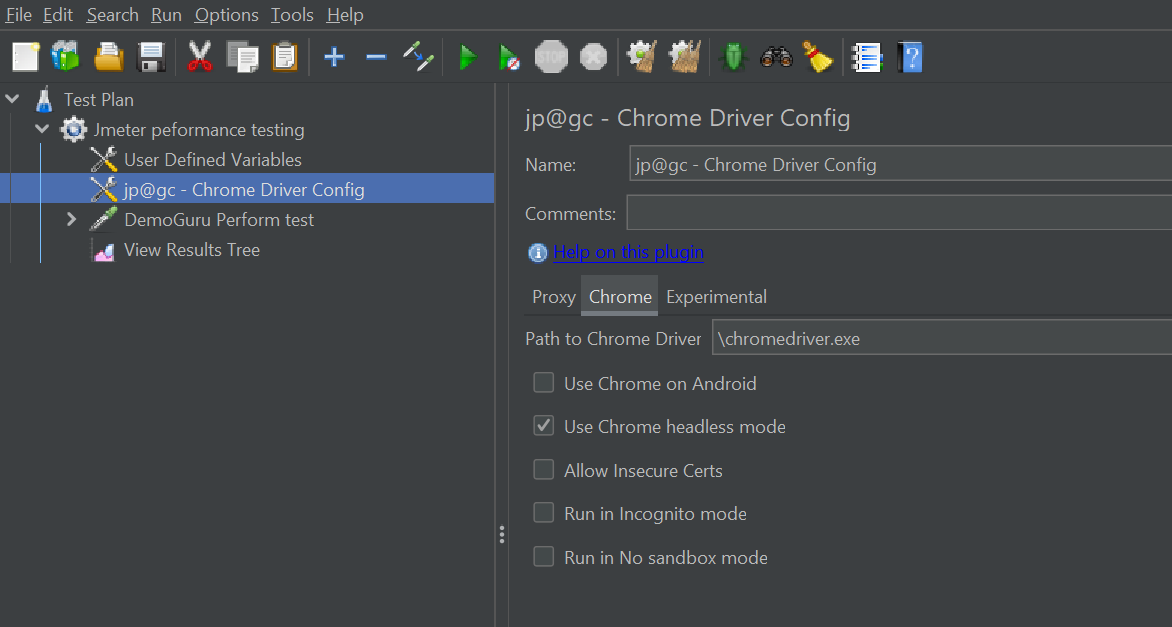
2.3 Add Chrome Driver Config to the Thread Group
It’s required to define the configuration for Chrome driver before executing the Selenium script. We can right click on the created thread group and select the menu path Add > Config Element > jp@gc – Chrome Driver Config. This allows us to set the path of Chrome Driver. Please set the correct path of the download ChromeDriver
2.4 Add Selenium script to the Thread Group
For adding the Selenium script, we’ll need to right click on the thread group and select the menu path Add > Sampler > jp@gc – WebDriver Sampler. The script will be implemented in Groovy. Please see the below sample script.
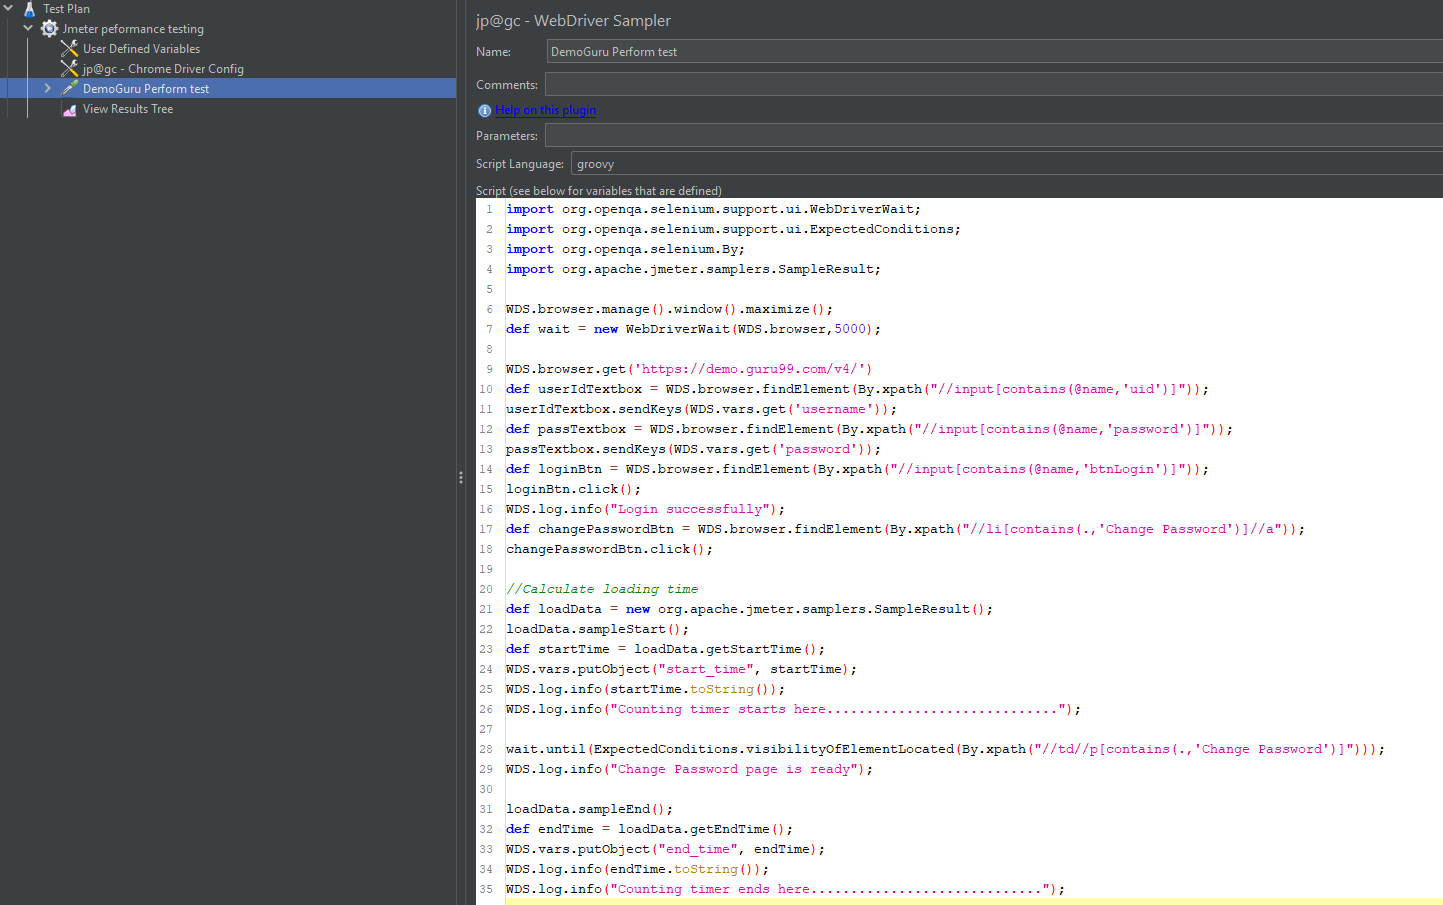
Inside the Script section, the Sampler automatically inserts a WebDriverScriptable object named WDS. This object provides the following properties for the scripter to utilize.
- WDS.parameters: The value provided in the Parameters field.
- WDS.args: Represents an array of strings supplied in the Parameters section, separated by spaces (‘ ‘). This enables the us to input multiple argument.
- WDS.log: enable the us to debug their scripts by logging information to the JMeter log file.
- WDS.browser: The Web Driver browser that has been configured for the us to interact with browser.
- WDS.sampleResult: This is used to log the start and end time for timing. Additionally, we can set the success or failure state on this object, and the SampleResult will be utilized by the JMeter reporting suite later.
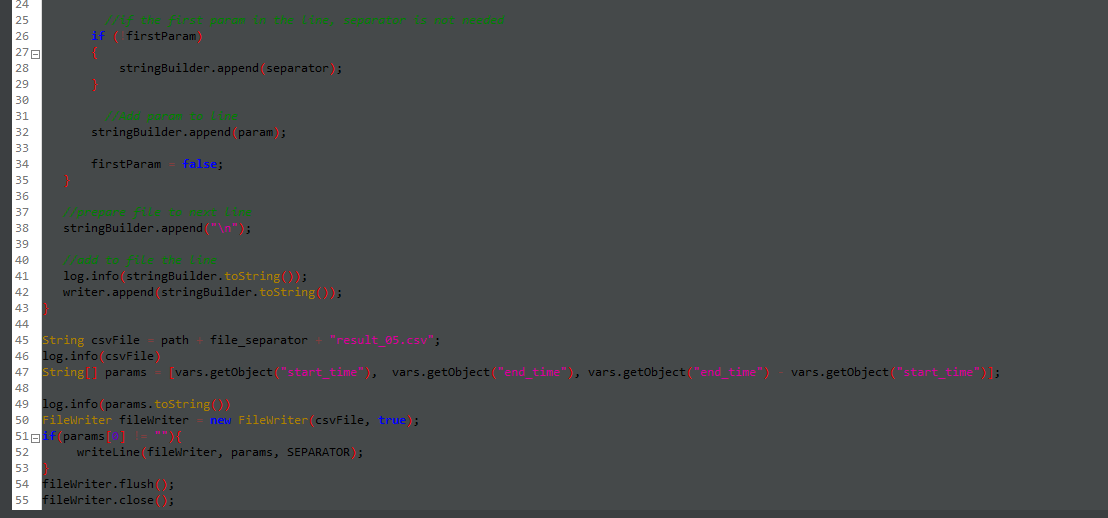
2.5 Write the test result into files
For writing the result into files, we need to add the Post Processing into the WebDriver Sampler by right click on the sampler and select the menu path Add > Post Processors > JSR223 Processor. This processor is useful for capturing performance metrics, logging data, or saving test results to a file.

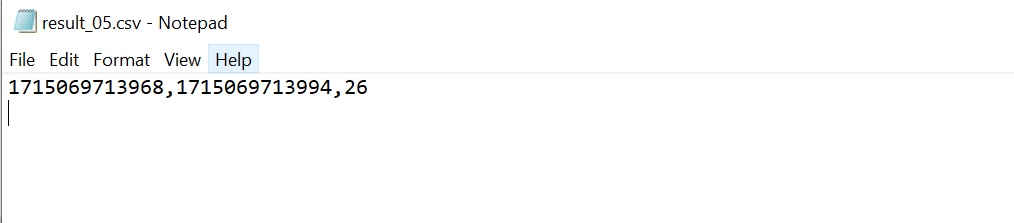
After applying this processor, we can have a report file as below.
Of course, we can add more useful information into this file.
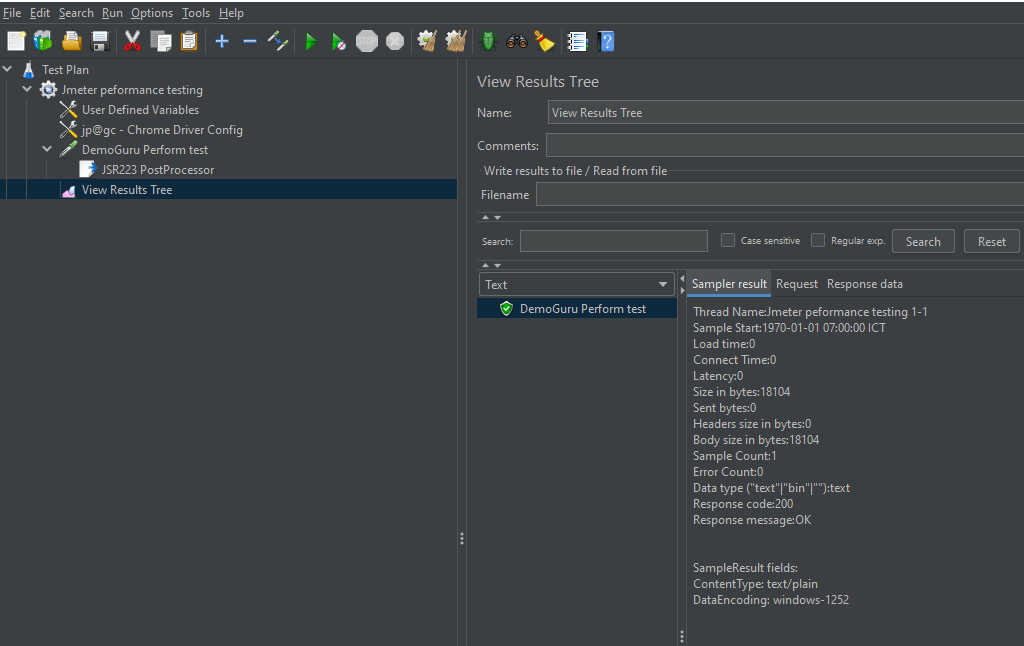
2.6 Add View Results Tree
View Results Tree listener can be used in JMeter to visualize and analyze test results. This listener provides detailed information on each request, including response times, throughput, and error rates. We can add it by right click on the Thread Group and select menu path Add > Listener > Virew Results Tree. After running test, we can have the result as below.
Conclusion
Although it will have some limitation in organizing or implementing the test script, but by combining JMeter with Selenium, we can effectively measure the loading time of web pages with a lot of concurrent users. This allows you to assess its scalability and performance under real-world conditions.