


Tables in Microsoft Dataverse serve as the backbone for data storage and management within the Power Platform ecosystem. Whether you’re building apps, creating reports, or analyzing data, understanding Dataverse tables and their relationships is crucial. In this blog, we’ll delve into the essentials of Dataverse data modeling, exploring common data models, table metadata, column types, and more.
Common Data Models
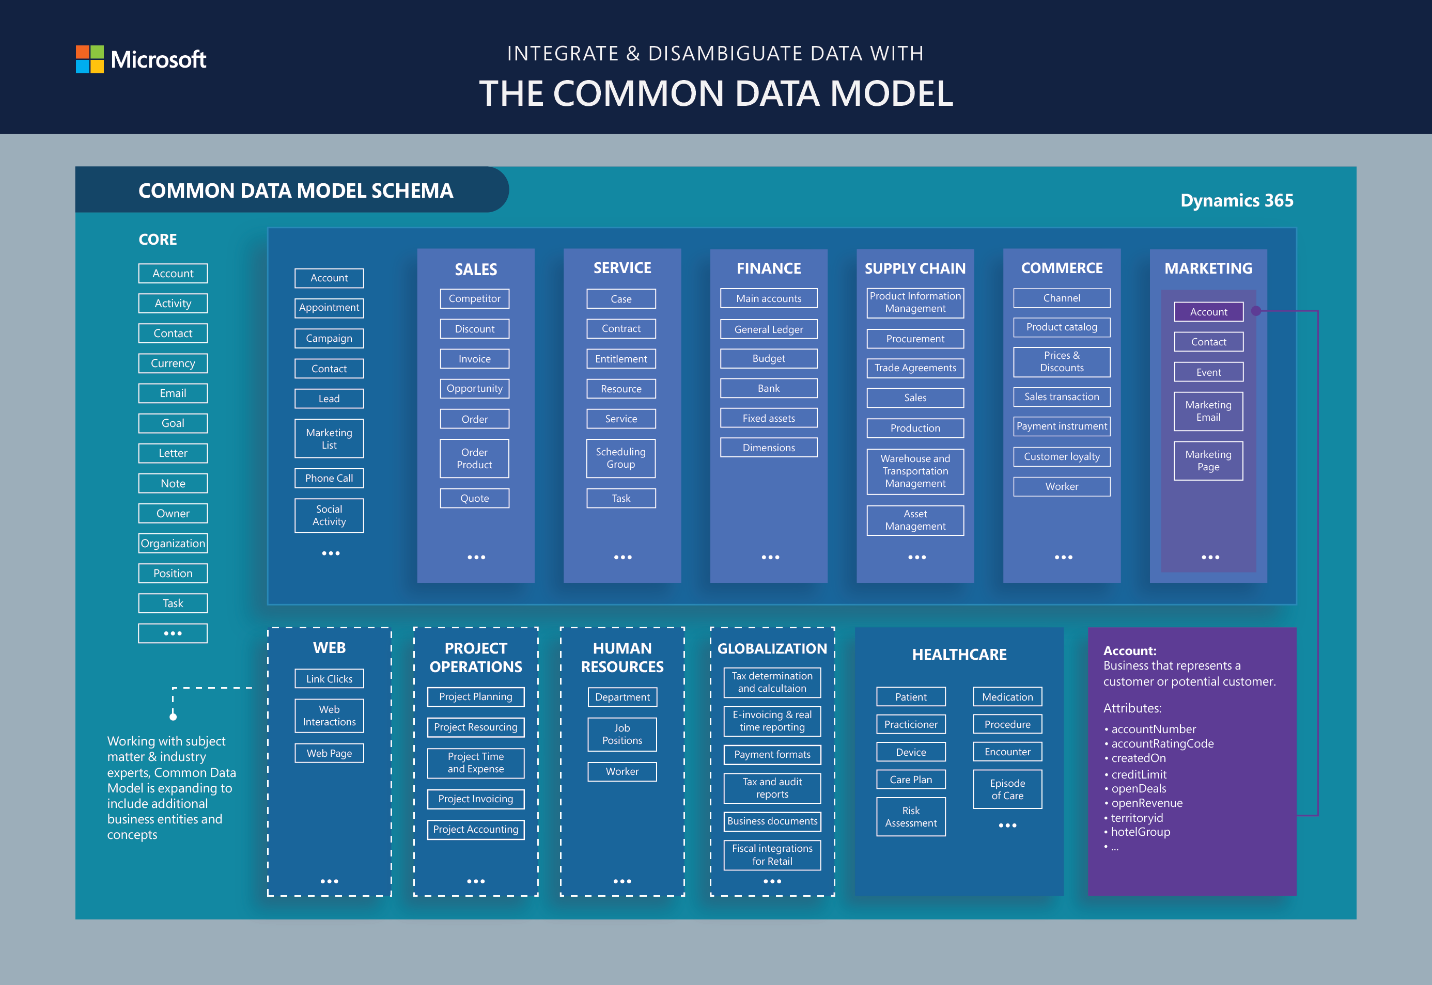
The Common Data Model (CDM) provides a shared data language across various applications like PowerApps, Power BI, Dynamics 365, and Azure. It simplifies data integration by offering predefined schemas, entities, and relationships. Microsoft Dataverse simplifies data management by allowing users to work with various types of data, like relational, non-relational, images, files, searches, or data lakes, without needing to understand the specifics. It offers different data types to help you build your model efficiently, with storage optimized for each type.
You can easily import and export data using tools like dataflows, Power Query, and Azure Data Factory. Customers using Dynamics can also use the Data Export Service.
Dataverse also integrates with Power Automate and Azure Logic Apps, which work with many other services. These services cover a wide range of sources, including Azure, Microsoft 365, Dynamics 365, SAP ERP, Salesforce, Amazon Redshift, Access, Excel, text/CSV files, SharePoint lists, SQL Server databases, Oracle, MySQL, PostgreSQL, Blockchain, and Azure Synapse Analytics.
Let’s explore the key components:
- Metadata System: Dataverse’s metadata system enables data sharing across applications. It includes standardized data schemas, semantic metadata, and relationships.
- Standard Entities: These predefined schemas cover commonly used concepts (e.g., Account, Campaign) to facilitate data creation and analysis.
Tables and Columns
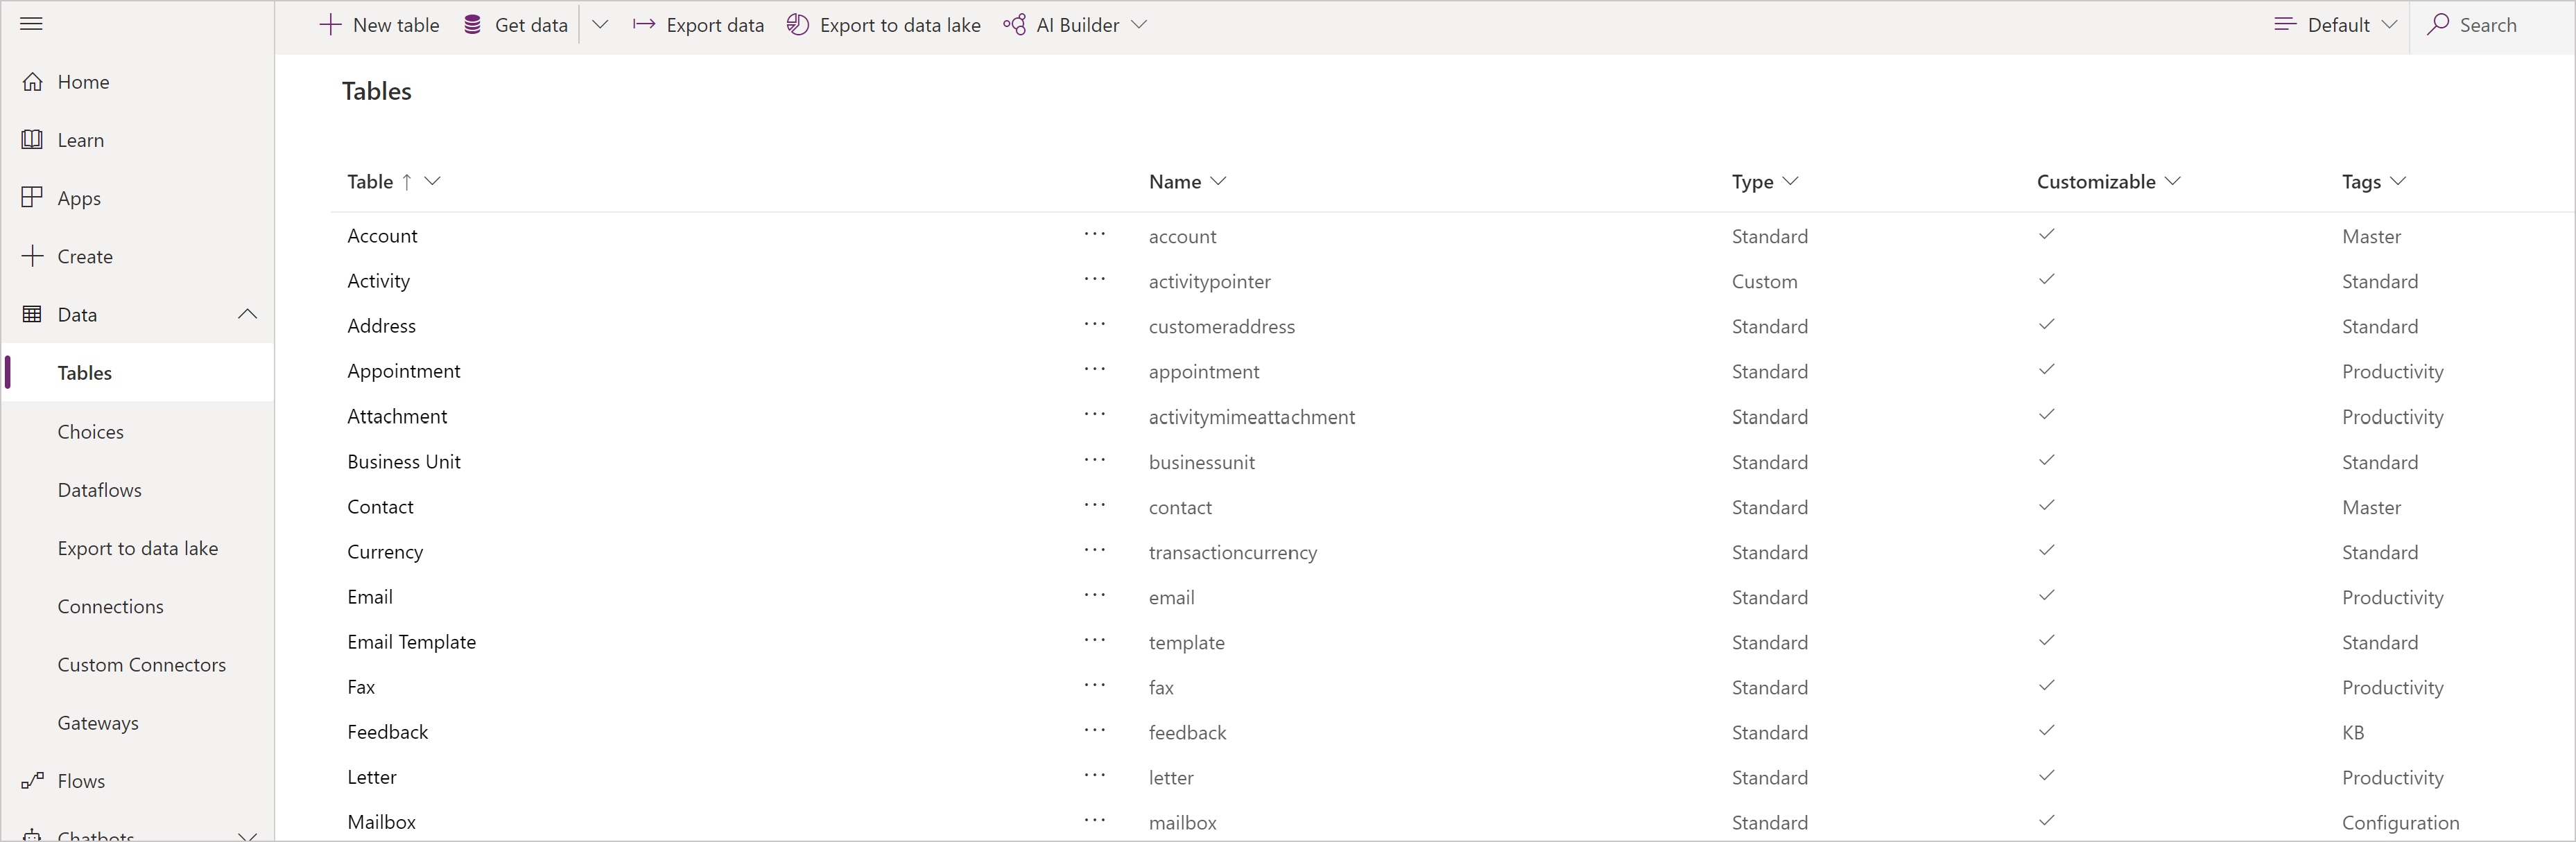
Tables
Dataverse tables define the data you want to track. They consist of rows (records) and columns (fields). Standard tables (e.g., Account, Contact) come out-of-the-box, while custom tables cater to specific scenarios.
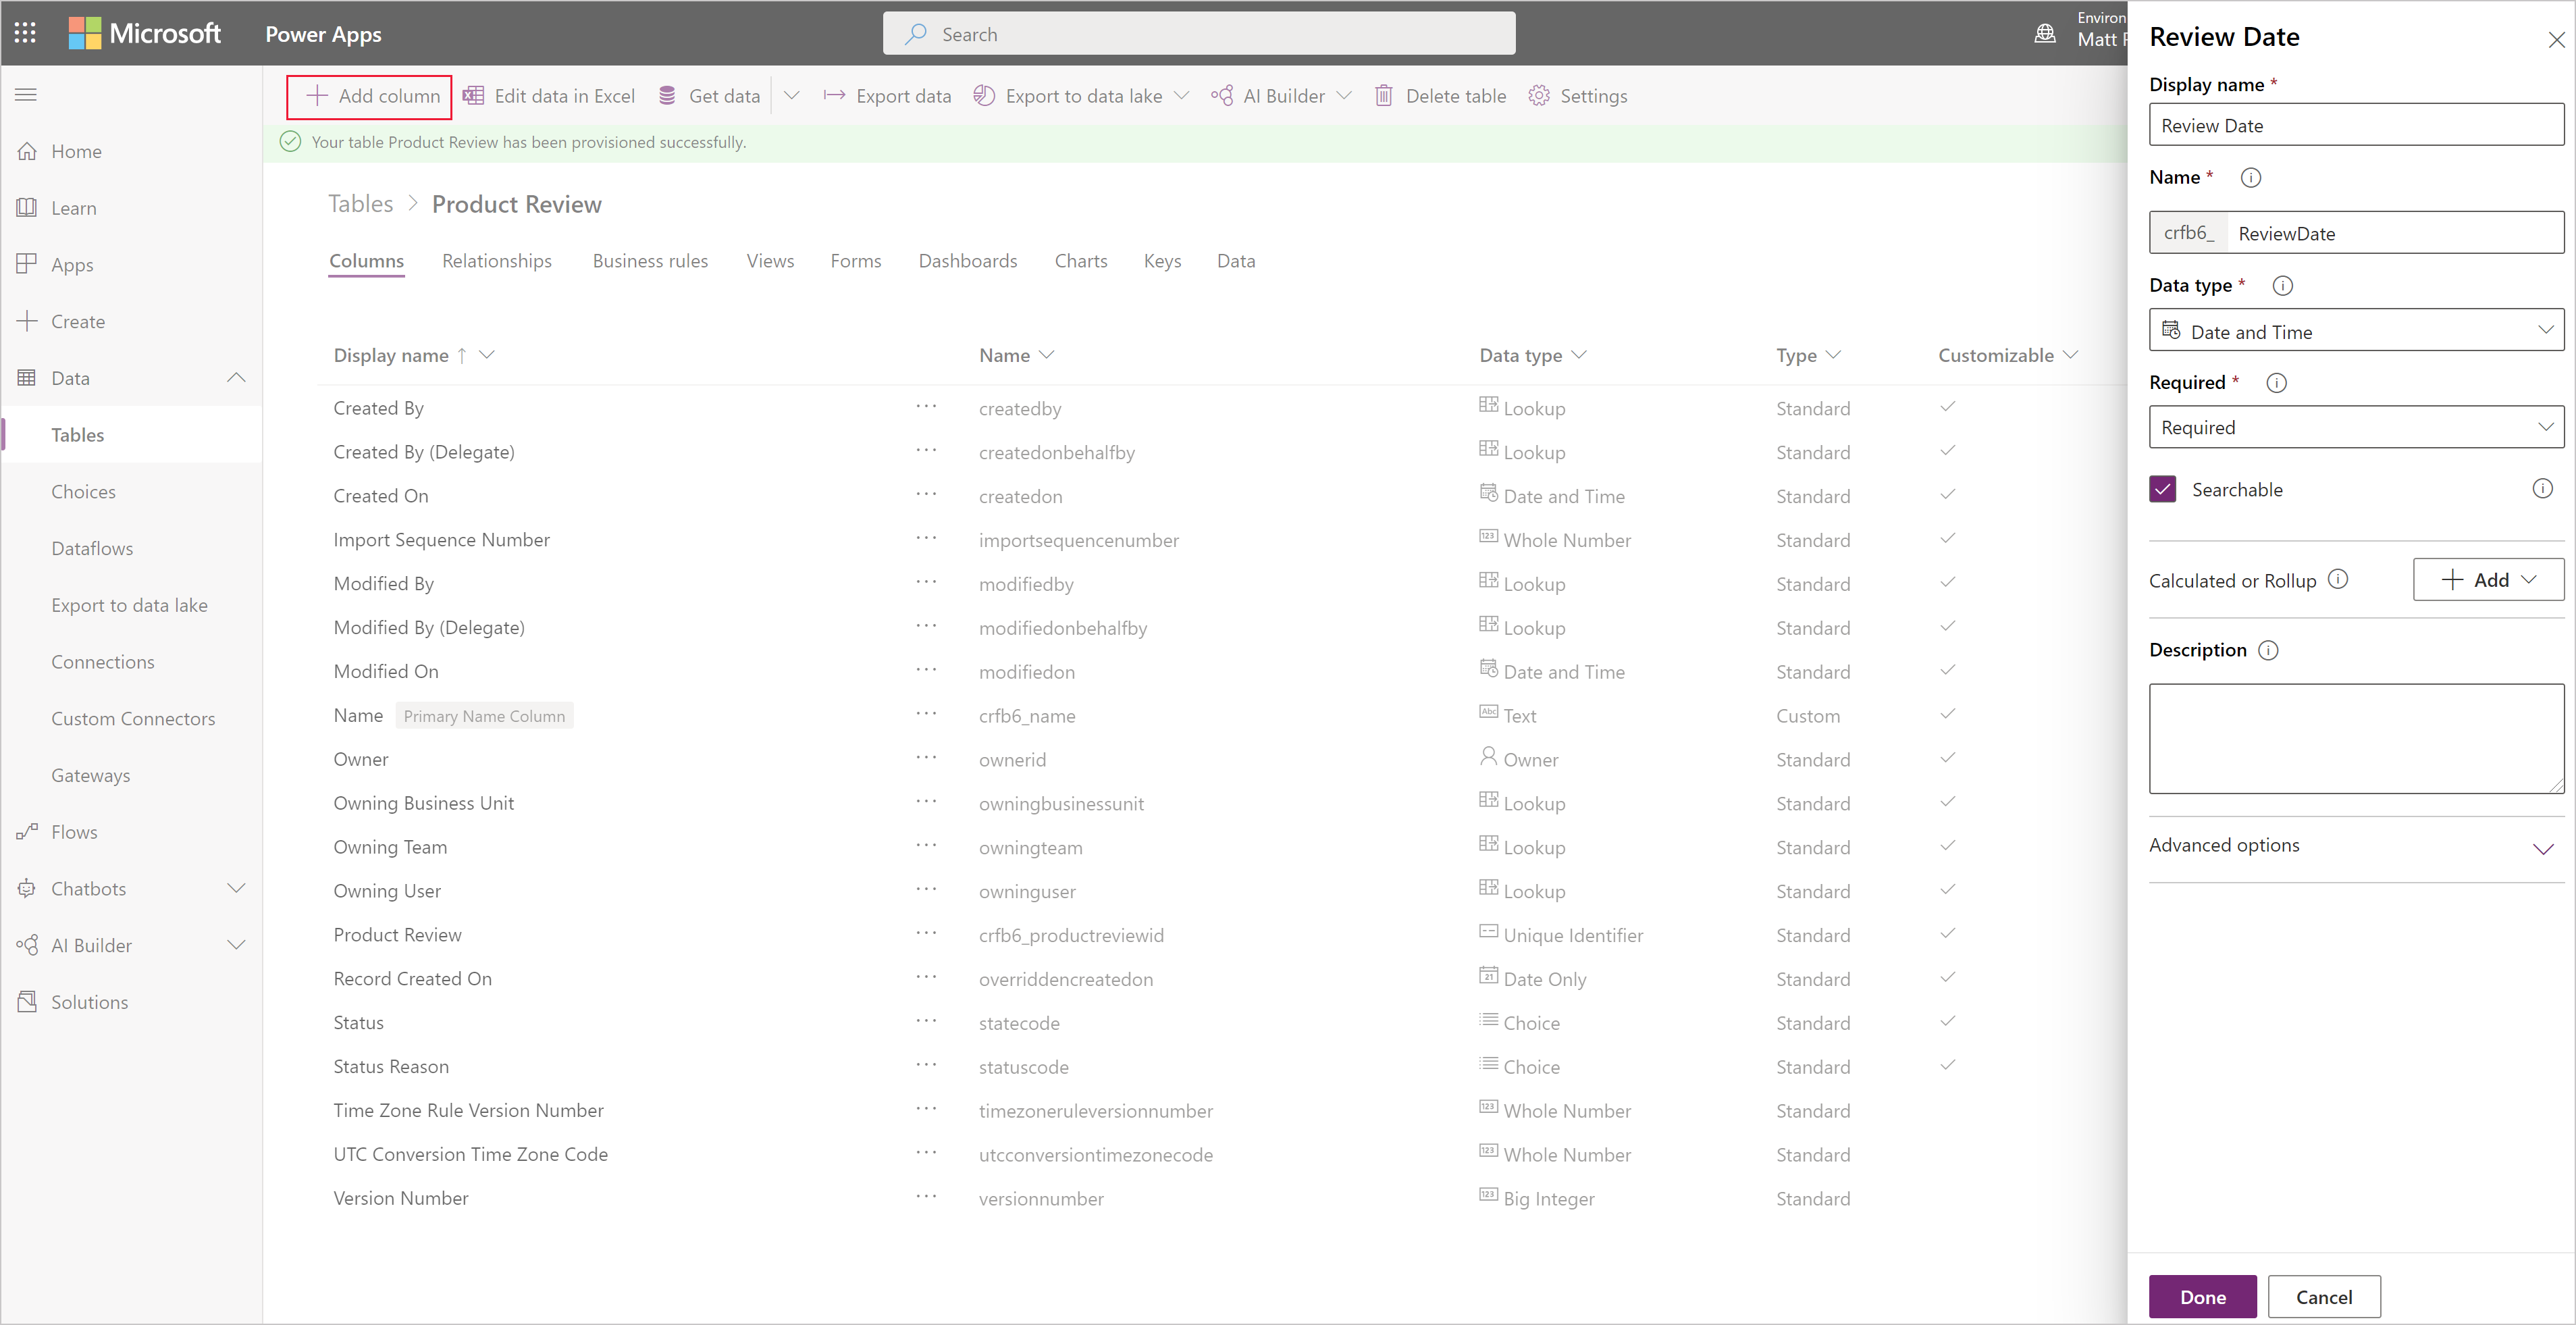
Column
Columns are what define the specific pieces of data stored within a table. If the existing standard tables lack columns that suit your needs, you can create new ones to capture the required data. Once you’ve created a new column, remember to include it in the relevant forms and views for the table to ensure its availability in your application.
Types of columns
Power Apps data type |
Solution Explorer type |
API type |
| Big Integer | Time Stamp | BigIntType |
| Choice | Option Set | PicklistType |
| Choices | MultiSelect Field | MultiSelectPicklistType |
| Currency | Currency | MoneyType |
| Customer | Customer | CustomerType |
| Date and Time | Date and Time Date and Time Format |
DateTimeType |
| Date Only | Date and Time Date Only Format |
DateTimeType |
| Decimal Number | Decimal Number | DecimalType |
| Duration | Whole Number Duration Format |
IntegerType |
| Single Line of Text Email Format |
StringType | |
| File | File | FileType |
| Floating Point Number | Floating Point Number | DoubleType |
| Image | Image | ImageType |
| Language | Whole Number Language Format |
IntegerType |
| Lookup | Lookup | LookupType |
| Multiline Text | Multiple Lines of Text | MemoType |
| Owner | Owner | OwnerType |
| Phone | Single Line of Text Phone Format |
StringType |
| Status | Status | StateType |
| Status Reason | Status Reason | StatusType |
| Text | Single Line of Text Text Format |
StringType |
| Text Area | Single Line of Text Text Area Format |
StringType |
| Ticker Symbol | Single Line of Text Ticker Symbol Format |
StringType |
| Timezone | Whole Number Time Zone Format |
IntegerType |
| Unique Identifier | Unique Identifier or Primary Key | UniqueidentifierType |
| URL | Single Line of Text URL Format |
StringType |
| Whole Number | Whole Number None Format |
IntegerType |
| Yes/No | Two Options | BooleanType |
Types of Tables
-
Standard Tables
- Included by default (e.g., Account, User).
- Customizable to fit your organization’s needs.
- Leverage these whenever possible to maintain compatibility with solutions.
-
Activity Tables
- Specialized for activity-based elements (e.g., appointments, emails).
- Owned by users or teams, not organizations.
- Time dimensions (start time, due date) play a crucial role.
-
Virtual Tables
- Populate data from external sources beyond Dataverse.
- Ideal for integrating external data seamlessly.
-
Elastic Tables
- Handle large datasets (tens of millions of rows).
- Powered by Azure Cosmos DB for scalability.
Table Relationships
Data in one table often correlates with data in another table. Table relationships establish how rows can be connected to each other within the Dataverse model.
Dataverse offers user-friendly visual designers to define various types of relationships between tables (or within a table itself). Each table can have relationships with multiple other tables, and each table can have multiple relationships with another table.
For instance, in the context of an Account table, the relationship types are:
-
N:1 (Many-to-one)
In this relationship, many records from table A can be linked to a single record in table B. For example, many students belong to a single classroom. Efficiently retrieve related data.
-
1:N (One-to-Many)
One-to-many: In this relationship, a single record from table B can be linked to multiple records in table A. For example, one teacher teaches multiple classes. Efficiently retrieve related data.
-
N:N (Many-to-Many)
In this relationship, each record in table A can correspond to multiple records in table B, and vice versa. It Requires a special Relationship table. It Allows multiple rows from two tables to associate with each other. For instance, students attend multiple classes, and each class can have multiple students.
Since many-to-one relationships are common, Dataverse provides a specific data type called “lookup.” This not only simplifies defining such relationships but also enhances productivity when building forms and apps.
Closure
Mastering Dataverse tables and relationships empowers you to build robust apps, reports, and analytics. Remember to leverage standard tables, customize where needed, and explore the rich possibilities of data modeling in Dataverse.