


In previous articles, we explored how Delta Lake enables modern insurance underwriting through:
- Processing telematics-scale data for Usage-Based Insurance (UBI)
- Data-driven risk segmentation
- Reconstructing historical underwriting decisions using Time Travel
- Building a unified risk profile for underwriters
- Modernizing legacy underwriting analytics with a Lakehouse architecture
A recurring theme across all these use cases is trust. Building a predictive underwriting model is only the beginning. The real challenge starts once the model reaches production.
Questions quickly emerge:
- Is the model still performing as expected?
- Have applicant behaviors changed?
- Are risk scores drifting over time?
- Can underwriting decisions be explained to regulators?
- Can a past prediction be reproduced during an audit?
These questions move the conversation from machine learning to ML governance. This is where Delta Lake becomes much more than a storage format. It becomes the foundation for an auditable, governed underwriting intelligence platform.
In this article, we examine how insurers can govern underwriting risk models using Delta Lake.
Why Model Governance Matters in Insurance?
Unlike recommendation engines or advertising systems, underwriting models directly influence:
- Premium pricing
- Risk acceptance
- Policy issuance
- Regulatory compliance
- Profitability
An underwriting model that silently deteriorates can have significant consequences. For instance, in 2023, the model was trained using:
- Historical claims
- Vehicle information
- Driver violations
However, by 2026:
- Driving patterns may have changed
- Inflation may have increased claim severity
- Fraud patterns may have evolved
Even if the model remains unchanged, the data distribution may no longer resemble training data. This phenomenon is known as model drift.
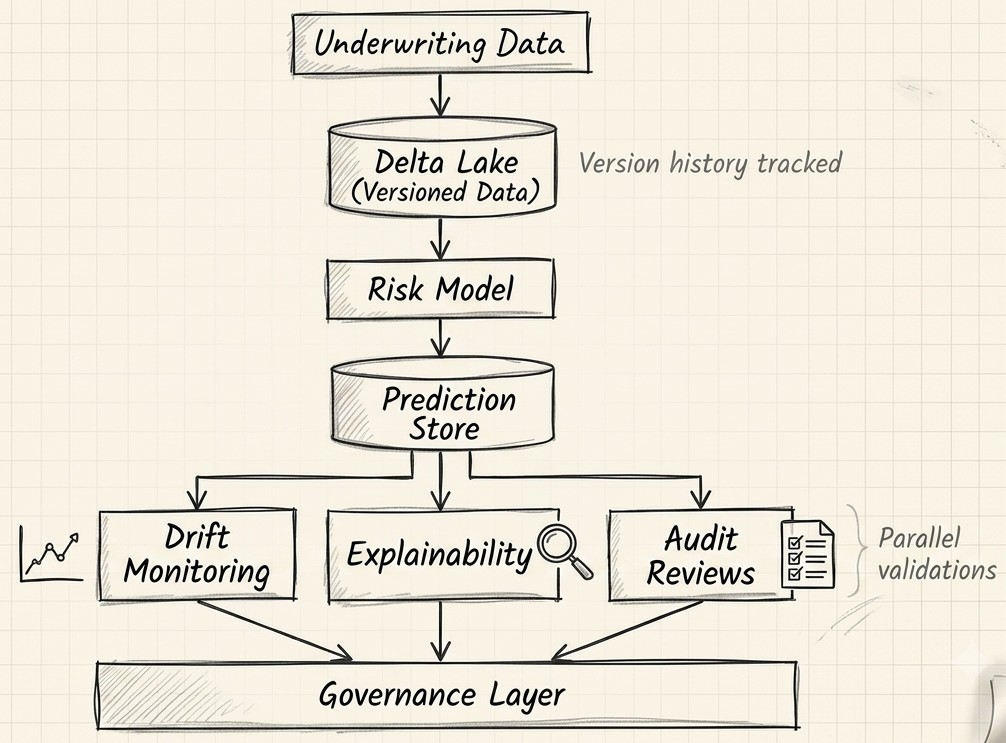
Underwriting Model Governance Architecture
A modern governance architecture typically looks like this:
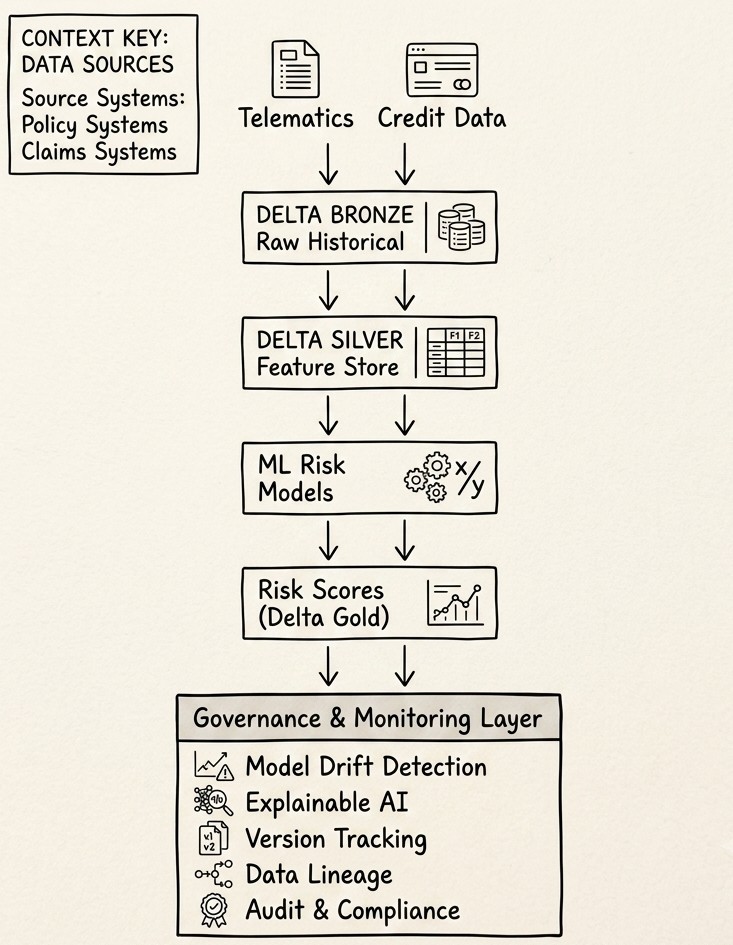
Note: Delta Lake serves as the persistent foundational layer connecting every stage.
Challenge #1: Model Drift Detection
Model drift occurs when incoming production data differs significantly from training data. For instance,
Training Dataset
Average Driver Age = 45
Average Credit Score = 720
Average Vehicle Value = $28,000
Production Dataset
Average Driver Age = 33
Average Credit Score = 660
Average Vehicle Value = $41,000
The model begins making predictions outside the distribution it learned from.
Solution: Capturing Production Features in Delta Lake
A common solution is storing every scoring event.
(
    scoring_df
    .write
    .format("delta")
    .mode("append")
    .save("/delta/risk_scores")
)
For instance:
| CustomerId | DriverAge | CreditScore | RiskScore | ScoreDate |
| C101 | 45 | 710 | 0.23 | 2025-01-01 |
| C102 | 29 | 640 | 0.67 | 2025-01-01 |
This creates a complete history of production predictions.
Detecting Data Drift
Using Delta tables, we can compare training distributions against recent scoring distributions.
from pyspark.sql.functions import avg

training = spark.read.format("delta").load("/delta/training_features")

production = (
    spark.read.format("delta")
    .load("/delta/risk_scores")
    .filter("ScoreDate >= current_date() - 30")
)

training_avg = training.select(avg("CreditScore")).first()[0]
production_avg = production.select(avg("CreditScore")).first()[0]

drift = abs(production_avg - training_avg)
Sample Output:
Training Credit Score Avg: 720
Production Credit Score Avg: 650

Drift = 70 points
A monitoring framework can automatically raise alerts when thresholds are breached.
Challenge #2: Monitoring Risk Score Stability
Even if raw features remain stable, model outputs may drift. For instance, consider this monthly trend:
| Month | Avg. Risk Score |
| Jan | 0.35 |
| Feb | 0.36 |
| Mar | 0.37 |
| Apr | 0.50 |
| May | 0.56 |
| Jun | 0.61 |
The sudden increase indicates:
- Data quality issues
- Economic changes
- Model degradation
Solution: Tracking Risk Scores with Delta Lake
Store every prediction.
risk_scores.write
    .format("delta")
    .mode("append")
    .save("/delta/risk_scores")
Create monthly trend reports.
SELECT
    YEAR(score_date) as yr,
    MONTH(score_date) as mn,
    AVG(risk_score) as avg_score
FROM risk_scores
GROUP BY yr, mn
ORDER BY yr, mn;
Sample Result:
| Month | Avg. Risk Score |
| Jan | 0.35 |
| Feb | 0.36 |
| Mar | 0.37 |
| Apr | 0.5 |
A governance team can immediately investigate the spike.
Challenge #3: Explainable AI for Underwriting
Insurance regulators increasingly expect decisions to be explainable. For instance, an underwriter may ask:
Why did Applicant A receive a risk score of 0.82?
Or,
Why was this policy referred to manual review?
Black-box responses are inadequate.
Solution: Capturing Feature Contributions
Example prediction:
{
    "customer_id": "C1001",
    "risk_score": 0.82,
    "top_factors": [
        {"feature":"prior_claims","impact":0.38},
        {"feature":"speeding_events","impact":0.25},
        {"feature":"credit_score","impact":0.12}
    ]
}
Store explanations alongside predictions.
explainability_df.write
    .format("delta")
    .mode("append")
    .save("/delta/explanations")
Now every prediction will contain business justification.
Challenge #4: Auditability
Auditors frequently ask:
Which exact dataset generated this underwriting decision?
Traditional data lakes struggle to answer this question, due to:
- Files may change.
- Tables may be overwritten.
- Historical snapshots may disappear.
Solution: Delta Lake Time Travel
Delta Lake maintains transaction history. For instance:
DESCRIBE HISTORY underwriting_features; Sample Output:
| Version | Timestamp |
| 142 | 2025-06-01 |
| 143 | 2025-06-02 |
| 144 | 2025-06-03 |
Retrieve features exactly as they existed during scoring.
historical_data = (
    spark.read
    .format("delta")
    .option("versionAsOf", 143)
    .load("/delta/underwriting_features")
)
This capability is especially powerful for compliance investigations.
Challenge #5: Lineage Tracking
A risk score often depends on dozens of upstream datasets. For instance:
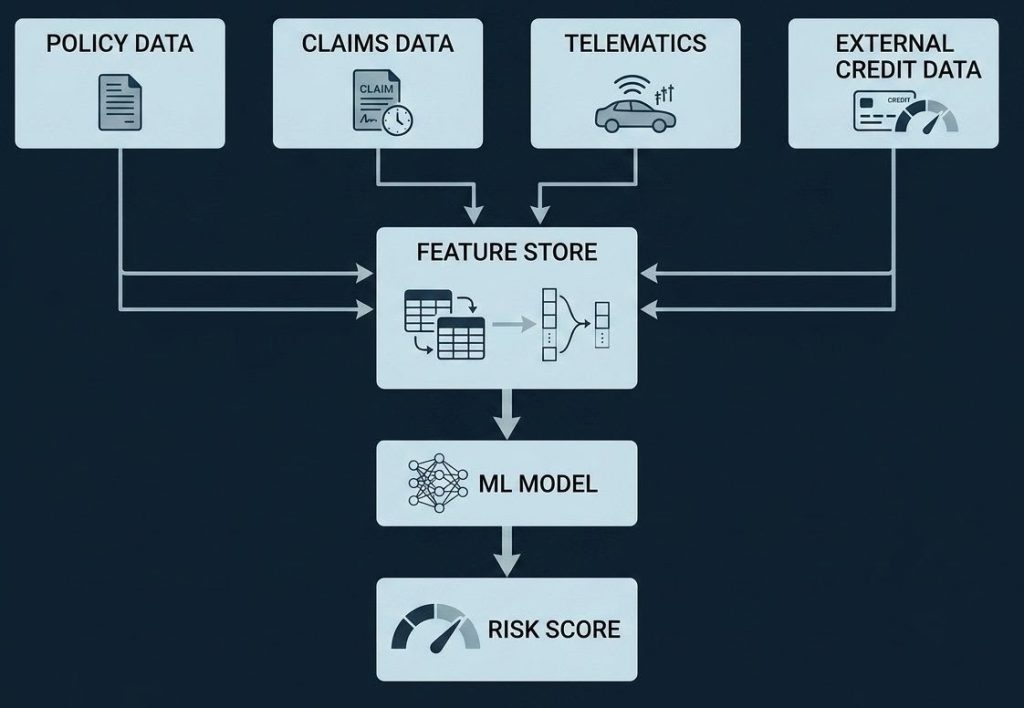
Without lineage:
- Root-cause analysis is difficult
- Compliance reviews take weeks
- Data quality issues become harder to isolate
Solution: Leveraging Delta Lineage
A governed lakehouse (like Delta Lake) can record:
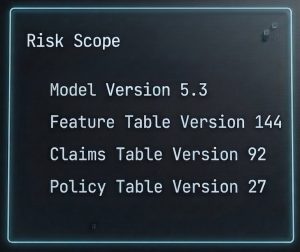
This establishes full traceability.
Governance Dashboard Example
Many insurers create operational dashboards around delta data. Example KPIs:
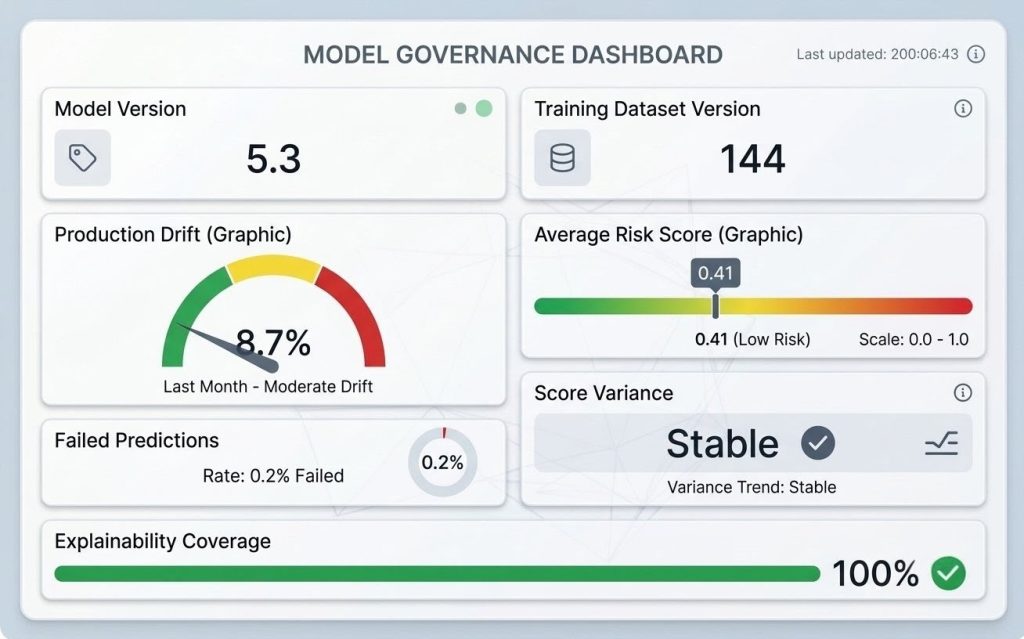
Such dashboards provide both technical and business stakeholders with visibility.
Bringing It All Together
A mature underwriting governance workflow may look like this:
In Summary
The insurance industry is increasingly dependent on machine learning for underwriting decisions. However, building predictive models is only part of the challenge. Sustaining trust in those models requires continuous governance.
Delta Lake provides several capabilities that make underwriting model governance practical at enterprise scale:
- Versioned datasets for reproducibility
- Time Travel for historical audits
- Lineage tracking for traceability
- Reliable storage of predictions and explanations
- Support for drift detection and monitoring frameworks
As insurers continue their transition toward AI-assisted underwriting, organizations that invest in governance early will be better positioned to satisfy regulators, explain decisions, and maintain confidence in their risk models.