


Analytics initiatives rarely fail because of technology. More often, they struggle because organizations begin building before they fully understand the business problem, stakeholder expectations, success criteria, and architecture requirements.
As discussed in our earlier article, “Why Analytics Projects Fail Before They Begin“, insufficient planning can derail even the most promising analytics investments.
Today, organisations face a different challenge.
They need to move faster.
Business leaders want analytics platforms delivered in weeks instead of months. At the same time, data teams are under pressure to evaluate requirements, design architectures, define KPIs, and estimate effort quickly while maintaining governance and quality.
Fortunately, planning does not have to be slow. This is where Datus Data Engineering Agent transforms the process. Instead of spending weeks in workshops, documentation exercises, and architecture meetings, teams can rapidly turn business requirements into actionable delivery plans.
In this article, we’ll explore how Datus enables AI-assisted analytics platform planning and accelerates the journey from idea to execution.
The Hidden Cost of Poor Planning
Consider a common scenario. A retail company approaches a data engineering team with a simple request:
We need better reporting.
At first glance, the request sounds straightforward. However, it immediately raises several important questions:
- What business decisions are difficult today?
- Which systems contain the required data?
- What reporting frequency is required?
- What KPIs matter most?
- Who owns the data?
- What compliance requirements exist?
Without answering these questions first, development teams risk building dashboards that nobody uses. As a result, organisations often experience:
- Scope creep
- Budget overruns
- Rework
- Misaligned stakeholder expectations
- Data quality issues
- Poor adoption
Ultimately, a few extra days spent planning can save months of redesign and rework later in the project.

Why Capturing Business Requirements Matters?
Every successful analytics platform starts with clearly defined business outcomes. Unfortunately, business requirements often arrive in the form of vague statements:
- We need customer analytics.
- We want better forecasting.
- We need executive dashboards.
- We want AI insights.
While these requests describe desired outcomes, they do not explain the underlying business challenge.
Therefore, teams need a structured way to translate business language into technical requirements. Datus helps bridge that gap by transforming broad requests into clear, measurable objectives.
Example
Input
We need to reduce customer churn.
Datus-Generated Requirements
Business Objective:
Reduce voluntary customer churn by 15%.

Decision Supported:
Identify customers likely to cancel.

Users:
Marketing team
Customer Success team

Required Data:
CRM
Subscription platform
Support tickets

Reporting Frequency:
Daily

Success Metrics:
Churn Rate
Retention Rate
Customer Lifetime Value
Output
business_goal: Reduce customer churn
target_improvement: 15%
stakeholders:
- Marketing
- Customer Success
data_sources:
- CRM
- Subscription Platform
- Support Tickets
kpis:
- Churn Rate
- Retention Rate
- CLV
refresh_frequency: Daily
As shown above, structured requirements provide clarity before development begins.
Translating Requirements into Technical Architectures
One of the most time-consuming activities during analytics planning is architecture design.
Business stakeholders think in terms of outcomes. Engineers, on the other hand, think about pipelines, storage layers, governance controls, and reporting platforms.
Because of this difference, translating requirements into technical solutions often takes significant effort.
Datus helps close that gap automatically.
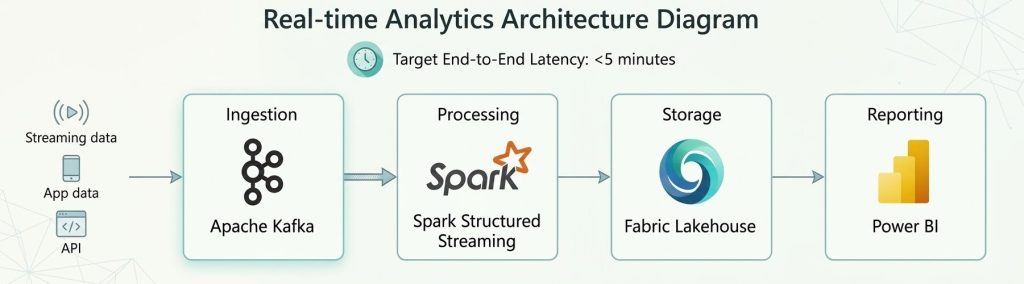
Business Requirement
Create real-time fraud monitoring dashboards.
To generate suitable recommendations, the platform evaluates:
- Data volume
- Velocity
- Security requirements
- Integration complexity
- Reporting needs
- Scalability expectations
Based on this analysis, Datus recommends architecture patterns that best suit the business objective.
Identifying the Right Stakeholders
Many analytics projects focus on technical stakeholders while ignoring business ownership. Consequently, teams often encounter delays during:
- Requirement approvals
- Data access requests
- KPI validation
- User acceptance testing
To avoid these bottlenecks, Datus automatically identifies the stakeholder groups required for project success.
Example
Business Goal
Improve supply chain visibility.
Recommended Stakeholders
| Stakeholder | Responsibility |
| Supply Chain Director | Business Sponsor |
| Operations Team | Process Validation |
| Data Engineering Team | Data Pipelines |
| BI Team | Reporting |
| Finance Team | Cost Analysis |
| Compliance Team | Governance |
As a result, critical stakeholders are involved from the beginning rather than being introduced late in the project.
Defining Metrics That Actually Matter
Many organisations track dozens of metrics. However, not all of them support meaningful business decisions. For this reason, Datus links business objectives directly to measurable KPIs.
Example
Objective
Reduce customer churn.
Datus Suggested KPIs
- Monthly Churn Rate
- Customer Retention %
- Net Revenue Retention
- Customer Lifetime Value
- Repeat Purchase Rate
Calculated KPI Example
customers_start = 10000
customers_end = 9500
new_customers = 500

retention_rate = (
    (customers_end - new_customers)
    / customers_start
) * 100

print(retention_rate)
Output (Meaning)
90% of customers were retained.
Therefore, dashboards remain focused on outcomes that directly support business decisions.
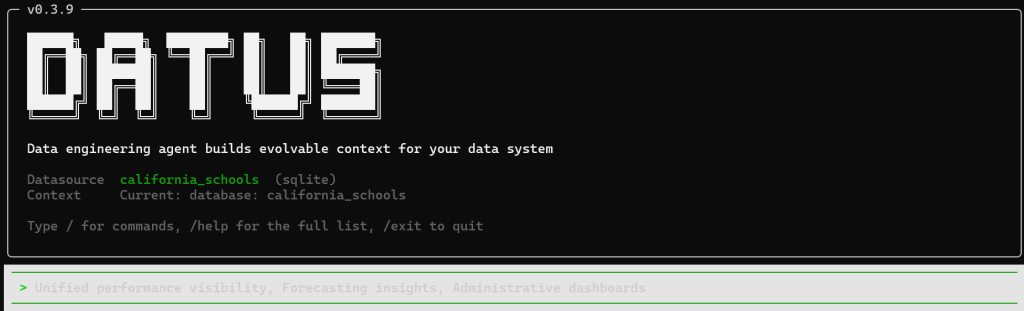
Example Use Case: School Analytics Modernization
To demonstrate the planning workflow, consider a school board that wants better visibility into performance and outcomes.
Step 1: Capture Business Requirements
Input:
- Unified performance visibility
- Forecasting insights
- Administrative dashboards
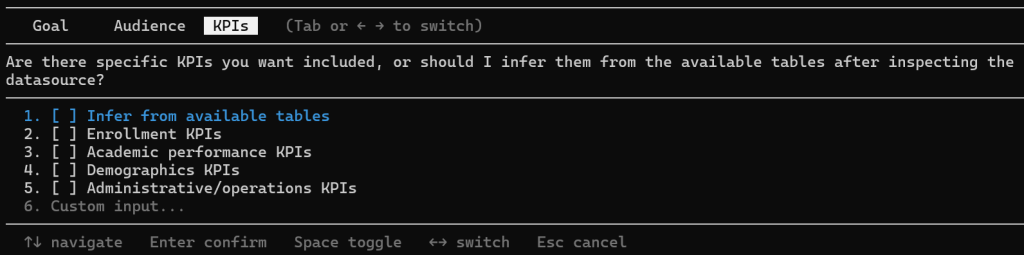
Datus identifies:
- Goals
- Audience
- KPIs
Step 2: Discover Data Sources
Next, the platform evaluates available data sources such as student systems, attendance records, assessment platforms, and administrative applications.
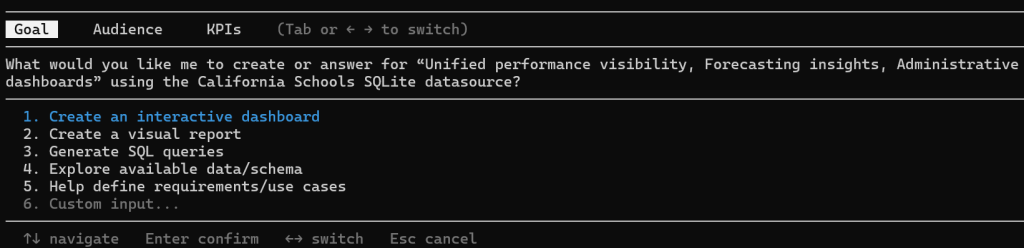
Step 3: Identify Goals
After reviewing the requirements, Datus maps desired outcomes to measurable success indicators.
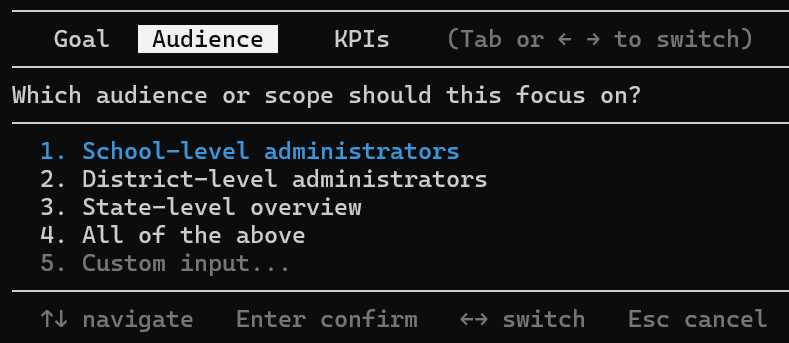
Step 4: Determine Scope
In addition, the platform creates an audience matrix that identifies who will use dashboards, reports, and insights.
Step 5: Define KPIs
Once stakeholder needs are understood, the solution recommends KPIs aligned with educational objectives.
Step 6: Create Planning Artifacts
Datus automatically produces:
- Goals
- Audience Matrix
- KPI catalogues
In-Summary
The difference between successful analytics initiatives and failed ones is rarely technology. Success begins with planning.
By helping organizations capture requirements, identify stakeholders, define KPIs, and evaluate data sources, Datus Data Engineering Agent reduces ambiguity and accelerates project readiness. Instead of spending weeks turning business ideas into technical plans, teams can use AI-assisted planning to create consistent, well-structured analytics blueprints in hours.
The result is faster delivery, better alignment, reduced risk, and analytics platforms that are designed around business outcomes from day one.