


1. Introduction
Nowadays, the development of LLM applications has increased rapidly. Everything changes so fast before we even realize it. Besides the development of LLM products, testing approaches for these AI products have also evolved rapidly to adapt and help build AI products more efficiently.
To perform high-quality testing for any LLM-based product, understanding evaluation metrics is a necessary skill that helps us evaluate AI products more accurately. This blog will introduce the reasons why understanding the metrics used in LLM testing is a good idea and will get started with basic metrics such as statistical scores.
2. It’s no longer just testing — it’s evaluation.
When we move from traditional testing to LLM testing, we face challenges that are very different from traditional testing. Existing strategies no longer work anymore. What are these challenges that we are facing?
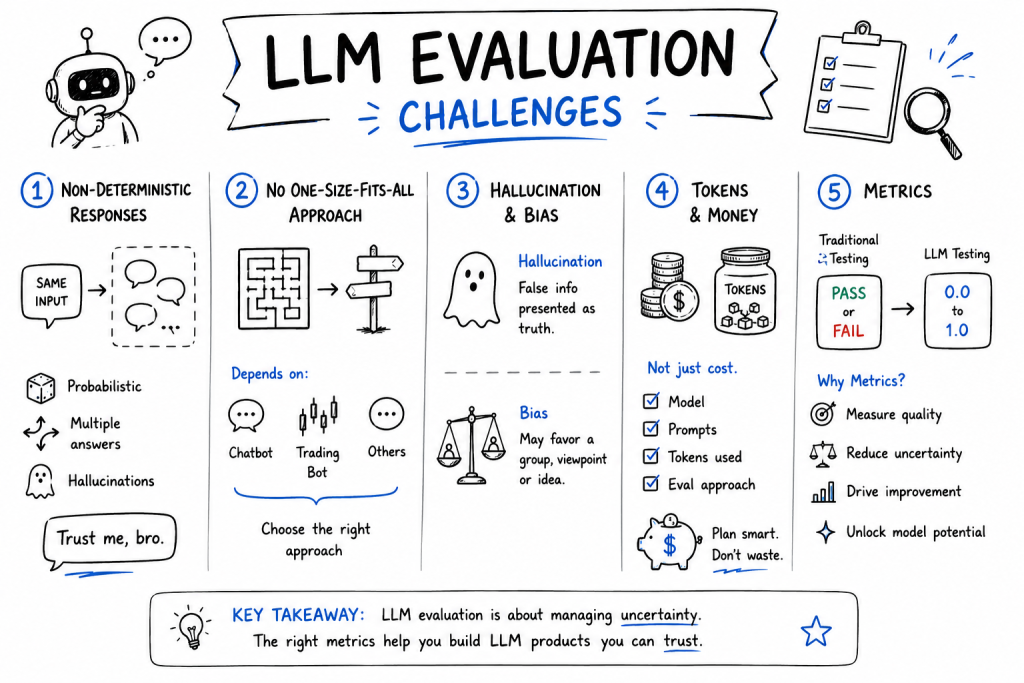
2.1 Non-deterministic responses
This is very clear in traditional software testing. You know exactly which button should be enabled, which message should be displayed, and which page the user should be redirected to. There is always one expected output or a predefined set of expected outputs for every action.
However, for LLM applications, the output can change every time we provide the same input. The probabilistic nature of LLMs allows them to generate multiple answers, and you cannot simply wait until one of them matches your expected behavior. Besides that, you also have to deal with hallucinations, where the response is completely incorrect and unusable.
2.2 No one-size-fits-all testing approach
Of course, traditional testing is not always the same. It depends on the purpose of the application. However, the overall pattern does not change much, and you can feel the repetition as you move across different projects. Performing functional testing, such as unit testing, integration testing, and UI testing, is always a core responsibility.
For LLM applications, especially at this early stage, we cannot assume what lies ahead. Based on the application’s functionality—whether it is a chatbot, an AI trading bot, or something else—you can decide from there which approach to use to evaluate your application more accurately.
2.3 Hallucination & Bias
Hallucination and bias are risks you have to face when testing LLM applications.
For bias, the answer is not simply incorrect; it may look perfect at first, but it actually favors a particular group, viewpoint, or idea based on the data the model was trained on. As a result, it can reproduce and provide misleading or potentially dangerous ideas.
Hallucination is different. It is often more dangerous because the model can generate information that is completely false while presenting it as if it were factual.
2.4 Tokens and Cost
It is not just about the expense. The issue is not simply that testing costs a lot. Although this part is difficult, it is inevitable and easy to understand. The real challenge is estimating the resources you need when preparing your testing plan and budget.
Every test, the model you use, the prompts, the tokens consumed, and the evaluation approach all need to be considered carefully if you do not want to waste tokens and money on unnecessary testing.
2.5 Metrics
The final challenge, and from my perspective also the key to addressing all the difficulties and questions above, is metrics.
When testing a traditional application, a feature is evaluated against its expected behavior, and the result is usually either pass or fail.
Testing LLM applications is not simply a matter of 1 or 0. Instead, it is between 0 and 1. This is where evaluation comes in. You need to determine whether your LLM application is good enough or whether it needs better performance by using a score between 0 and 1 to prove the correctness of your evaluation. That score is what we call a metric.
Most of the other challenges come from the uncertainty you face when testing LLM applications. In many cases, that uncertainty can be addressed by evaluating the application using a proper combination of metrics, allowing you to assess its performance more clearly. This is where you can unlock the magic behind the models.
3. What are the categories of evaluation metrics?
The metrics can be categorized in many ways, depending on the criteria we use. One common way is to categorize them based on the evolution of LLM evaluation.
Before LLMs, we had traditional NLP, where reference-based metrics such as statistical scorers were developed to automatically evaluate model outputs against reference answers. Later, reference-free metrics were introduced to evaluate outputs more independently, without relying on reference answers. As LLMs have advanced rapidly, more practical metrics have emerged, such as Answer Relevancy, Correctness, and Hallucination detection. Most notably, LLM-as-a-Judge has made evaluation much more convenient and scalable.
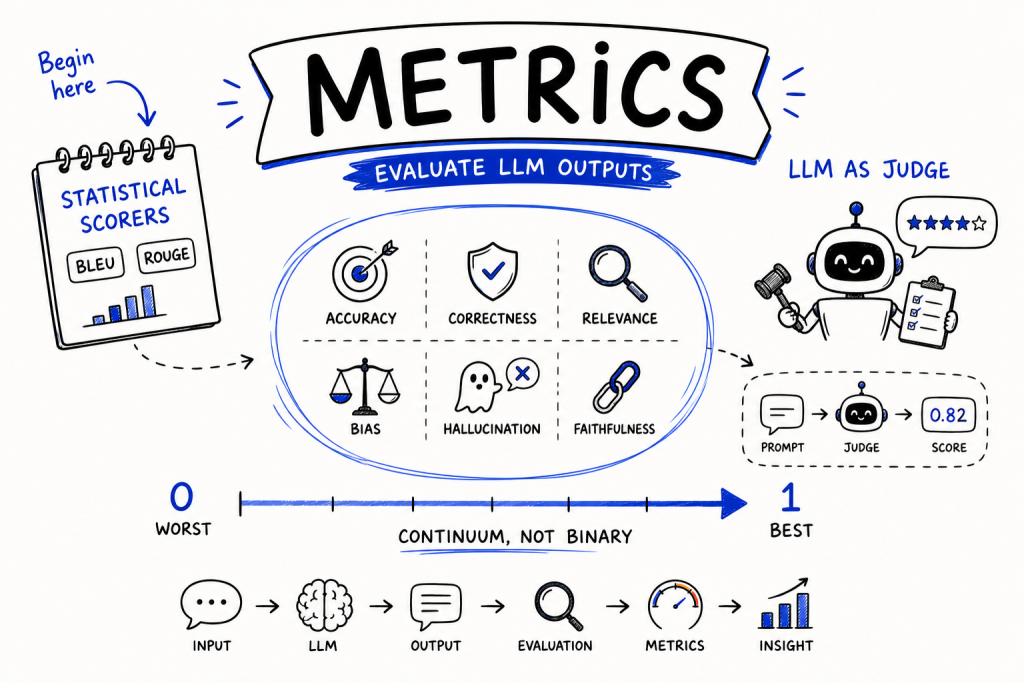
4. Statistical Scorers
This blog will begin by introducing how statistical scorers like BLEU and ROUGE are calculated to help us evaluate LLM outputs.
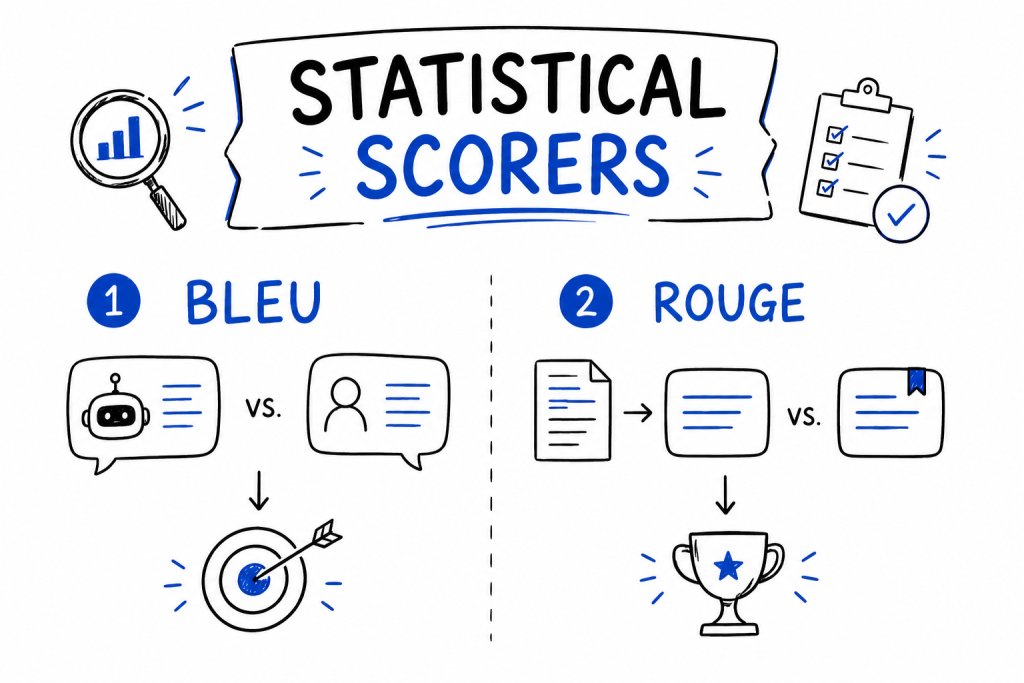
4.1 BLEU – The Accuracy of AI Translation
The basic idea of BLEU is to compare the LLM (NLP) output, which is a machine-generated translation, with a reference translation. The algorithm divides both the machine-generated translation and the human reference translation into small units called unigrams (words) and compares how well they match.
Example: The machine translation output of “Tôi đang 36 tuổi” is "I have thirty six years."
The reference translation is "I am thirty six years old."
How do we calculate the BLEU score?
There are three main steps:
- Calculate Precision.
- Calculate the Brevity Penalty.
- Calculate the BLEU score.
Calculate Precision.
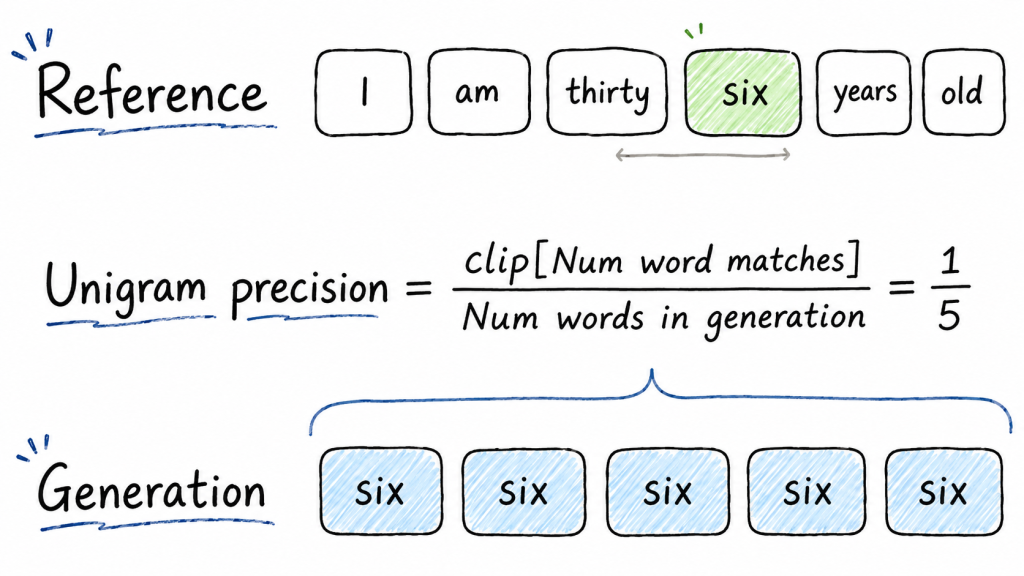
We separate the generation into word (unigram) then count how many of them appear in the reference.
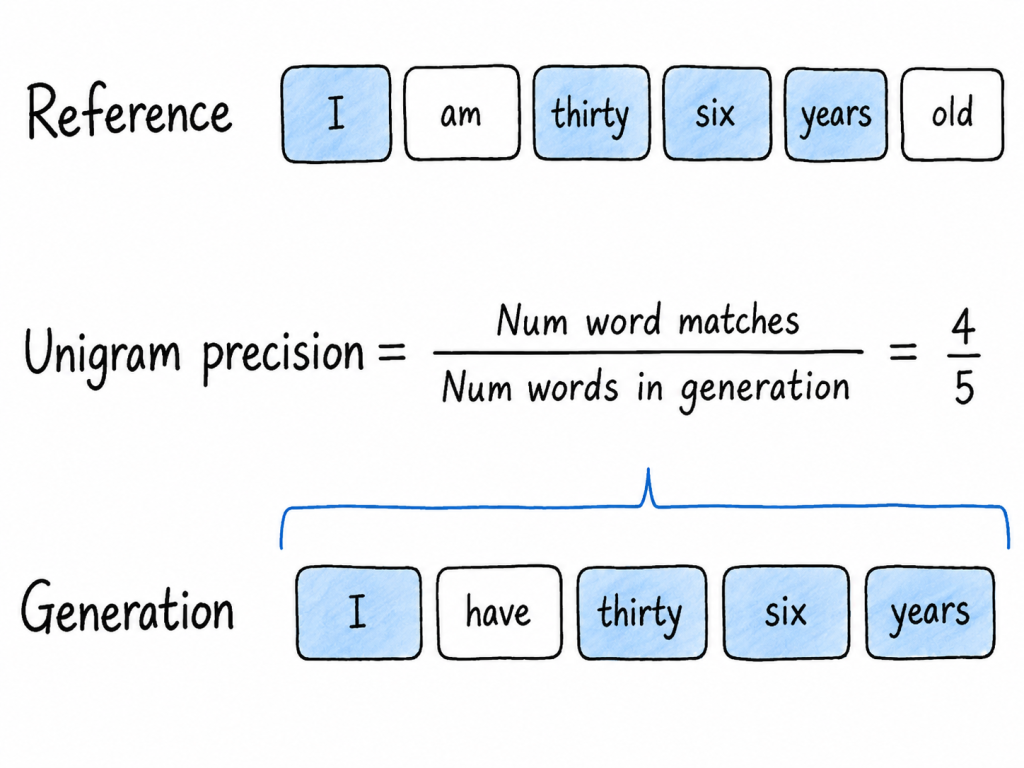
We also clip the number of matched words before dividing by the number of words in the generated text. This prevents repeated words in the generated sentence from artificially inflating the precision score, even when the sentence itself is meaningless.
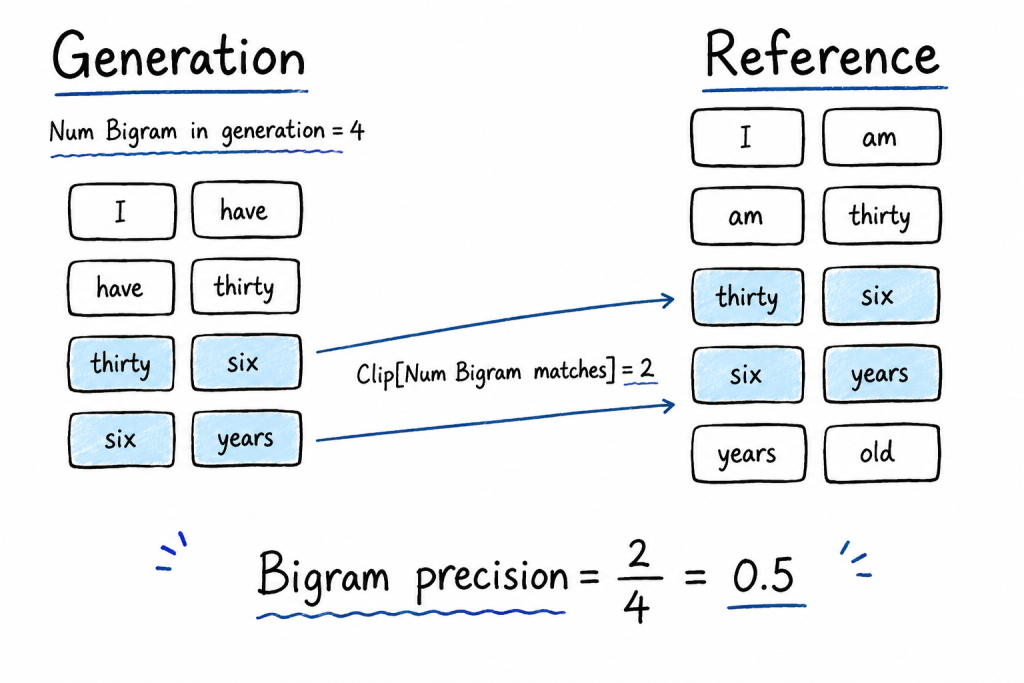
Next, we calculate precision using bigrams by splitting both sentences into pairs of consecutive words.
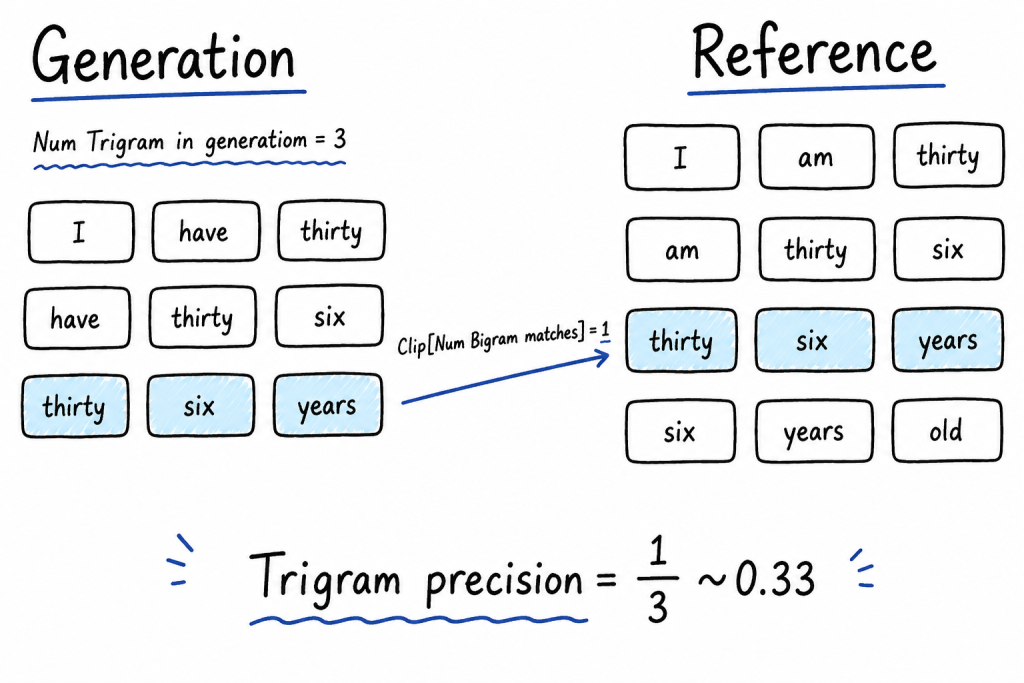
We repeat the same idea and formula for trigrams and 4-grams by grouping the sentences into sequences of three and four consecutive words.
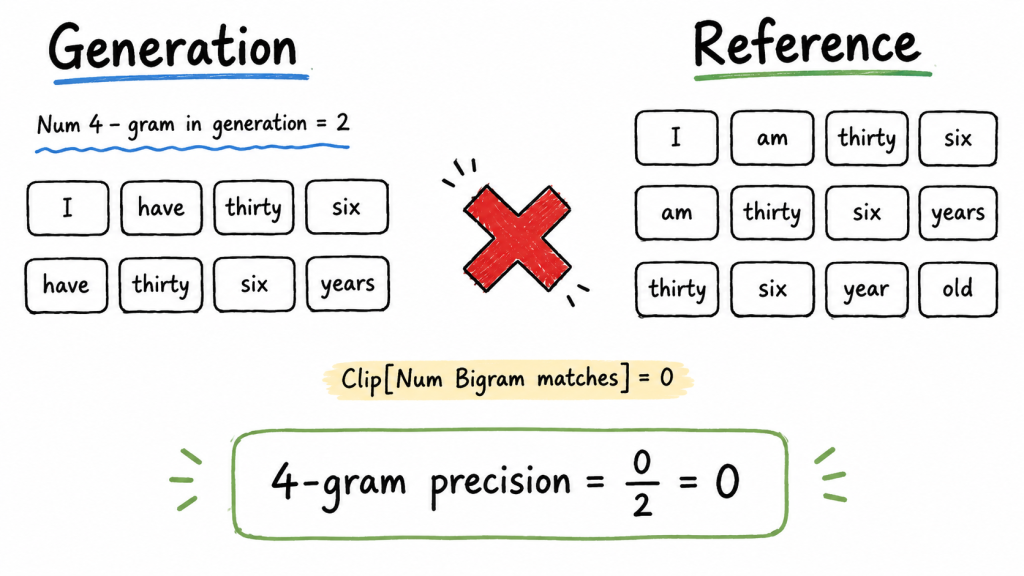
Calculate the Brevity Penalty
Brevity Penalty: If the generated sentence is too short, we apply a penalty to give the output a lower score.
Example:
Genration: I am thirty six
Reference: I am thirty six years old
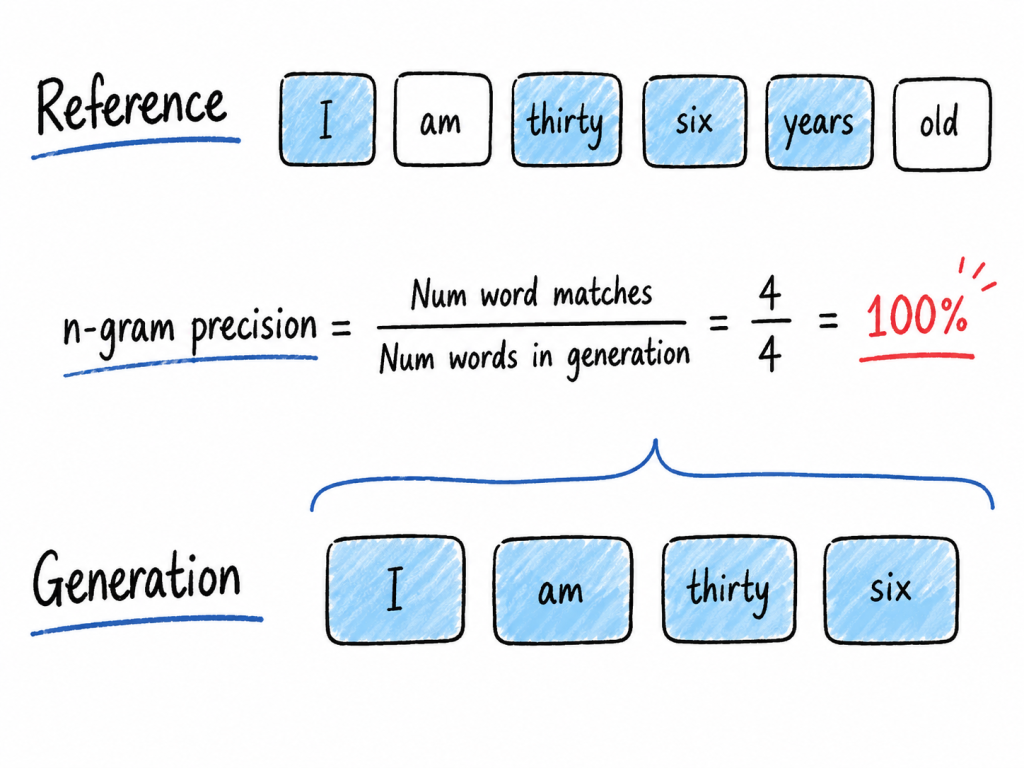
All n-gram precisions are 100%, which is a very high score.
However, the sentence is shorter than the full reference, so we cannot give this output a high BLEU score. If the generated output is shorter than the reference, we apply the Brevity Penalty formula to calculate the penalty. If the generated sentence is longer than or equal to the reference, obviously no penalty is applied, and BP = 1
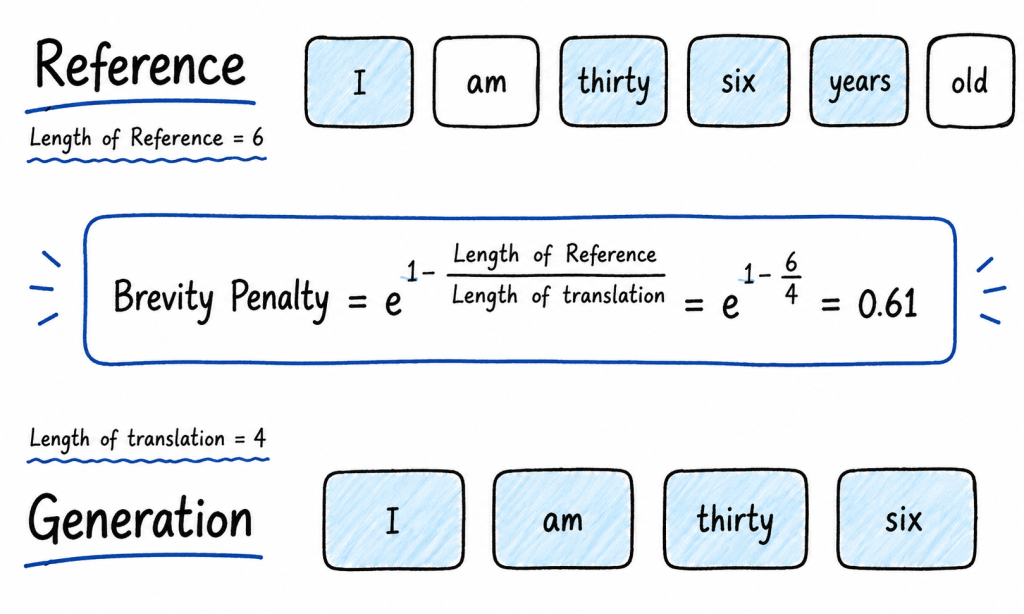
In the example above, the generated sentence conveys the correct meaning. However, we still apply the Brevity Penalty because it is shorter than the reference. As a result, the final BLEU score is 0.61 instead of 1.0.
Returning to our main example, we can now calculate the Brevity Penalty
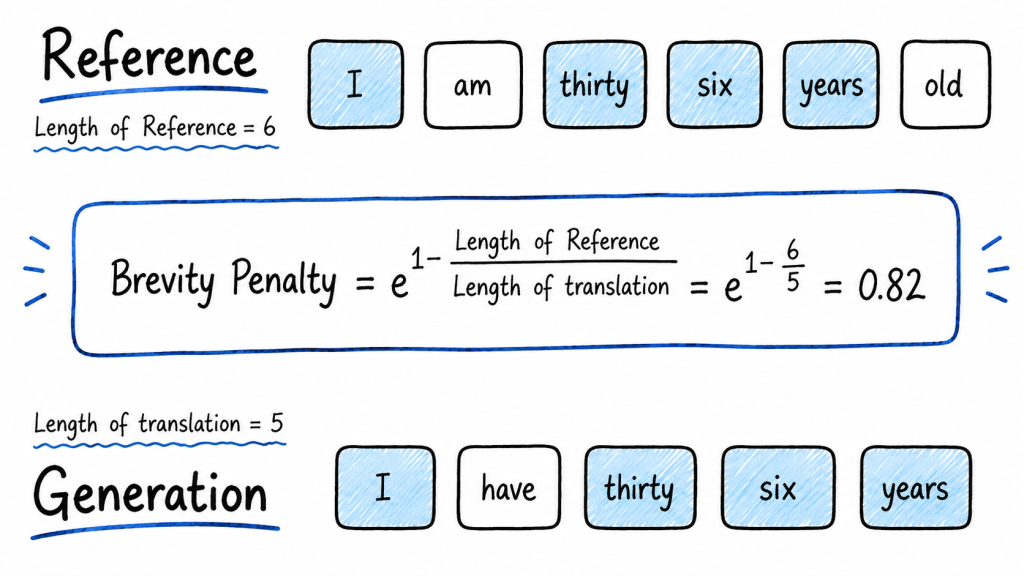
Calculate the BLEU score.
Bleu score is the geometric mean of all four n-gram precisions
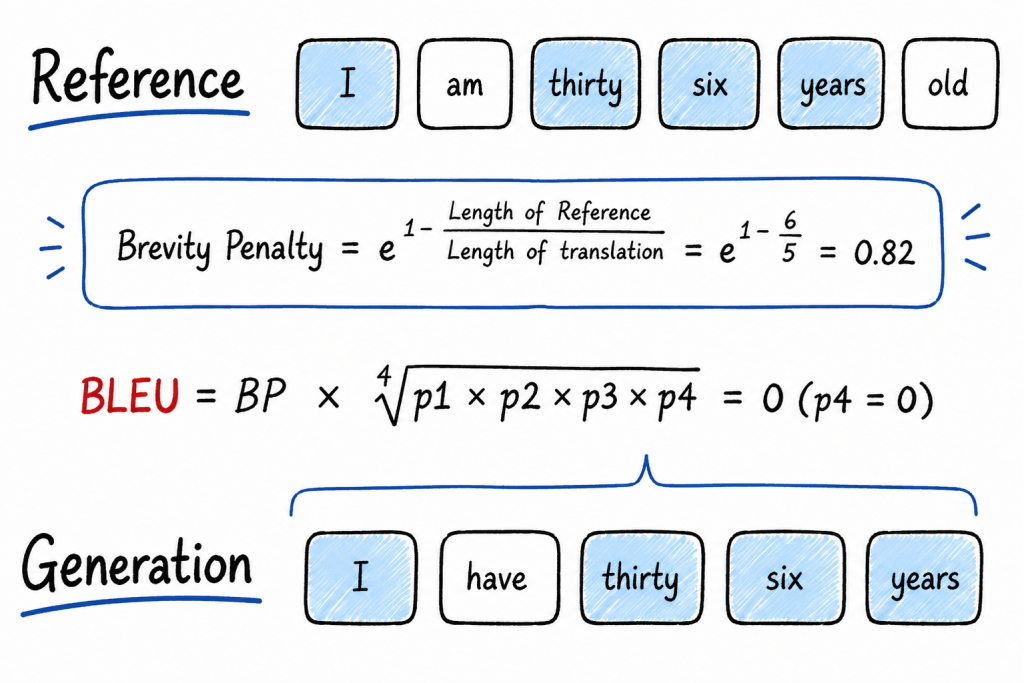
Of course, the generated sentence is completely incorrect, and BLEU correctly gives it core 0.
Below is an example of using the Hugging Face evaluate library in Python to calculate the BLEU score.
import evaluate
bleu = evaluate.load("bleu")
predictions = [ "I have thirty six years"]
references = ["I am thirty six years old"]
result = bleu.compute(
    predictions=predictions,
    references=references
)
print(result)
{
'bleu': 0.0, 'precisions': [0.8, 0.5, 0.3333333333333333, 0.0], 'brevity_penalty': 0.8187307530779819,
'length_ratio': 0.8333333333333334,
'translation_length': 5,
'reference_length': 6
}4.3 ROUGE – How Good Is AI at Summarization?
The idea of ROUGE is to evaluate the generated summary of an input. Let‘s start with example
Example:
Input:
We have a book review:
“I gave The Hunger Games 5 stars because I simply could not put it down! The characters are superb, and the writing keeps you on the edge of your seat. I loved reading this book.”
Output summary: I really loved reading the Hunger Games
Reference summaries: I loved reading the Hunger Games | The Hunger Games is a great read. I loved it.
How do we calculate the BLEU score?
In the ROUGE calculation, we use Precision and Recall.
Calculate the Precision and Recall
Precision: Out of everything the model generated, how much is correct?
Recall: Out of all the correct information in the reference, how much did the model successfully generate?
Let’s begin by calculating the unigram and bigram precision and recall
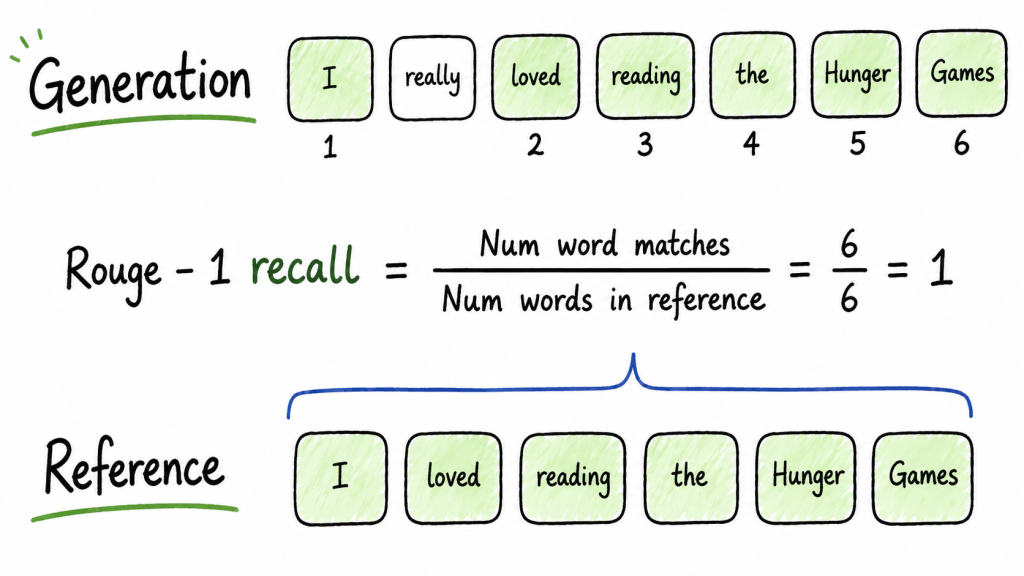
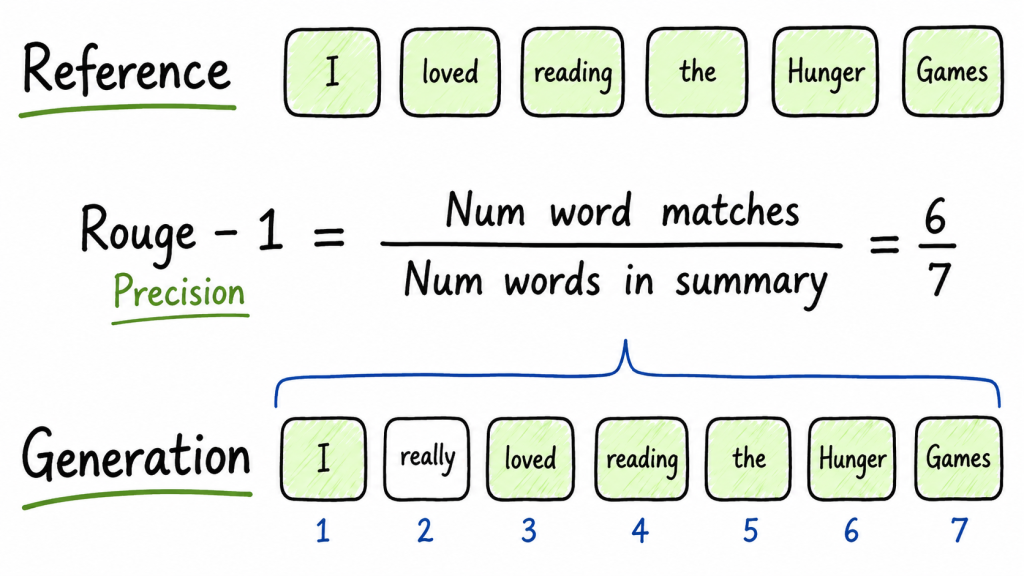
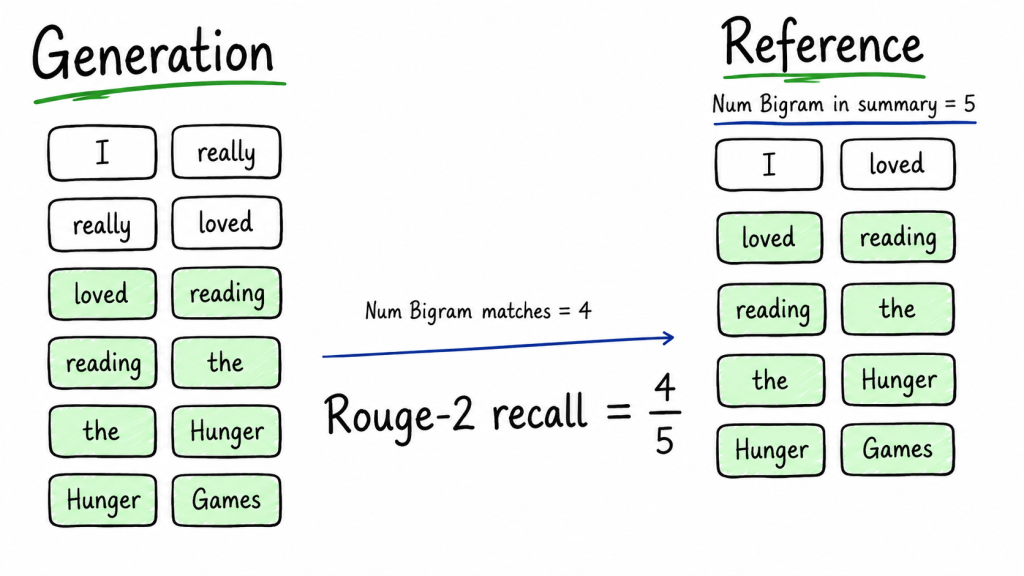
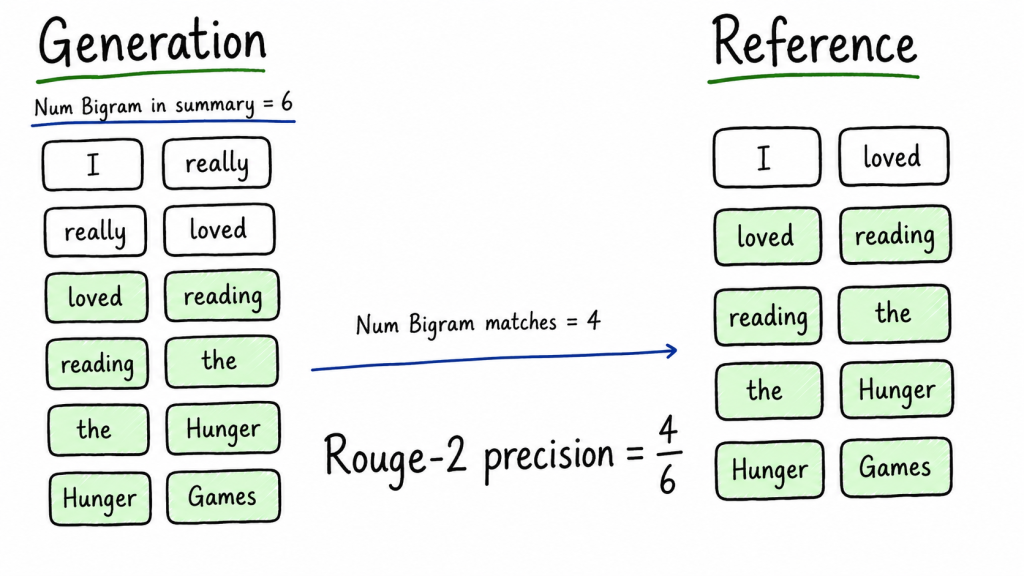
The above four slides calculate the unigram and bigram precision and recall. Now, let’s move on to ROUGE-L
ROUGE-L is different from ROUGE-1 and ROUGE-2.
Instead of comparing n-grams, it compares the Longest Common Subsequence (LCS) between the prediction and the reference.
A subsequence is a sequence of words that appears in the same order, but the words do not have to be adjacent.
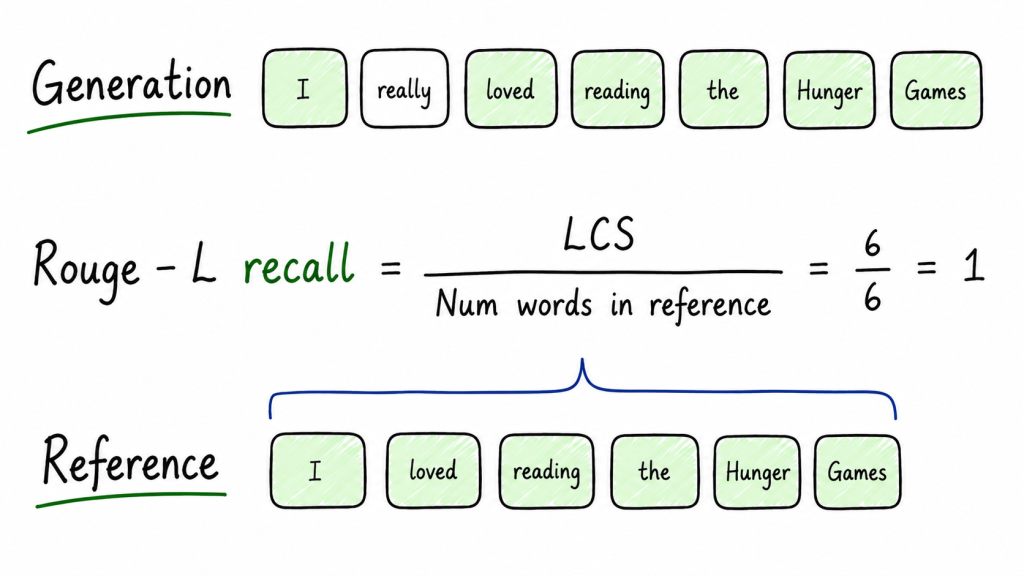
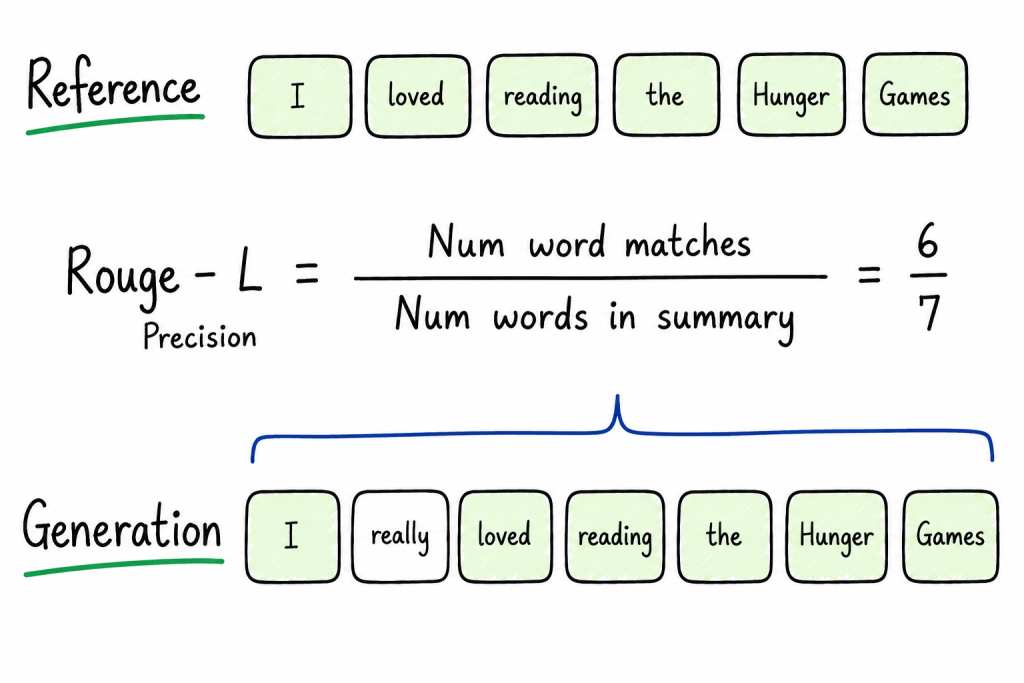
Below is an example of using the rouge_score library in Python to calculate the ROUGE score.
from rouge_score import rouge_scorer
scorer = rouge_scorer.RougeScorer( ['rouge1', 'rouge2', 'rougeL'], use_stemmer=True)
scores = scorer.score(
    "I loved reading the Hunger Games",
    "I really loved reading the Hunger Games"
)
print(scores)
{
    'rouge1': Score(
        precision=0.8571428571428571,
        recall=1.0,
        fmeasure=0.923076923076923
    ),
    'rouge2': Score(
        precision=0.6666666666666666,
        recall=0.8,
        fmeasure=0.7272727272727272
    ),
    'rougeL': Score(
        precision=0.8571428571428571,
        recall=1.0,
        fmeasure=0.923076923076923
    )
}
4.4 F1 Score
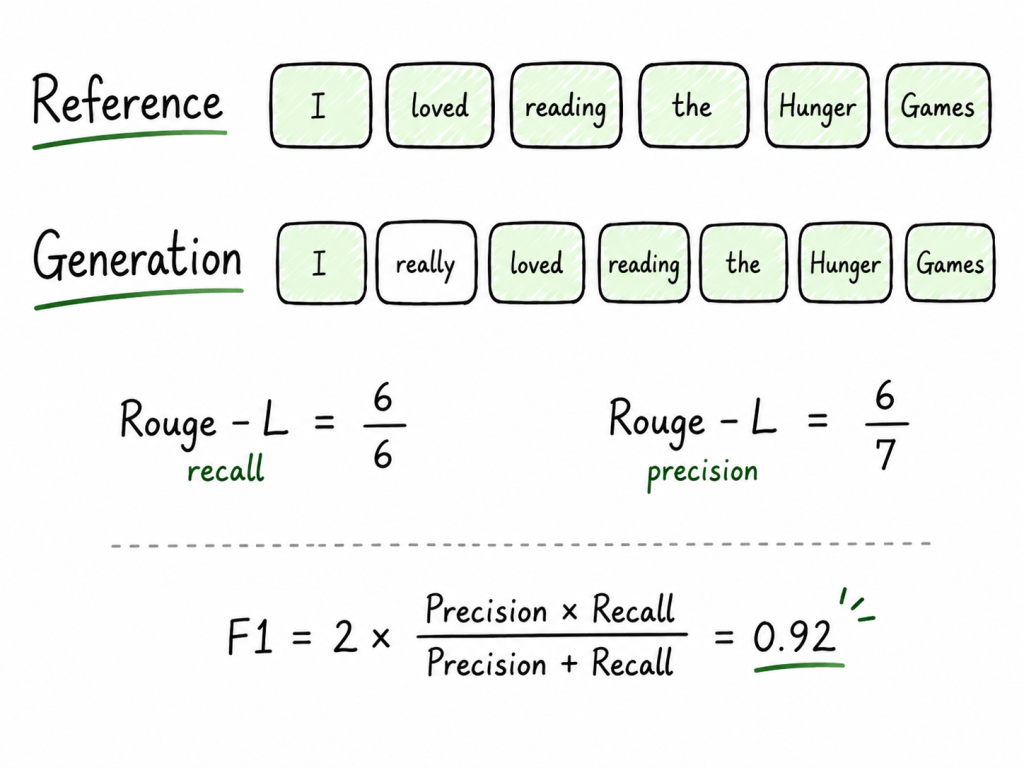
If you’re feeling tired of dealing with the two ROUGE metrics—Precision and Recall—don’t worry. The F1 score is the answer. It combines both metrics into a single balanced score.
As you can see in the results, rouge_scorer returns the fmeasure. So, how is this metric calculated?
This is formula 1:
5. Conclusion
We have just explored the basic concepts behind the statistical metrics BLEU, ROUGE, and F1 for traditional NLP tasks. These metrics can help evaluate LLM outputs in some specific scenarios. However, statistical metrics are not sufficient for evaluating long and complex LLM outputs, especially when no reference is available.
Today, we have many modern evaluation metrics that measure aspects of LLM applications such as relevance, correctness, bias, and hallucination. These metrics, together with the increasingly popular LLM-as-a-Judge approach, provide a more powerful way to overcome the challenges mentioned above and make it easier to evaluate LLM products.
In the next part, we’ll explore these modern evaluation methods in more detail.
References
https://blog.magicpod.com/traditional-testing-llm-applications
https://testomat.io/blog/llm-test
https://galtea.ai/blog/llm-evaluation-vs-software-testing-why-your-existing-qa-process-doesnt-work
https://www.evidentlyai.com/llm-guide/llm-evaluation-metrics
https://mbrenndoerfer.com/writing/bleu-score-machine-translation-evaluation-nlp
https://mbrenndoerfer.com/writing/exact-match-f1-nlp-evaluation-metrics