


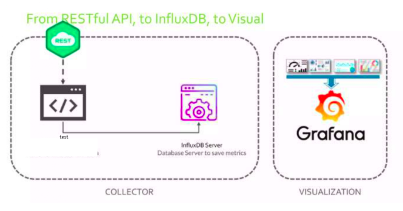
I hope you are doing great these days. Let’s learn something new. In this blog, we will Build Grafana Dashboard for Rest assured test metrics and learn about the Tips and tricks used. So before creating the dashboard or building a dashboard for Rest Assured test metrics with Grafana, you will need to have the following prerequisites:
- Rest Assured Framework: We need to have the Rest Assured framework set up and running in the environment. Rest Assured is a Java-based library that is used for testing RESTful web services.xz
- Test Results: We need to have the test results generated by Rest Assured. The results should be in a format that can be read by Grafana. We can generate the test results using various testing frameworks like JUnit, TestNG, or any other custom testing framework.
- Metrics: We need Rest Assured tBuild Grafana Dashboard for Rest assured test metrics and learn about the Tips and tricks used.est metrics that We want to monitor and visualize in the dashboard. Some of the common metrics include test pass/fail rates, response times, error rates, and more.
- Data Source: We need to have a data source set up in Grafana that can read the test results generated by Rest Assured. Grafana supports a wide range of data sources, including Graphite, InfluxDB, Elasticsearch, and more.
- Grafana: We need to have Grafana installed and configured in your environment. Grafana is an open-source dashboard and visualization platform that is used for monitoring and analyzing data.
- Dashboard Configuration: We will need to create panels, select data sources, and customize the dashboard layout.
Rest Assured Framework and Metrics
Let’s see first how we will create Rest assured Framework with some test metrics. So let us take an example of a dummy API for creating the framework.
import org.testng.Assert;
        import org.testng.annotations.Test;
        import io.restassured.RestAssured;
        import io.restassured.response.Response;
        import io.restassured.specification.RequestSpecification;
        import static io.restassured.RestAssured.given;

public class RestAssuredTest {

    @Test
    public void restAssuredTest() {

        // start timer
        long startTime = System.currentTimeMillis();

        // send request to http://example.com/api
        RequestSpecification request = RestAssured.given().log().all();
        Response response = request.get("https://reqres.in/api/users?page=2")
        // end timer and calculate response time
        long responseTime = System.currentTimeMillis() - startTime;


        // collect test metrics
        int statusCode = response.getStatusCode();
        String responseBody = response.getBody().asString();
        int responseSize = responseBody.length();
        double errorRate = 0.0;
        int totalTests = 10;
        int passedTests = 8;


        // calculate error rate and test pass/fail rates
        if (totalTests > 0) {
            errorRate = (double) (totalTests - passedTests) / totalTests;
        }
        double passRate = (double) passedTests / totalTests;
        double failRate = 1 - passRate;


        // print test metrics
        System.out.println("Status code: " + statusCode);
        System.out.println("Response size: " + responseSize);
        System.out.println("Response time: " + responseTime + " ms");
        System.out.println("Error rate: " + errorRate);
        System.out.println("Pass rate: " + passRate);
        System.out.println("Fail rate: " + failRate);


        // assert test metrics
        // Assert.assertEquals(statusCode, 200);
        Assert.assertTrue(responseSize > 0);
        Assert.assertTrue(responseTime < 5000); // assert that response time is less than 5 seconds
        Assert.assertTrue(passRate > 0.7); // assert that pass rate is greater than 70%
    }
}
Now we need to store these metrics in the data source, so here we are going to use influx db to store the metrics like response time. response size, status code, error rates, test pass/fail rates, and more.
Store Metrics to DataSource
To store test metrics in InfluxDB, you will need to follow these steps:
- Add the InfluxDB Java client library to your project dependencies. You can add it to your Maven or Gradle build file.
<dependency>
   <groupId>org.influxdb</groupId>
   <artifactId>influxdb-java</artifactId>
   <version>2.18</version>
</dependency>- Create an InfluxDB object and connect it to your InfluxDB instance. You will need to provide the URL, username, and password. The default port is 8086 for influx db
InfluxDB influxDB = InfluxDBFactory.connect(“http://localhost:8086”, “username”, “password”);
- Create a BatchPoints object and add Point objects to it. A Point object represents a measurement in InfluxDB and includes a timestamp and one or more fields.
// create a BatchPoints object for the "test_metrics" measurement
       BatchPoints batchPoints = BatchPoints
               .database("my_database")
               .tag("host", "my_server")
               .retentionPolicy("autogen")
               .build();

// create a Point object for the test metrics
       Point point = Point.measurement("test_metrics")
               .time(System.currentTimeMillis(), TimeUnit.MILLISECONDS)
               .addField("status_code", statusCode)
               .addField("response_size", responseSize)
               .addField("response_time", responseTime)
               .addField("error_rate", errorRate)
               .addField("pass_rate", passRate)
               .addField("fail_rate", failRate)
               .build();

// add the Point object to the BatchPoints object
batchPoints.point(point);- Set the tags for the Point object. Tags are metadata that can be used to filter and group measurements in InfluxDB.
BatchPoints batchPoints = BatchPoints
       .tag("host", "my_server")
.build();- Write the BatchPoints object to InfluxDB using the write method of the InfluxDB object.
influxDB.write(batchPoints);
Installation of Grafana and InfluxDB
Now it’s time to download and install the Grafana and influx db, here we have Ubuntu On Ubuntu 20.04.6 LTS, we can install it with the following commands:
- Using this command download influx db first-
curl -sL https://repos.influxdata.com/influxdb.key | sudo apt-key add –
echo “deb https://repos.influxdata.com/ubuntu bionic stable” | sudo tee /etc/apt/sources.list.d/influxdb.list
sudo apt-get update && sudo apt-get install -y influxdb
- Start InfluxDB with the following command:
sudo systemctl start influxdb
- Download and install Grafana by following the official installation instructions for your Linux distribution. For example, on Ubuntu, you can install it with the following commands:
wget -q -O - https://packages.grafana.com/gpg.key | sudo apt-key add -
       echo "deb https://packages.grafana.com/oss/deb stable main" | sudo tee /etc/apt/sources.list.d/grafana.list
sudo apt-get update && sudo apt-get install -y grafana- Access the Grafana web interface by opening a web browser and navigating to http://localhost:3000
Create a dashboard in Grafana-
As we can see the Grafana on the local web browser, now we need to add the data source first so that we can connect the influxdb with Grafana
Add InfluxDB as a data source in Grafana by following these steps:
- Click on the “Configuration” gear icon in the left sidebar and select “Data Sources”.
- Click on the “Add data source” button and select “InfluxDB”.
- Enter a name for the data source and the URL for your InfluxDB instance (e.g. http://localhost:8086).
- Enter the username and password for your InfluxDB instance (if applicable).
- Click on the “Save & Test” button to test the connection to InfluxDB.
Now it’s time to add Grafana Dashboard in Grafana-
To add a Grafana dashboard, these are the following steps:
- Click on the “Create” button in the left sidebar and select “Dashboard” from the dropdown menu.
- Select the type of panel you want to add to your dashboard (e.g. Graph, Singlestat, Table, etc.) from the list of available options.
- Configure the settings for your panel, such as the data source, the query to run, and the visualization options.
- Once you have configured your panel, click on the “Add Panel” button to add it to your dashboard.
- Now click on the “Save” button in the top right corner of the screen.
- Enter a name for your dashboard and click on the “Save” button again to save it.
- Your dashboard should now be visible in the left sidebar under the “Dashboards”
Tips and Tricks
Some tips and tricks for building Grafana dashboards for REST Assured metrics are as-
- Use the right visualization: Grafana provides a wide range of visualizations like graphs, tables, heat maps, etc. Choose the right visualization that best represents your data. For example, use a line graph to represent response time over time, or use a table to display detailed information about failed requests.
- Group and filter your data: REST Assured metrics can provide a lot of data, so it’s important to group and filter your data to make it more meaningful. Use filters to show data for specific endpoints or services, and group data to compare different services or endpoints.
- Use alerts: Alerts can help you quickly identify issues or potential problems with your services. Configure alerts for important metrics like error rates or response time, and set appropriate thresholds.
- Use annotations: Annotations can be used to mark important events or changes in your system. Use annotations to mark releases, deployments, or other important events that can help you correlate changes in metrics.
- Use dashboard templates: If you have multiple services or endpoints to monitor, it can be helpful to create dashboard templates. This allows you to reuse your dashboard configurations across different endpoints or services, saving you time and effort.
Conclusion-
In conclusion, building a Grafana dashboard for Rest Assured metrics can be a valuable tool for monitoring the performance and behavior of your REST API. By following these tips and tricks, we can create an effective dashboard that provides valuable insights into your API’s performance and helps quickly identify and address any issues that arise. If you have any query please add a comment below, I hope you like this blog
References:-
- https://grafana.com/docs/grafana/latest/dashboards/
- . https://github.com/rest-assured/rest-assured/wiki/Usage
- https://docs.influxdata.com