


Every analytics initiative starts with a business question. Yet most teams jump straight to tools. They debate warehouses, lakehouses, and BI platforms before anyone defines the real problem. As a result, the analytics architecture reflects tool preferences instead of business needs.
- In Why Analytics Projects Fail Before They Begin?, we explored why analytics projects fail before they begin.
- In How Datus Creates a Unified Data Engineering Operating Model?, we saw how Datus unifies the analytics lifecycle.
This article explains how to move from a vague business question to a justified analytics architecture. We will walk through six steps and show how Datus automates each one.
Why Analytics Architecture Should Start with Questions?
Architecture is a set of answers. However, those answers only make sense when the questions are clear.
Consider a typical request:
“We need a dashboard to understand why students are not performing well.“
This sentence hides many decisions:
- Which students?
- What does “not performing well” mean?
- How fresh must the data be?
- Which systems hold the evidence?
Without answers, teams guess. Guesses lead to rework, and rework leads to cost. Therefore, the first job is to turn business language into structured, testable requirements.

Our Running Scenario: School Performance Card
To keep things concrete, we will use one scenario throughout.
A county office of education wants to help parents, principals, and board members understand how schools are doing. The superintendent says:
“I want a School Performance Card for every school in California. It should show more than test scores. It should also show where schools need support, and how they compare with similar schools.“
California already publishes a lot of public school data. However, the data is spread across many files and release cycles. Our scenario is fictional, but the challenge is very real. Let’s make it buildable.
Step 1: Business Objective Decomposition
Decomposition breaks one broad goal into smaller, measurable parts. Each part should answer a single question.
For our school card, Datus can produce a structure like this:
objective: Publish a School Performance Card for every California school
sub_objectives:
  - id: SO1
    goal: Show academic achievement
    question: "What share of students meet or exceed standards in ELA and math?"
  - id: SO2
    goal: Show equity across student groups
    question: "How do English learners, low-income students, and students with disabilities perform?"
  - id: SO3
    goal: Show student engagement and school climate
    question: "How many students are chronically absent or suspended?"
  - id: SO4
    goal: Show readiness for life after school
    question: "How many students graduate and are prepared for college or career?"
  - id: SO5
    goal: Enable fair comparison
    question: "Which schools are similar in size, demographics, and funding?"
success_criteria:
  - One card per school, refreshed after each annual data release
  - Peer comparison available for every school
constraints:
  - Public data only
  - State rules on small-group data suppression must be respected
  - Delivery within 12 weeks
Notice three things:
- Every sub-objective is a question.
- Success criteria are explicit.
- Constraints are captured early.
Datus also records who asked and who decides. Consequently, stakeholder mapping happens at the same time as decomposition.
Step 2: KPI Discovery
Once the questions are clear, the next step is to find the metrics that answer them. This is KPI discovery.
Many teams skip this step. Then each group defines “performance” differently. One report ranks schools by test scores. Another focuses on graduation. Both appear in the same meeting, and neither is wrong. They simply measure different things.
Datus prevents this by proposing KPIs for every sub-objective and asking for confirmation.
| Sub-objective | Proposed KPI | Type |
|---|---|---|
| SO1 | % meeting or exceeding standard, ELA | Outcome |
| SO1 | % meeting or exceeding standard, Math | Outcome |
| SO2 | Gap between student groups (ELA and Math) | Equity |
| SO3 | Chronic absenteeism rate | Engagement |
| SO3 | Suspension rate | Climate |
| SO4 | Graduation rate | Outcome |
| SO4 | % prepared for college or career | Outcome |
| SO5 | Enrollment and funding per student | Context |
Each KPI then receives a formal definition. For example:
kpi: chronic_absenteeism_rate
definition: "Students absent 10% or more of the days they were enrolled / eligible cumulative enrollment"
grain: school, student group, school year
owner: Director of Research and Accountability
refresh: annual, after state release
source_domains: [School Directory, Attendance]
A KPI definition like this can also be turned into a query. For example (syntax may vary by SQL dialect):
SELECT
    cds_code,
    student_group,
    school_year,
    chronic_absent_count * 1.0 / NULLIF(eligible_enrollment, 0) AS chronic_absenteeism_rate
FROM curated.attendance
WHERE school_year = '2024-25';
As a result, the definition, the owner, and the logic live together. That is the foundation of consistent metrics.
Step 3: Data Domain Mapping
KPIs need data. However, data rarely maps one-to-one with KPIs. Instead, it is easier to think in data domains. A domain is a business area that owns a set of related data.
Datus maps each KPI to the domains it needs.
| KPI | School Directory | Enrollment | Assessment | Attendance | Discipline | Outcomes | Funding |
|---|---|---|---|---|---|---|---|
| ELA / Math Proficiency | ✅ | ✅ | ✅ | ||||
| Chronic Absenteeism | ✅ | ✅ | ✅ | ||||
| Suspension Rate | ✅ | ✅ | ✅ | ||||
| Graduation / College & Career | ✅ | ✅ | ✅ | ||||
| Peer Comparison | ✅ | ✅ | ✅ |
This view reveals useful facts quickly. For instance, the School Directory supports every KPI. It holds the identifier that links all other data together, the 14-digit County-District-School (CDS) code. Therefore, it deserves the highest quality and the strongest ownership.
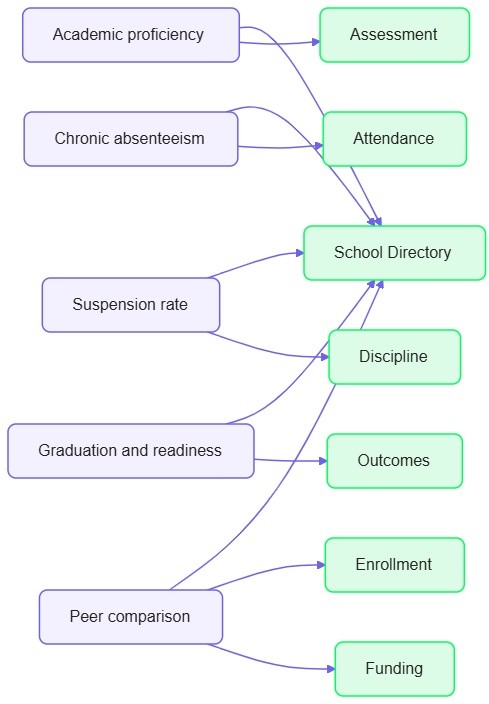
In addition, domain mapping supports governance. Each domain gets an owner, a classification, and a set of quality expectations before any pipeline exists.
Step 4: Source System Identification
Now we ask where each domain’s data actually lives. In practice, the answer is messy. Data arrives as separate files, released on different schedules, with slightly different layouts.
Datus builds a source inventory and scores each source on the factors that matter. The example below is simplified.
sources:
  - name: school_directory
    domain: School Directory
    type: Public delimited file
    change_pattern: updated as schools open, close, or change
    quality_risk: medium (schools open and close over time)
  - name: assessment_results
    domain: Assessment
    type: Public delimited file
    change_pattern: annual release
    quality_risk: medium (suppressed small groups)
  - name: attendance_chronic_absenteeism
    domain: Attendance
    type: Public delimited file
    change_pattern: annual release
    quality_risk: medium (suppressed small groups)
  - name: suspension_data
    domain: Discipline
    type: Public delimited file
    change_pattern: annual release
    quality_risk: medium
  - name: graduation_and_college_career
    domain: Outcomes
    type: Public delimited file
    change_pattern: annual release
    quality_risk: medium (high schools only)
  - name: enrollment_and_funding
    domain: Enrollment, Funding
    type: Public delimited file
    change_pattern: annual release
    quality_risk: low
This inventory immediately highlights risk. Public files hide small student groups to protect privacy. Therefore, Datus recommends early profiling to see how often values are suppressed.
-- Profile suppressed values before designing the pipeline
SELECT
    student_group,
    COUNT(*) AS suppressed_rows
FROM raw.chronic_absenteeism
WHERE chronic_absent_count = '*'
GROUP BY student_group
ORDER BY suppressed_rows DESC;
Finding such issues now costs hours. Finding them after launch costs weeks. As Blog 1 showed, late discovery multiplies cost.
Step 5: Technology Selection
At this point, the team knows the questions, the KPIs, the domains, and the sources. Only now does technology selection make sense.
Many organizations choose tools by popularity or habit. A better approach uses weighted criteria derived from the requirements you just captured.
For our school card, the requirements say:
- Data refreshes annually, not in real time.
- The team is strong in SQL.
- Public-sector budgets must be predictable.
- Governance and privacy rules are mandatory.
- Results must feed a public-facing BI report.
Datus converts these into weights and scores each option:
criteria = {
    "latency_fit":         0.15,
    "sql_skill_fit":       0.25,
    "cost_predictability": 0.25,
    "governance":          0.20,
    "bi_publishing":       0.15,
}

options = {
    "Cloud data warehouse":  [5, 5, 4, 4, 5],
    "Lakehouse":             [4, 3, 3, 4, 4],
    "Streaming-first stack": [2, 2, 2, 3, 3],
}

weights = list(criteria.values())
for name, scores in options.items():
    total = sum(w * s for w, s in zip(weights, scores))
    print(f"{name}: {total:.2f}")
The output:
Cloud data warehouse: 4.55
Lakehouse: 3.50
Streaming-first stack: 2.35
The streaming-first stack scores lowest because the data changes once a year. In other words, the requirements ruled it out, not opinion.
However, scores are only a starting point. Datus also records why each score was given. Consequently, architects can challenge and adjust the reasoning instead of arguing about conclusions.
Step 6: Automated Architecture Recommendations Using Datus
Finally, Datus combines everything into a single recommendation. It uses the objectives, KPIs, domains, sources, and scored technologies as inputs.
Here is an illustrative request:
Datus, recommend an analytics architecture for the "School Performance
Card" initiative. Use the confirmed KPIs, domain map, and source
inventory. Assume annual refresh, SQL-skilled team, public data only,
and a 12-week delivery window.
And here is an illustrative response, shortened for readability:
architecture_recommendation:
  pattern: Cloud data warehouse with layered modelling
  ingestion:
    - source: all public CDE files
      method: scheduled file ingestion with schema validation
      note: layouts can change between years, so version each schema
  layers: [raw, cleansed, curated, semantic]
  modelling:
    approach: dimensional model
    dimensions: [school, student_group, school_year]
    facts: [assessment, attendance]
    key: cds_code
  quality:
    - uniqueness check on (cds_code, school_year, student_group)
    - range check: all rates between 0 and 100
    - accepted-values check on student group names
    - suppression flag preserved, never imputed
  governance:
    - owners assigned per domain
    - classification: public, with suppression rules documented
    - lineage from every card metric back to its source file
  serving:
    - semantic layer exposing certified KPIs
    - peer-comparison view based on enrollment and funding
  risks:
    - Schools open and close, so CDS codes need history handling
    - Column names differ across years and need a mapping table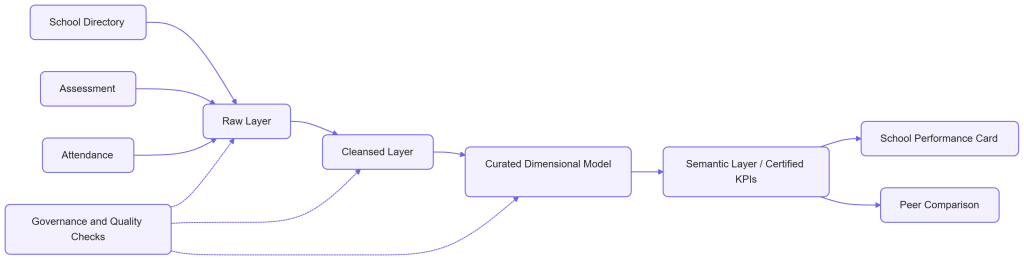
Three things make this recommendation different from a typical slide deck.
- Traceability – Every component links back to a KPI and a question.
- Explainability – Each choice carries its reasoning and its risks.
- Actionable – The output feeds directly into engineering, modelling, and quality tasks.
Datus can also generate an Architecture Decision Record (ADR) automatically:
# ADR-001: Use a cloud data warehouse as the core platform
Status: Proposed
Context: Annual refresh, SQL-skilled team, predictable public-sector budget.
Decision: Adopt a cloud data warehouse with layered modelling.
Alternatives considered: Lakehouse (higher complexity), streaming-first (not required).
Consequences: Strong SQL productivity; revisit if student-level data is added later.
What Changes for Your Team?
When this journey is automated, the day-to-day experience improves in practical ways.
- Faster alignment – Stakeholders review structured outputs instead of long documents.
- Fewer surprises – Source risks appear in week one, not week ten.
- Consistent metrics – KPIs have owners and definitions from the start.
- Defensible decisions – Technology choices come with evidence.
- Reusable knowledge – Teams capture context once and reuse it everywhere.
Common Pitfalls to Avoid
Even with automation, a few habits can undermine the process.
- Skipping stakeholder review – Datus proposes. People must still confirm.
- Treating weights as fixed – Revisit them when priorities change.
- Ignoring suppressed data – Never fill gaps with guesses. Flag them instead.
- Over-engineering – Choose the simplest architecture that meets the requirements.
In-Summary
A strong analytics architecture is not a tool list. It is the logical result of clear questions, agreed KPIs, mapped domains, known sources, and evidence-based technology choices.
Datus automates this chain. It decomposes objectives, discovers KPIs, maps domains, identifies sources, scores technologies, and recommends an architecture. Most importantly, it keeps every decision connected to the question that started it.
In the next blog, we will move from architecture to execution. We will explore how Datus turns these recommendations into data models, pipelines, and quality validations.