Introduction
Hello folks !!! In this blog we’ll see How we can create alerts in apigee for API Monitoring. This is quite interesting and new to learn and understand.
So, let’s get started !!!
Alerts play a very vital role in Apigee for API monitoring. Apigee is a platform that provides tools for designing, building, securing, and analysing APIs. One of the key features of Apigee is the ability to monitor API traffic and performance. This can be accomplish through the use of monitoring alerts, which allow you to define conditions that will trigger notifications when certain events occur.
API monitoring is crucial for ensuring the availability, reliability, and performance of your APIs. However, monitoring alone is not enough to ensure that your APIs are running smoothly. Alerts and notifications are necessary to notify you of any issues with your APIs so that you can take action immediately.
Here are some reasons why alerts and notifications are essential for API monitoring in Apigee:
- Proactive Monitoring: With alerts and notifications, you can get an alert in real-time about any issues with your APIs. This allows you to take action immediately and prevent any further damage.
- Faster Issue Resolution: Alerts and notifications help you identify problems early and address them before they escalate into bigger issues.
- Improved User Experience: By proactively monitoring your APIs and addressing issues quickly, you can provide a better experience for your users.
- Cost Savings: Detecting and resolving issues early can save you money in the long run.
Setting up alerts and notifications
To track an unusual events or patterns such as spikes in traffic or latencies set up alerts, which are triggered when a specified event occurs.An actual event that triggers an alert is called an incident.
Notification is set up when a particular alert is triggered. There are two types of alerts in Apigee:
- metric-based alerts
- log-based alerts.
Metric-based alerts – They are triggered based on predefined metrics in Apigee. These metrics include things like API response time, error rate, and request count. By setting thresholds for these metrics, you can create alerts that will notify you when certain conditions are met.
Log-based alerts – These are triggered based on events that are logged by Apigee. These events include things like API requests, errors, and warnings. By creating log-based alerts, you can be notified when specific events occur in your API.
NOTE: For the log based alerts as they are based on API data stored by cloud logging and also we have to generate queries for the metric for monitoring which is difficult as compared to metric-based alerts, so will be accessing them afterwards.
Configuring Metric Based Alerts
These alerts are triggered by changing in API Metrics . Example: Spike alert will shows you an alert that is triggered when the number of API requests over a 1 minute period is above 3600.
STEP-1 Open the Create alerting policy page in the Google Cloud console.
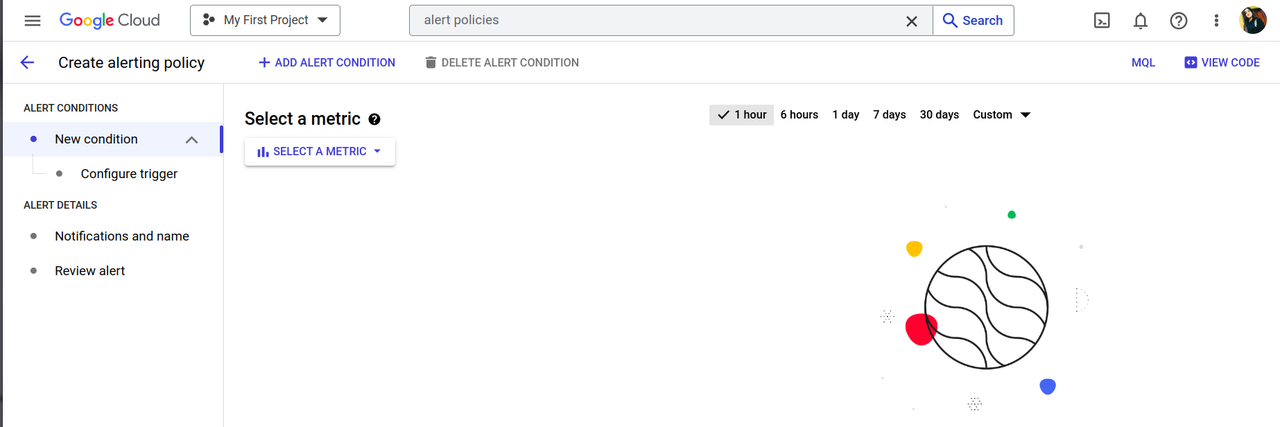
STEP-2 Select a metric
STEP-3 Deselect Show only active resources & metrics
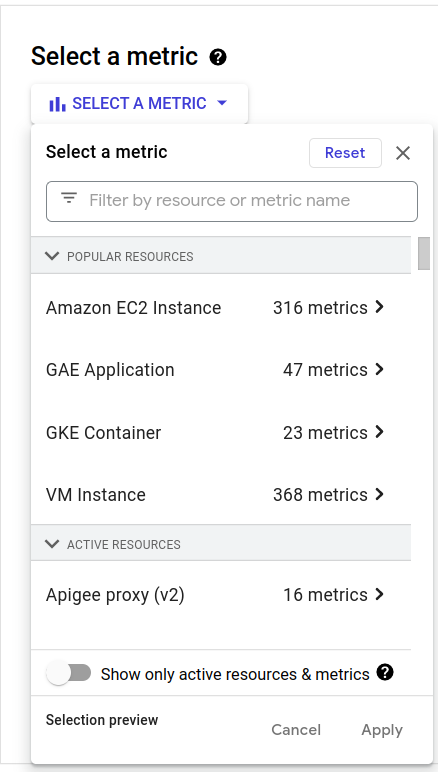
STEP-4 Select a metric as follows:
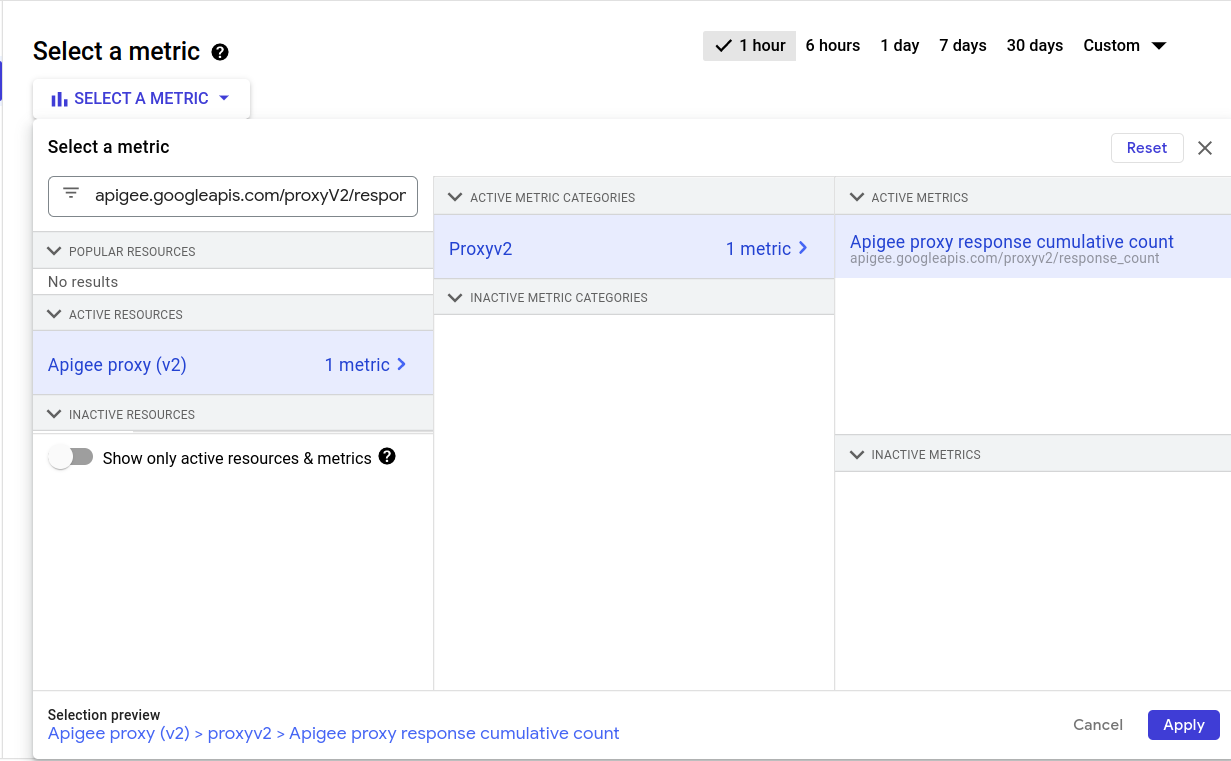
apigee.googleapis.com/proxyV2/response_count- Copy and paste the following in the Select metric field:
- Select Apigee Proxy (v2)
- In the pane that opens to the right, select Proxyv2
- Then, Apigee proxy response cumulative count in the next pane
- Click Apply
STEP-5 Add a filter for the particular proxy you want to monitor as follows:
- Click Add Filter
- Click in the Filter field and select proxy_name from the drop-down menu.
- In the Comparator, select =.
- In the Value field, type (name of your proxy)
- Click Done.
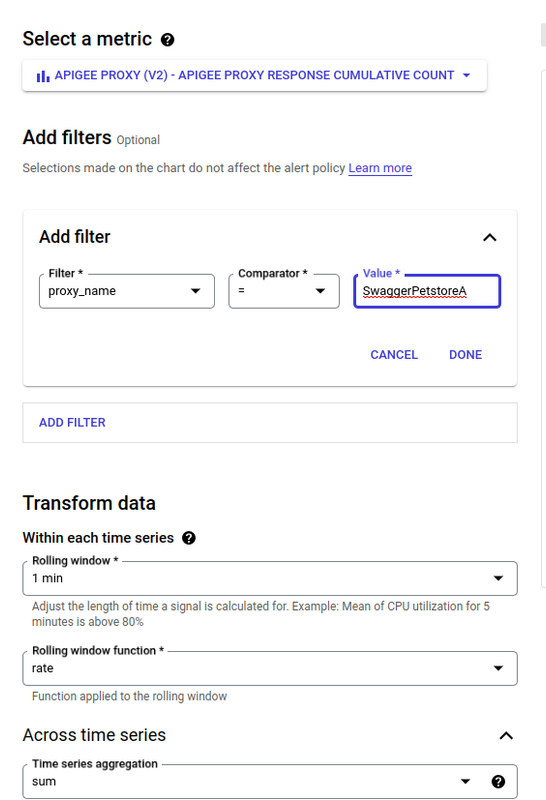
You can use any filter you have in the filtering list to add filter for monitoring as:
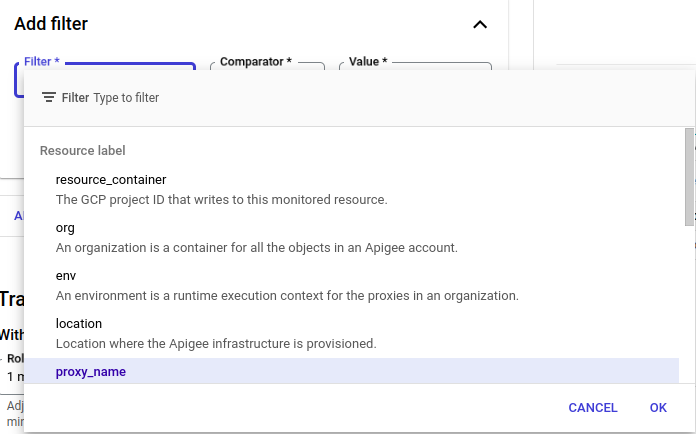
Above image shows you the filter list.
- After clicking on Next, you have to choose the data for Configure Alert Trigger as below:
Configure the alert trigger
To configure the event that triggers the alert, first click Configure trigger in the left-hand pane. Then do the following steps:
- Under Condition type, select Threshold.
- In the Alert trigger field, select Any time series violates.
- Threshold position field, select Above threshold.
- In the Threshold value field, enter 60.
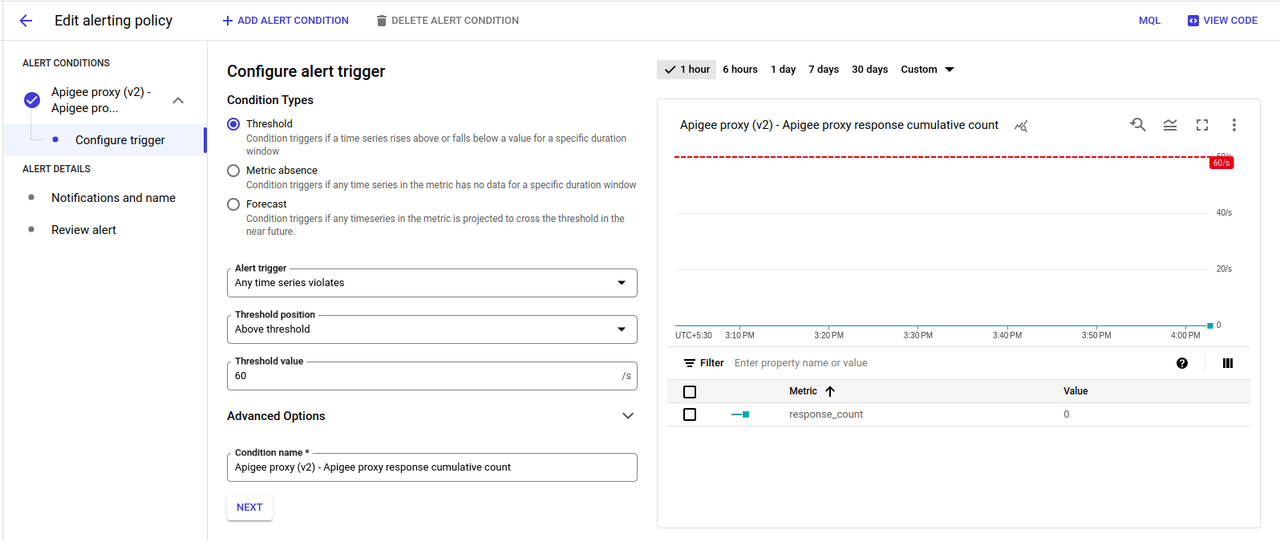
With these settings, an alert will be triggered whenever a response with code 500 is returned.
- Click Next to open the Configure notifications and finalise alert pane.
Set up a notification for the alert
- Click in the Notification Channels field. If you have already created a channel for the notification, such as an email address or SMS number, you can select it under Notification Channels.Otherwise, you need to add a channel by selecting Manage Notification Channels. This opens the Notification channels pane, where you can add one or more channels. See Manage notification channels for more information.
- To add notification channel Click on Manage Notification Channels as shown below :
- Again when you click on Next a page will appear like this:
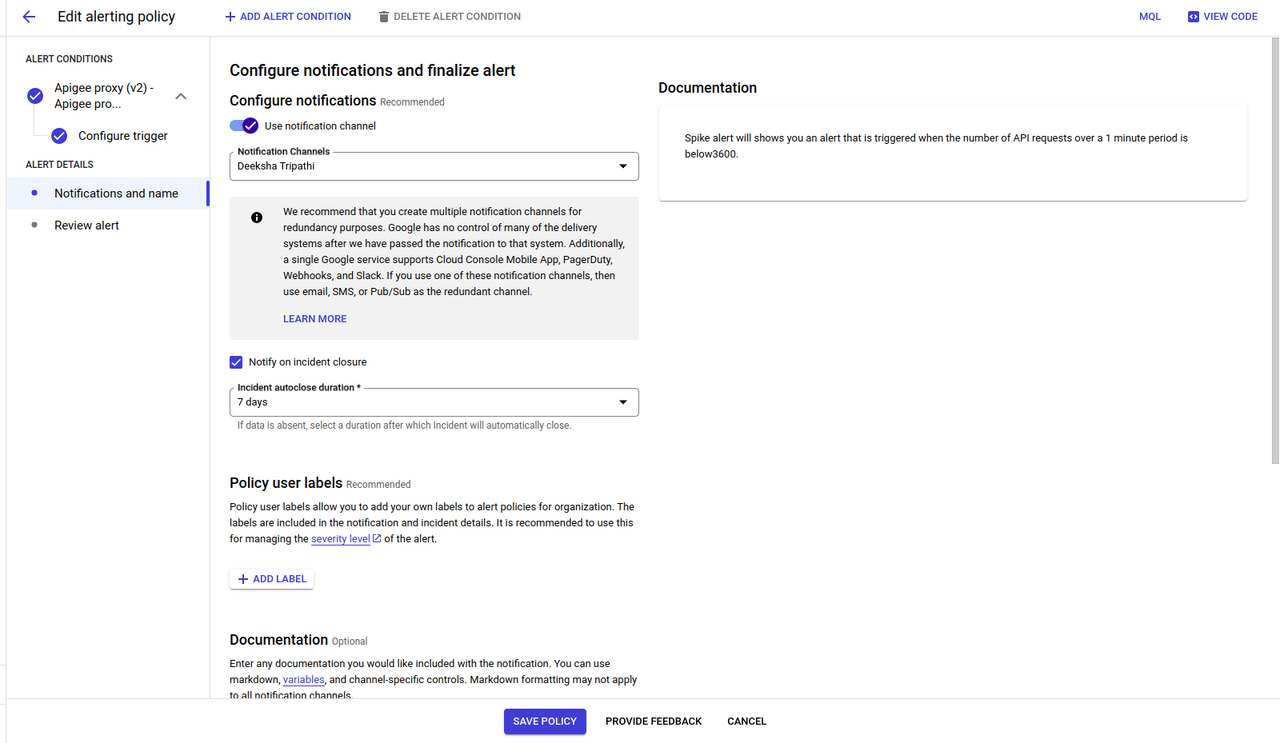
- Once you have selected one or more notification channels, click OK.
- In the Documentation field, you can add a message that will be sent with the notification.
- Click Next to review the details of the alert. If you are satisfied with them, click Create Policy to create the alerting policy.
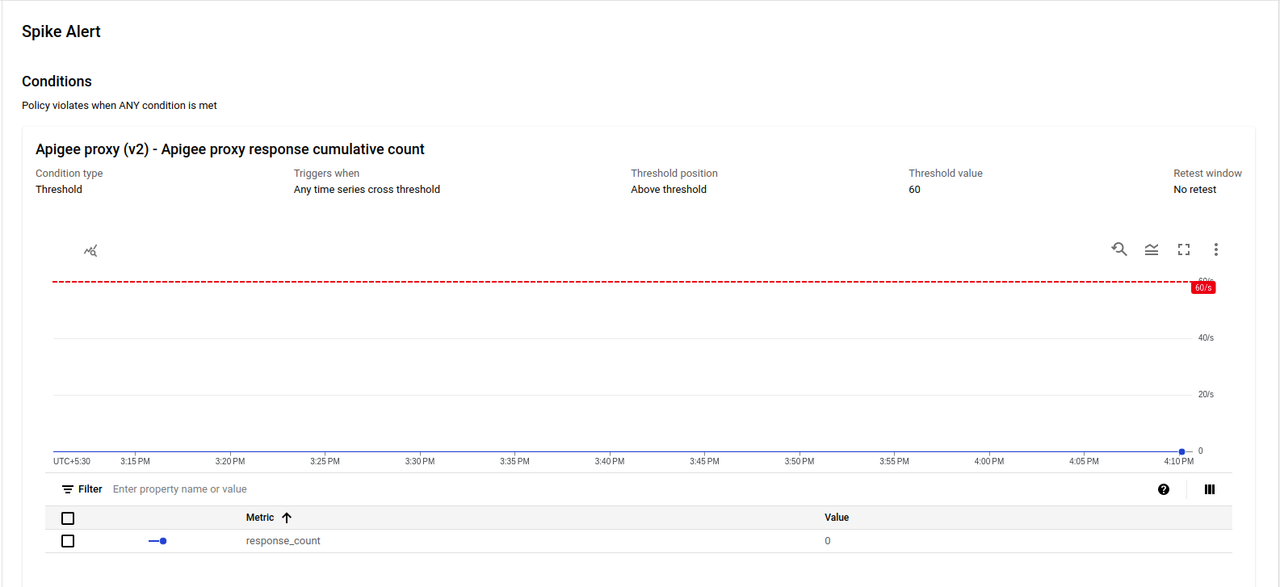
In the above image you can see your alert policy is created but it will only trigger an alert when incident is open .
- Now to Add the notification channel click on MANAGE NOTIFICATION CHANNELS as shown.
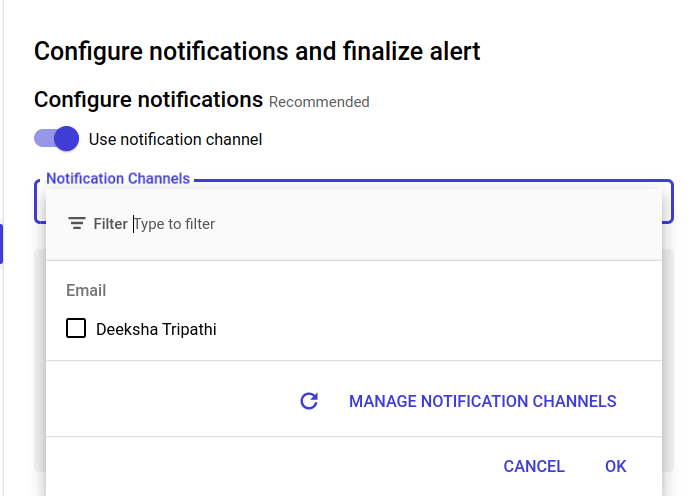
- A page will appear like the below image :
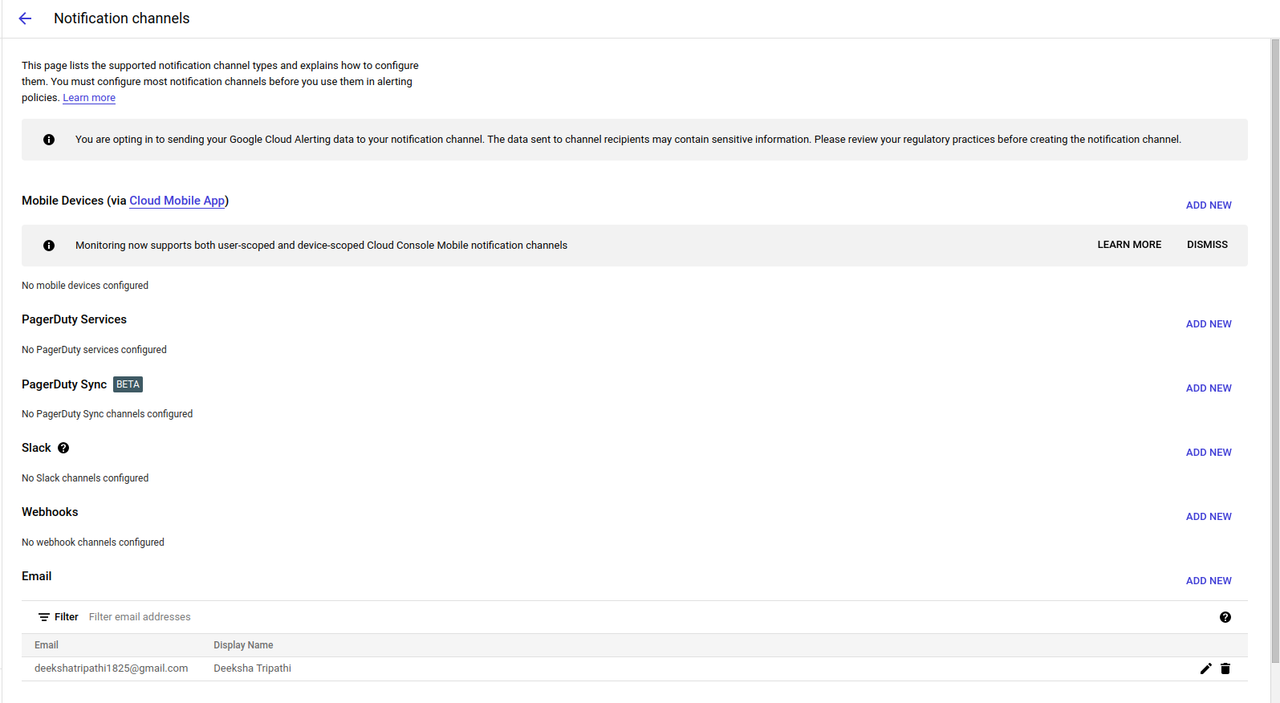
Click on ADD NEW to add the notification Channel like I have added for Email Notification below:
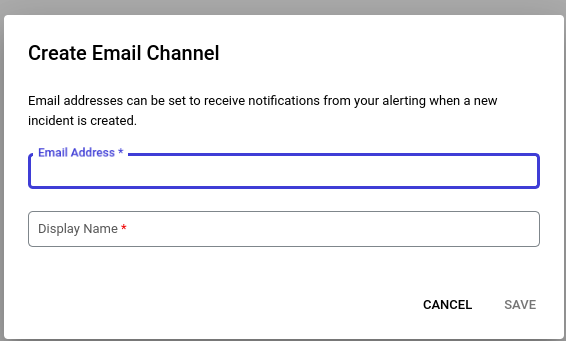
- when you click on ADD NEW a box will open like above and in that you have to give the Email Address and Display Name for your notification channel. Once you will click SAVE notification channel will be added like this:

Below is the image shows you the Notification Channel type and the Channel Display Name.

- Once the alert is created and it reaches as per the threshold value you will receive a mail like this.
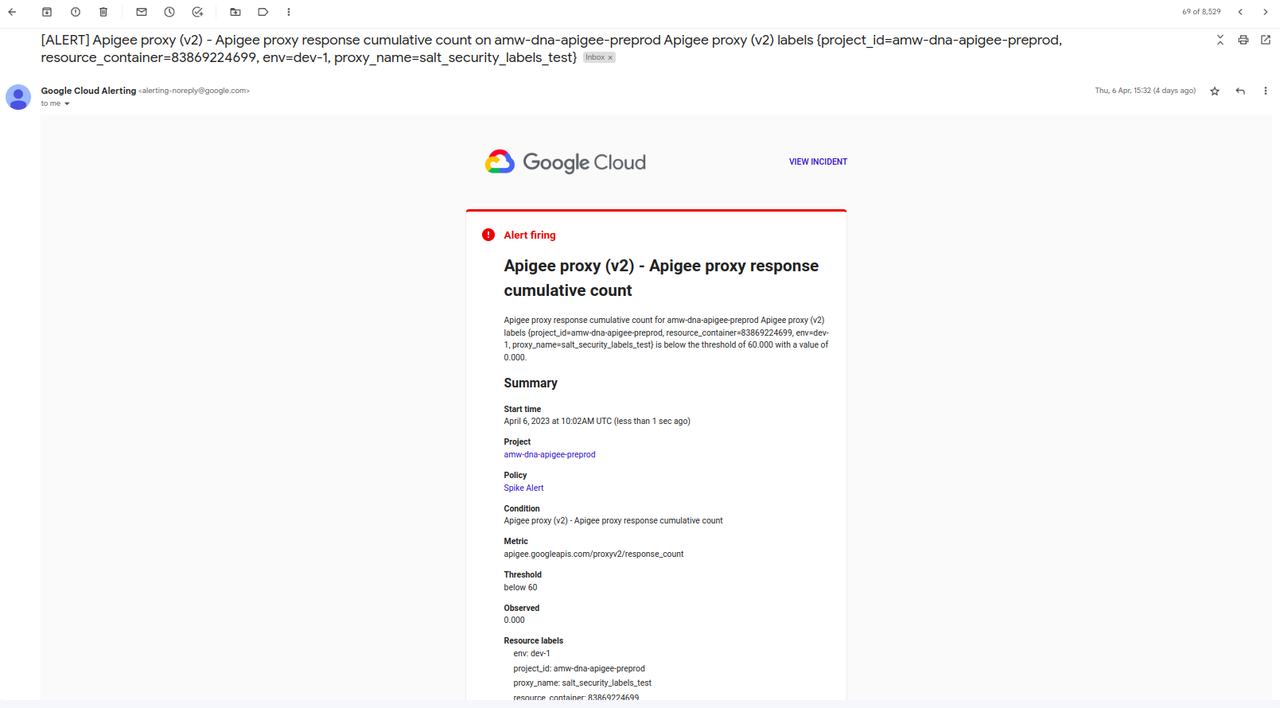
and once the issue is resolved for the condition we are getting alert notification again we’ll get notified with a mail like this.
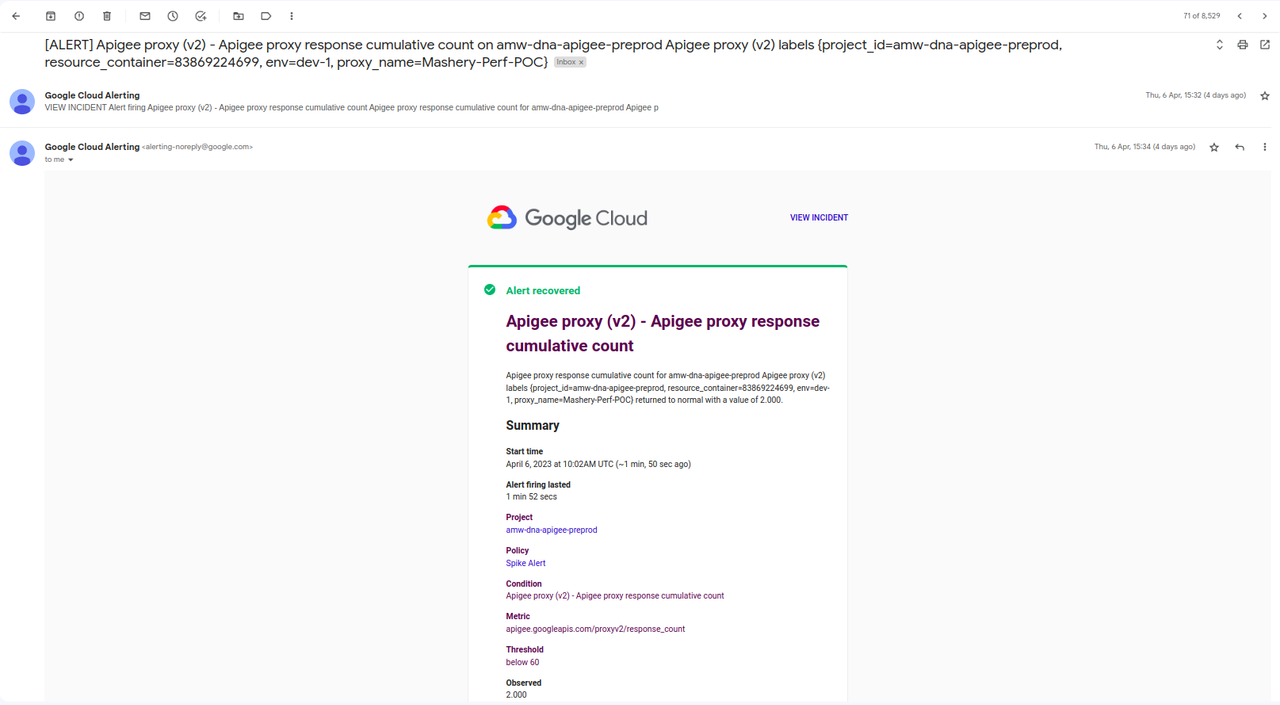
This is how we can create alerts and notifications in Apigee for API monitoring for the metrics we have in Apogee for alerting. In the same way we can create alerts and notifications for various metrics as Traffic Spike Alert, Latency Alert, Response Code, Error Rate and many more .
Conclusion
Creating alerts in Apigee for API monitoring is an important part of managing your APIs. By setting up alerts, you can be notified of issues before they become bigger problems. By following the steps outlined in this guide, you can create, manage, and delete alerts in Apigee with eases. So, in this blog you have learned how we can create alerts in apigee for API monitoring. Hope you have find this article useful. Feel free to ask you have any query.Contact me at deeksha.tripathi@nashtecglobal.com.
Thank You !!!
Happy Learning 🙂
Reference
https://cloud.google.com/apigee/docs/api-monitoring/alerts-notifications


