


In the dynamic landscape of modern software architecture, microservices have emerged as a solution to build scalable and agile applications. However, with the benefits of microservices also come complexities in managing their interactions and dependencies. This is where observability tools like Kiali come into play, offering a comprehensive suite of features that enable developers and operators to gain insights into their microservices ecosystem. In this deep-dive blog post, we will explore Kiali’s pivotal features: Service Graphs, Metrics Visualisation, and Tracing.
Visualising Microservices with Service Graphs
Microservices architectures involve multiple services communicating with each other to deliver application functionality. Understanding these interactions can be challenging, especially as systems scale. Kiali’s Service Graphs provide an intuitive visualisation of the relationships between microservices, depicting how requests flow through the system.
The benefits of Service Graphs include:
- Clarity: The graphical representation simplifies complex service interactions, aiding in identifying communication patterns and potential bottlenecks.
- Dependency Insights: Service Graphs reveal dependencies between services, enabling informed decision-making during optimisation and troubleshooting.
- Real-time Monitoring: Kiali’s real-time updates ensure you have the latest view of your microservices landscape.
In a microservices architecture, services rarely operate in isolation. They communicate with each other to fulfill user requests, and these interactions can become intricate as the number of services grows. Kiali’s Service Graphs offer a visual representation of these interactions, shedding light on the relationships and dependencies between services. This graphical representation helps developers and operators understand the flow of requests, showcasing which services are calling each other and how these calls traverse through the system.
Example
Imagine a scenario where an online retail application is built using microservices. When a user places an order, the application might involve various services for inventory management, payment processing, and order fulfilment. Visualising this complex interplay of services becomes challenging without a tool like Kiali. With the Service Graphs feature, you can see how each service interacts with others, forming a clear picture of the application’s functionality.
Monitoring Microservices Performance with Metrics Visualisation
Monitoring the performance of individual microservices and the overall system is essential to ensure seamless user experiences. Kiali seamlessly integrates with popular monitoring solutions like Prometheus, allowing you to gather and visualise key metrics related to service health, latency, and throughput.
The advantages of Metrics Visualisation include:
- Timely Insights: Kiali’s metrics visualisation offers real-time information on microservices performance, facilitating rapid anomaly detection and response.
- Historical Analysis: Historical metrics data empowers you to track performance trends, supporting decisions on scaling and optimisation.
- Threshold Alerts: Kiali can be configured to trigger alerts when performance metrics deviate from expected thresholds.
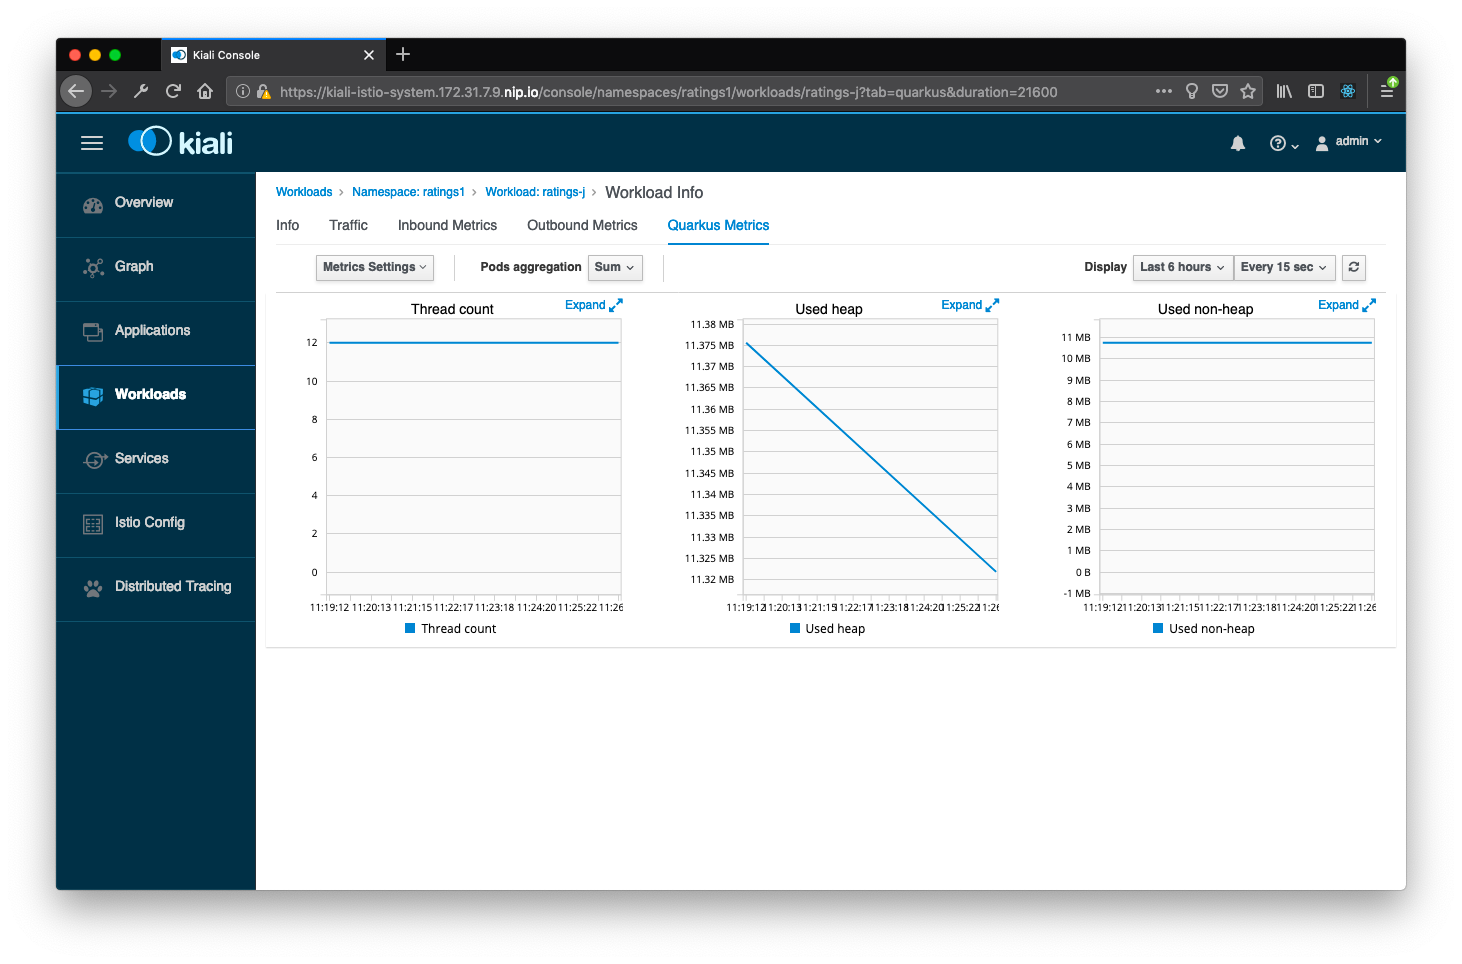
In the microservices realm, monitoring performance is non-negotiable. Each service contributes to the overall system’s health, and identifying performance bottlenecks or anomalies is crucial to maintaining a smooth user experience. Kiali’s Metrics Visualisation feature offers a holistic view of key performance metrics, enabling you to monitor the health and responsiveness of individual services and the entire system.
By integrating with monitoring solutions like Prometheus, Kiali provides real-time insights into metrics such as request rates, error rates, and latency. These metrics are essential indicators of service health and user experience. If a particular service experiences a sudden spike in latency or a surge in error rates, Kiali’s Metrics Visualisation feature immediately highlights these anomalies. This empowers operators to respond swiftly, mitigating potential issues before they impact end users.
Additionally, historical metrics data captured by Kiali allows you to analyse performance trends over time. This historical context is invaluable for understanding how your microservices architecture behaves under different conditions and loads. If, for instance, you notice that latency consistently increases during specific times of day, you can adjust resources or scaling strategies to accommodate the expected load.
Tracing Microservices Interactions
Understanding how requests traverse through a network of microservices is crucial for diagnosing latency issues and errors. Kiali’s integration with tracing solutions like Jaeger provides end-to-end visibility into the journey of requests, aiding in root cause analysis and performance optimisation.
The merits of Tracing include:
- Holistic Understanding: Tracing illuminates the complete path of a request, helping identify latency sources and optimising performance.
- Error Detection: When errors occur, tracing pinpoints the responsible service, streamlining debugging and troubleshooting.
- Performance Insights: By analysing traces, you can identify services contributing most to latency, guiding optimisation efforts.
In a microservices architecture, a single user request can trigger a cascade of interactions across multiple services. Tracing these interactions is akin to reconstructing the journey of a request as it moves through the system. Kiali’s Tracing feature, achieved through integration with tracing solutions like Jaeger, provides developers and operators with a granular view of these interactions.
Distributed tracing allows you to track the lifecycle of a request, from the moment it enters the system to when it exits. Each service interaction is captured as a “trace,” containing information about the time taken at each step and any potential errors encountered. This trace data is invaluable for diagnosing performance issues and optimising the architecture.
Example
Consider a scenario where a user reports a slow checkout process in an e-commerce application. Without distributed tracing, identifying the root cause of this issue could be time-consuming and challenging. However, with Kiali’s Tracing feature, you can examine the complete path of the user’s checkout request. If the tracing data reveals that a specific service is consistently adding to the latency, you can focus your optimisation efforts on that service.
Furthermore, tracing helps in understanding how errors propagate through the system. If a user encounters an error during their interaction with the application, Kiali’s tracing feature can pinpoint the exact service responsible for the error. This accelerates the debugging and troubleshooting process, allowing developers to address issues promptly.
Achieving Holistic Observability
Kiali’s service graphs, metrics visualisation, and tracing capabilities collectively provide a holistic observability solution for microservices architectures. By harnessing these features, developers and operators gain comprehensive insights into system behaviour, performance, and interactions. This empowers proactive issue resolution, performance optimisation, and improved user experiences.
In conclusion, Kiali serves as a crucial ally in managing the intricacies of microservices. Its Service Graphs offer visual clarity, Metrics Visualisation provides real-time and historical performance data, and Tracing enables deep insights into request flows. By leveraging Kiali’s features, you can confidently navigate the complexities of microservices architectures, ensuring the reliability and efficiency of your applications.